

The next HighLoad++ conference will be held on April 6 and 7, 2020, in St. Petersburg. Details and tickets. . HighLoad++ Moscow 2018. Hall ‘Moscow’. November 9, 15:00. Abstract and .

* Monitoring — online and analytics.
* Key constraints of the ZABBIX platform.
* Solution for scaling analytics storage.
* ZABBIX server optimization.
* UI optimization.
* Experience of operating the system under loads exceeding 40k NVPS.
* Brief conclusions.
Mikhail Makurov (hereinafter – MM): – Hello everyone!
Maxim Chernytsov (hereinafter – MC): – Good afternoon!
MM: – Allow me to introduce Maxim. Max is a talented engineer, the best network specialist I know. Maxim works with networks and services, their development and operation.

MC: – And I would like to talk about Mikhail. Mikhail is a C developer. He has written several high-load traffic processing solutions for our company. We live and work in the Urals, in the city of tough men, Chelyabinsk, at the company ‘Intersvyaz’. Our company is an internet and cable television service provider for one million people in 16 cities.
MM: – And it is worth saying that ‘Intersvyaz’ is much more than just a provider; it is an IT company. Most of our solutions are developed by our IT department.
A: From the servers processing traffic to the call center and mobile application. The IT department currently has about 80 people with very diverse competencies.
About Zabbix and its architecture
MC: – Now I will try to break my personal record and explain what Zabbix (hereinafter – ‘Zabbix’) is in one minute.
‘Zabbix’ positions itself as an enterprise-level monitoring system ‘out of the box’. It has many life-simplifying features: advanced escalation rules, API for integration, host and metric grouping and auto-discovery. ‘Zabbix’ has so-called scaling tools – proxies. ‘Zabbix’ is an open-source system.
Briefly about the architecture. It can be said to consist of three components:
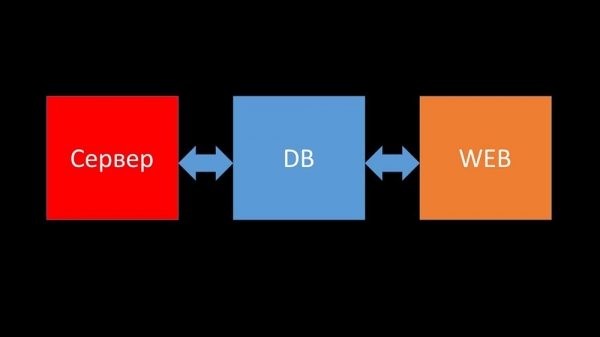
- Server. Written in C. With quite complex processing and information transfer between threads. All processing occurs here: from receiving to saving in the database.
- All data is stored in the database. ‘Zabbix’ supports MySQL, PostgreSQL, and Oracle.
- The web interface is written in PHP. It is typically provided with the Apache server, but it works more efficiently in conjunction with nginx + php.
Today, we would like to share a story from the life of our company related to 'Zabbix'...
A story from the life of the company 'Intersvyaz'. What do we have and what do we need?

5 or 6 months ago. One day after work...
MC: – Misha, hi! I'm glad I caught you – we need to talk. We've had issues with monitoring again. During a major incident, everything slowed down, and there was no information about the network status. Unfortunately, this isn't the first time it's happened. I need your help. Let's make sure our monitoring works under any circumstances!
MM: – But first, let's synchronize. I haven't looked at it for a couple of years. As far as I remember, we abandoned Nagios and switched to 'Zabbix' about 8 years ago. And now we seem to have 6 powerful servers and about a dozen proxies. Am I mistaken?
MC: – Almost. 15 servers, some of which are virtual machines. The most important thing is that it doesn't save us when we need it the most. Whenever there's an incident, the servers slow down, and nothing is visible. We tried optimizing the configuration, but it hasn't provided the optimal performance boost.
MM: – I see. Have you looked into anything? Found out anything from the diagnostics?
MC: – The first thing we have to deal with is the database. MySQL is already under constant load, saving new metrics, and when 'Zabbix' begins generating a bunch of events, the database literally goes down for a few hours. I already told you about optimizing the configuration, but just this year we updated the hardware: the servers have over a hundred gigabytes of memory and SSD RAID storage – there's no point in scaling it linearly further. What should we do?
MM: – I see. In general, MySQL is an LTP database. Apparently, it is no longer suitable for storing archived metrics of our size. Let's figure it out.
MC: – Let's do it!
Integration of Zabbix and Clickhouse as the result of a hackathon
After a while, we obtained interesting data:
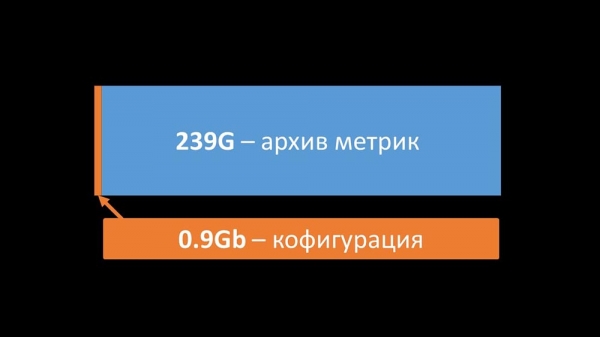
Most of the space in our database was occupied by the metrics archive, with less than 1% used for configuration, templates, and settings. By that time, we had been operating a Big Data solution based on Clickhouse for over a year. The direction of movement was clear for us. At our spring hackathon, I wrote an integration between Zabbix and Clickhouse for the server and frontend. At that moment, Zabbix already had support for ElasticSearch, and we decided to compare them.
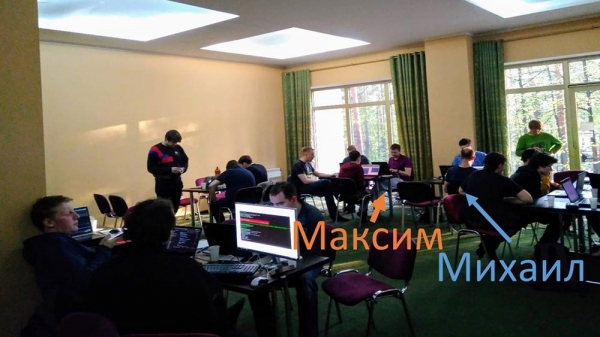
Comparison of Clickhouse and Elasticsearch
MM: – For the comparison, we generated the same load as the Zabbix server and observed how the systems would behave. We wrote data in batches of 1000 rows, using CURL. We anticipated that Clickhouse would be more efficient for the load profile that Zabbix produces. The results even exceeded our expectations:
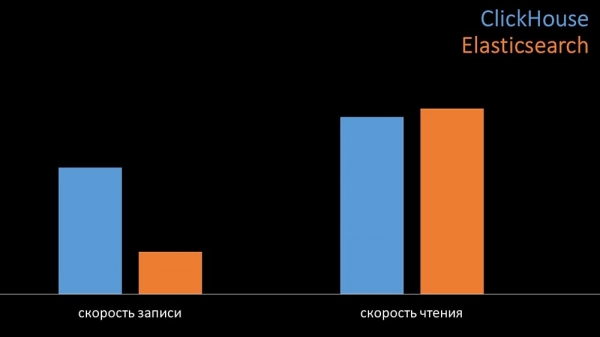
Under the same conditions in the tests, Clickhouse wrote three times more data. Both systems consumed resources very efficiently when reading data. However, ElasticSearch required a significant amount of CPU during writes:
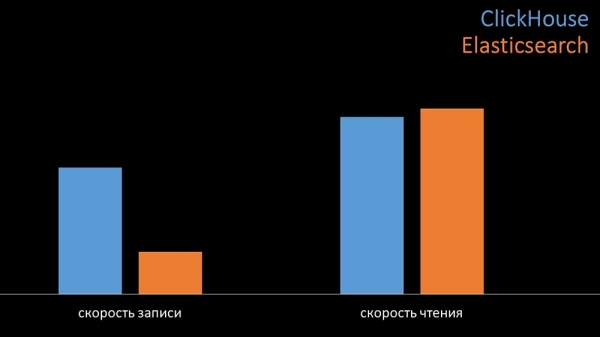
Overall, Clickhouse significantly outperformed ElasticSearch in CPU consumption and speed. Additionally, due to data compression, Clickhouse uses 11 times less space on the hard drive and performs approximately 30 times fewer disk operations:
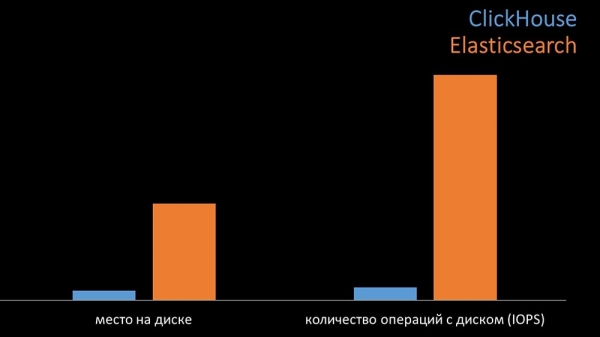
MC: – Yes, the disk subsystem in Clickhouse is implemented very efficiently. You can use huge SATA disks for databases and achieve write speeds of hundreds of thousands of rows per second. The system supports sharding and replication out of the box and is quite easy to configure. We are more than satisfied with its operation over the past year.
To optimize resources, Clickhouse can be installed alongside the existing main database, thus saving a significant amount of CPU time and disk operations. We transferred the metrics archive to the already existing Clickhouse clusters:
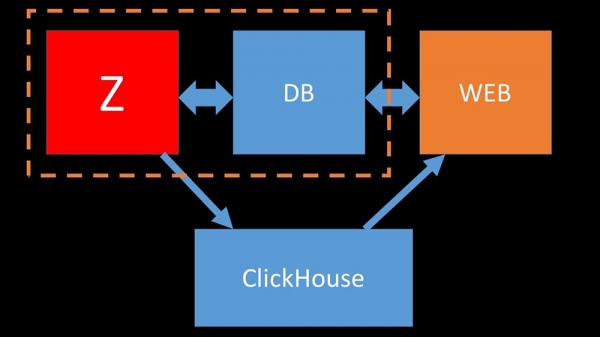
We unloaded the main MySQL database so much that we could combine it on one machine with the Zabbix server and abandon a dedicated server for MySQL.
How does polling work in Zabbix?
4 months ago
MM: – Well, can we forget about the database issues?
MC: – That's right! Another task we need to solve is the slow data collection. Now all our 15 proxy servers are overloaded with SNMP processes and polling. There's no way around it but to set up new servers.
MM: – Great. But first, tell me how polling works in Zabbix?
MC: – In short, there are 20 types of metrics and a dozen ways to obtain them. Zabbix can collect data either in a 'request-response' mode or wait for new data through the Trapper Interface.

It's worth noting that in the original Zabbix, this method (Trapper) is the fastest.
There are proxy servers for load distribution:
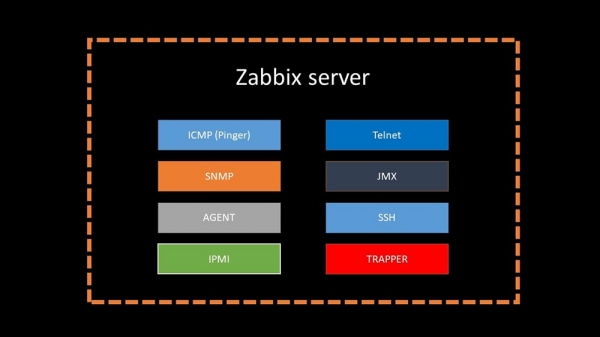
Proxies can perform the same data collection functions as the Zabbix server, receiving tasks from it and sending collected metrics via the Trapper interface. This is the officially recommended method for load distribution. Proxies are also beneficial for monitoring remote infrastructure operating through NAT or slow channels:
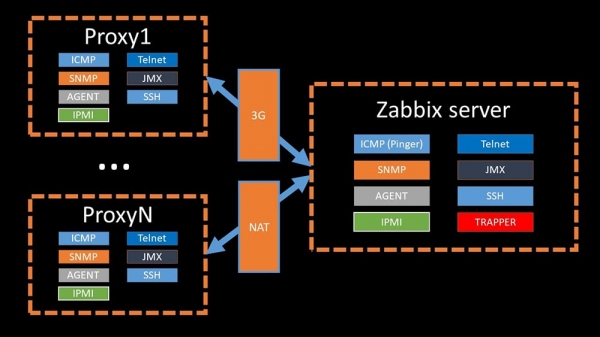
MM: – The architecture is clear. We need to look at the source code…
A couple of days later
The tale of how nmap fping triumphed
MM: – It seems I've uncovered something.
MC: – Tell me!
MM: – I discovered that when checking availability, Zabbix checks a maximum of 128 hosts simultaneously. I tried increasing this number to 500 and removed the interpacket interval in their ping – this doubled the performance. But I would like even larger numbers.
MC: – In my experience, I sometimes need to check the availability of thousands of hosts, and I haven't seen anything faster than nmap for this. I am sure it's the fastest way. Let's give it a try! We need to significantly increase the number of hosts per iteration.
MM: – Check more than five hundred? 600?
MC: – At least a couple of thousand.
MM: – Okay. The most important thing I wanted to say: I found that most polling in Zabbix is done synchronously. We absolutely need to switch to an asynchronous mode. Then we can drastically increase the number of metrics collected by pollers, especially if we increase the number of metrics per iteration.
MC: – Awesome! And when?
MM: – As usual, yesterday.
MC: – We compared both versions of fping and nmap:
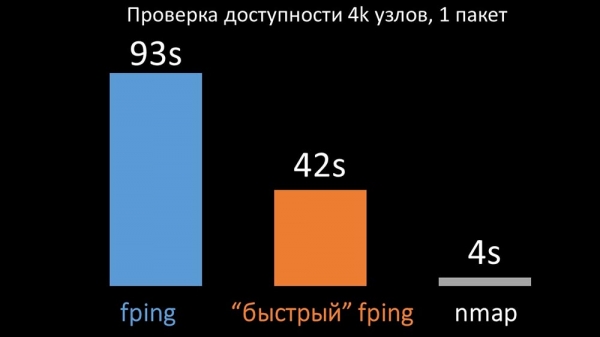
On a large number of hosts, nmap was predictably up to five times more effective. Since nmap only checks the availability and response time, we moved the loss counting to triggers and significantly reduced the availability check intervals. We found that the optimal number of hosts for nmap is around 4,000 per iteration. Nmap allowed us to reduce CPU costs for availability checks threefold and shortened the interval from 120 seconds to 10.
Polling Optimization
MM: – Then we focused on pollers. Our main interest was in SNMP polling and agents. In 'Zabbix', polling is done synchronously, and special measures have been taken to increase the efficiency of the system. In synchronous mode, the unavailability of hosts causes significant degradation of polling. There is a whole system of states, and there are special processes — so-called unreachable pollers, which only work with unavailable hosts:

This is a comment that demonstrates the state matrix, capturing the entire complexity of the transition system required for the system to remain efficient. Furthermore, synchronous polling itself is quite slow:
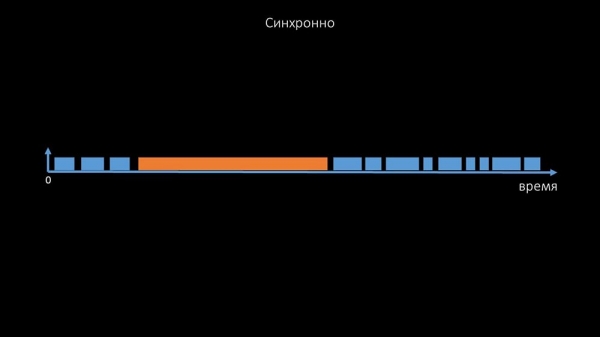
That is why thousands of poller threads on a dozen proxies could not gather the required amount of data. The asynchronous implementation solved not only the problems with the number of threads but also significantly simplified the state system of unavailable hosts, because for any number of hosts checked in one polling iteration, the maximum wait time was 1 timeout:
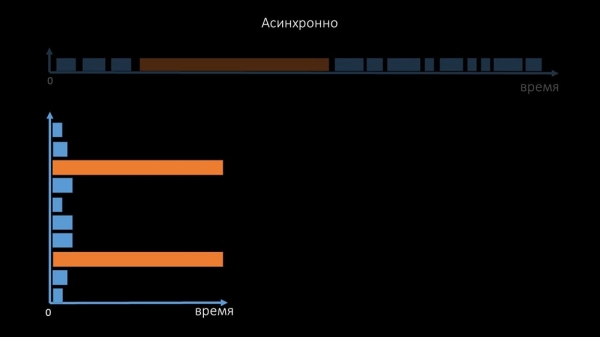
Additionally, we modified and improved the polling system for SNMP requests. The fact is that most cannot respond to multiple SNMP requests simultaneously. Therefore, we created a hybrid mode where SNMP polling of the same host is done asynchronously:
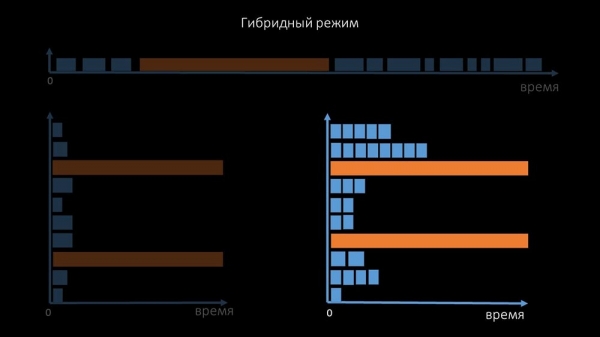
This is done for a whole batch of hosts. This mode ultimately is not slower than fully asynchronous, as polling one and a half hundred SNMP values is still much faster than 1 timeout.
Our experiments showed that the optimal number of requests in one iteration is about 8,000 in SNMP polling. Overall, switching to asynchronous mode allowed us to accelerate polling performance by 200 times, several hundred times.
MC: The polling optimizations have shown that we can not only eliminate all proxies but also shorten intervals for many checks, rendering proxies unnecessary as a load distribution method.
About three months ago
Change architecture – increase load!
MM: Well, Max, is it time for production? I need a powerful server and a good engineer.
MC: Alright, let’s plan. It’s high time we moved from the deadlock of 5000 metrics per second.
The morning after the upgrade
MC: Misha, we upgraded, but by morning we rolled back… Guess what speed we managed to reach?
MM: About 20k maximum.
MC: Aha, 25! Unfortunately, we're right back where we started.
MM: What happened? Did you conduct any diagnostics?
MC: Yes, of course! For example, here's an interesting top:
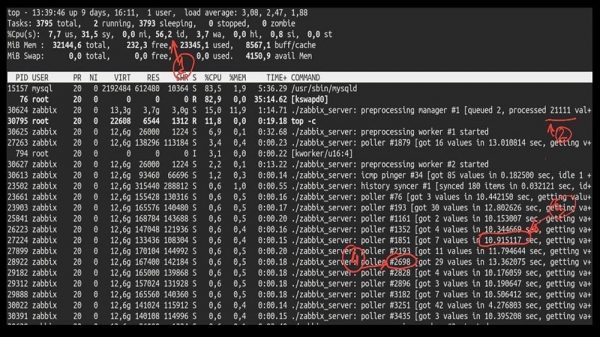
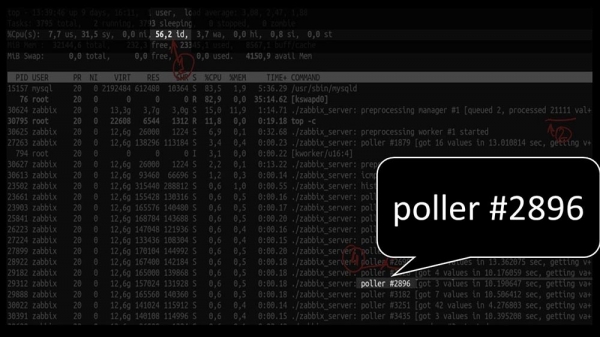
MM: Let’s take a look. I see we tried a huge number of polling threads:
But we couldn’t even utilize the system halfway:
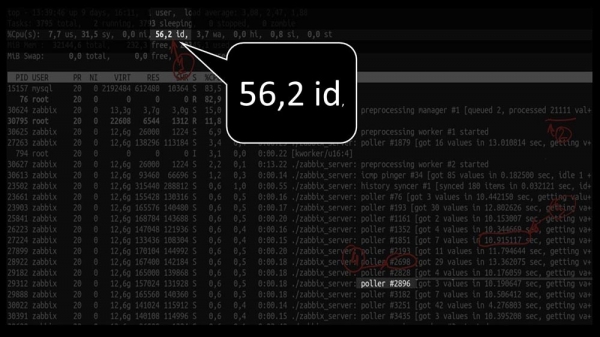
And the overall performance is quite low, around 4000 metrics per second:
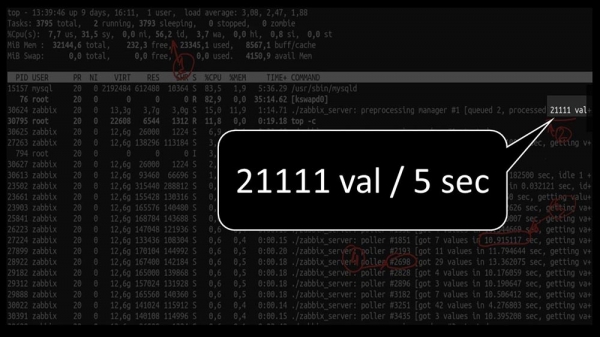
Is there anything else?
MC: Yes, strace of one of the pollers:
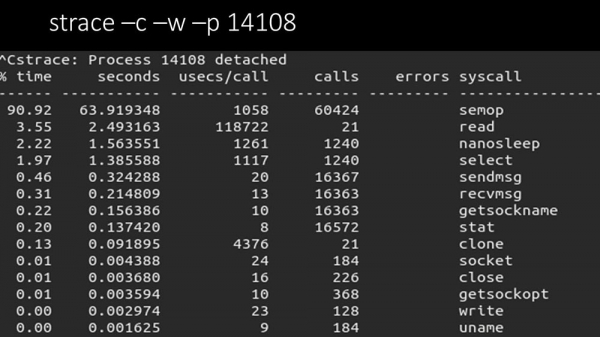
MM: Here it's clear that the polling process is waiting for 'semaphores'. These are locks:
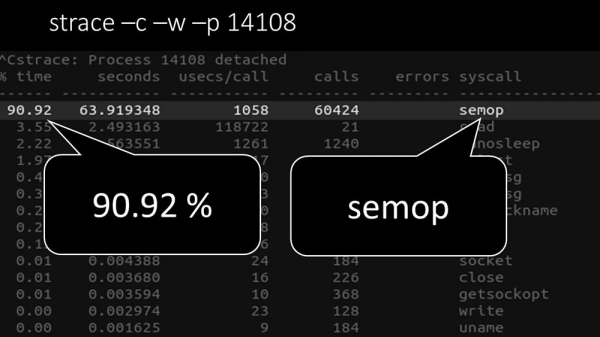
MC: Unclear.
MM: Look, this resembles a situation where a bunch of threads is trying to work with a resource that can only be accessed by one at a time. Thus, all they can do is share that resource over time:
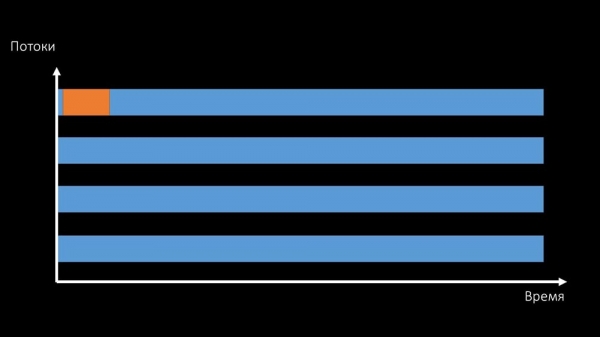
And the total performance of working with such a resource is limited by the speed of a single core:
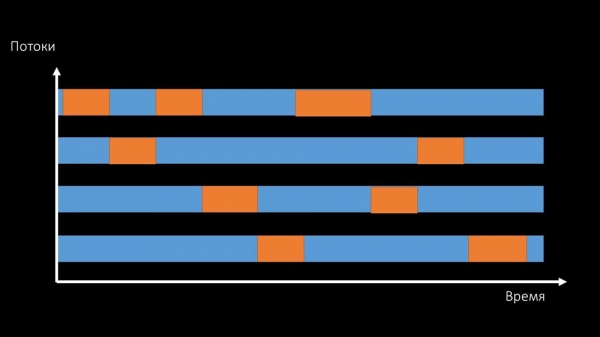
This kind of problem can be solved in two ways.
Upgrade the machine's hardware to switch to faster cores:
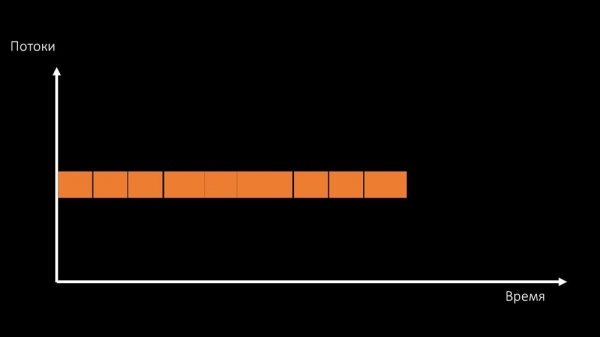
Or change the architecture and simultaneously the load:
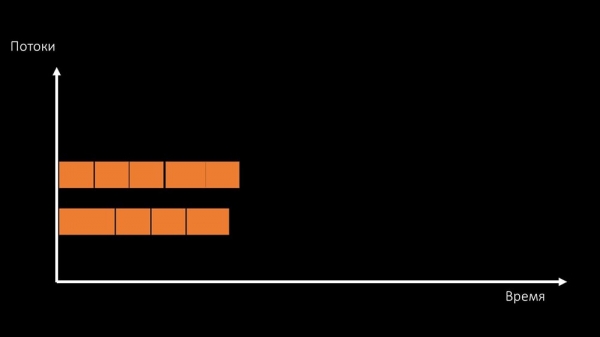
MC: By the way, on the test machine, we’ll use fewer cores than in production, but they are about 1.5 times faster in terms of frequency per core!
MM: Got it? We need to look at the server code.
Data flow in the Zabbix server
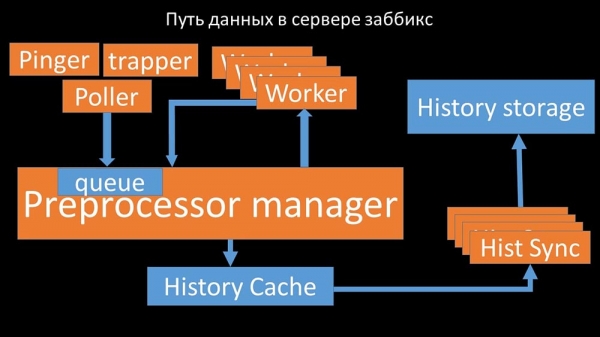
MC: To figure this out, we began analyzing how data is transmitted within the Zabbix server:
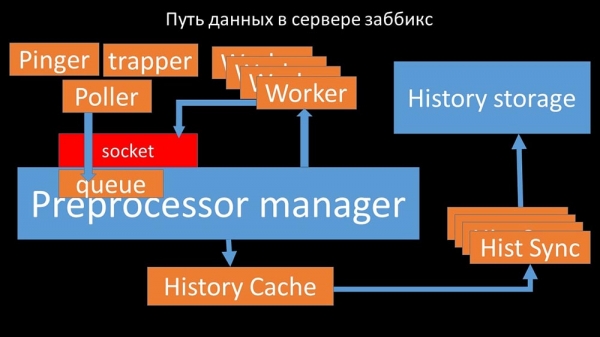
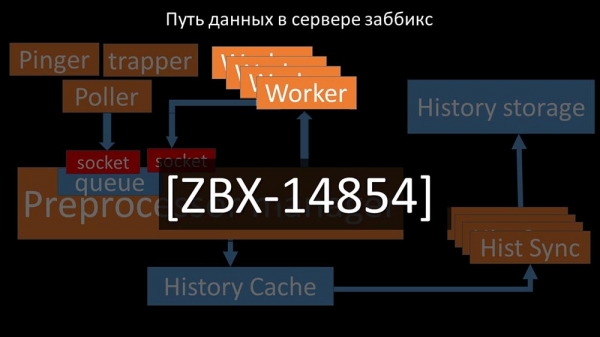
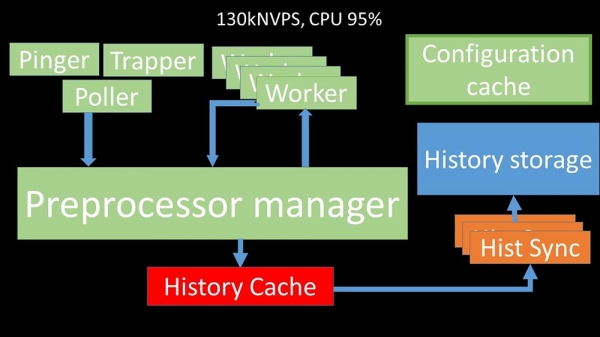
Cool diagram, right? Let’s walk through it step by step to clarify things a bit. There are threads and services responsible for collecting data:
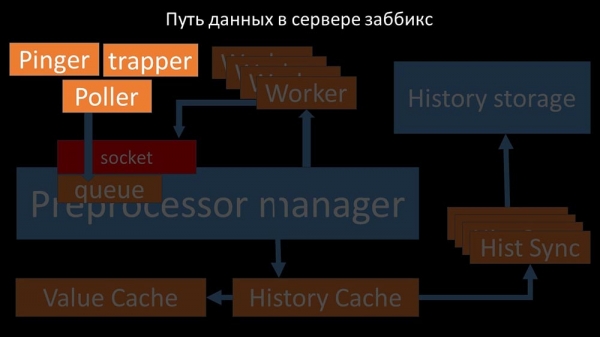
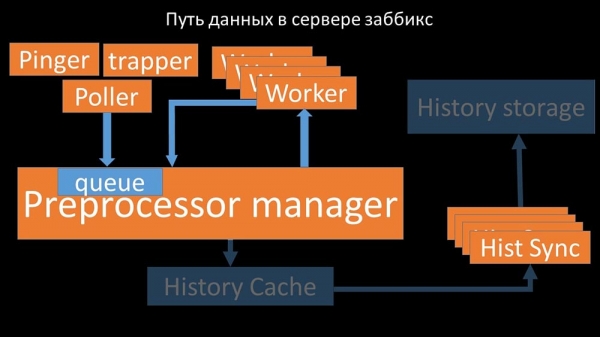
The collected metrics are sent through a socket to the Preprocessor manager, where they are stored in a queue:
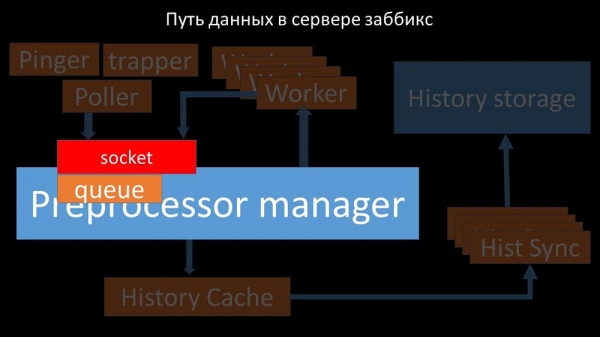
The Preprocessor Manager sends the data to its workers, who execute preprocessing instructions and return them through the same socket:
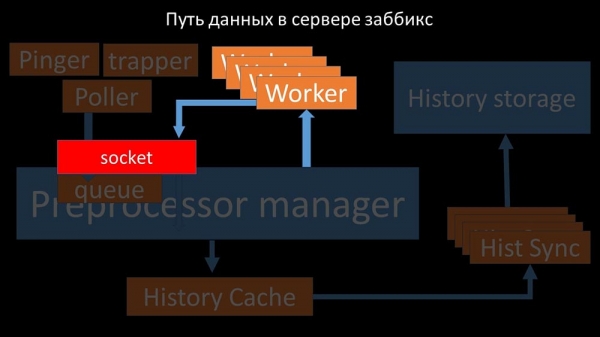
After this, the preprocessor manager saves them in the history cache:
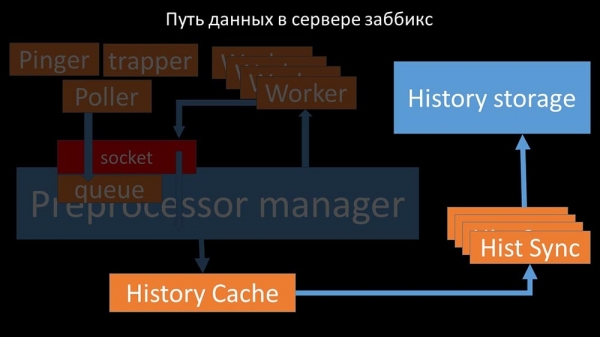
From there, they are retrieved by history syncers, which perform quite a number of functions: for example, calculating triggers, filling the cache with values, and most importantly, saving metrics to the history storage. In general, the process is complex and quite convoluted.
MM: – The first thing we noticed was that most threads compete for the so-called 'configuration cache' (the memory area where all server configurations are stored). There are particularly many locks made by the threads responsible for data retrieval:
…since the configuration not only stores metrics with their parameters, but also queues from which pollers take information about what to do next. When there are many pollers and one blocks the configuration, the others wait for requests:
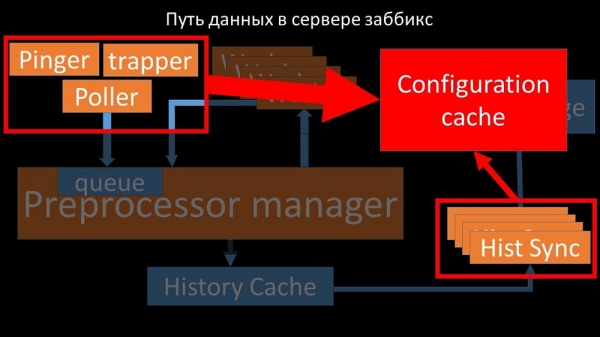
Pollers should not conflict
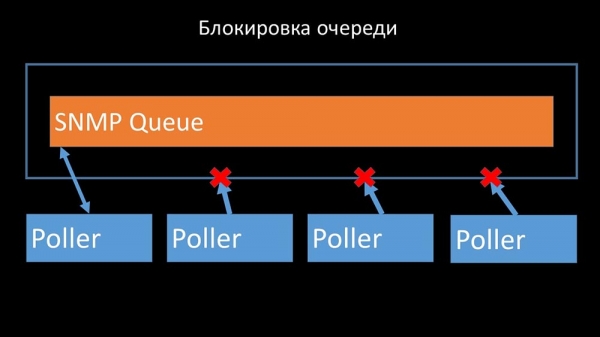
So the first thing we did was divide the queue into 4 parts and allowed pollers to safely block these queues, these parts simultaneously:
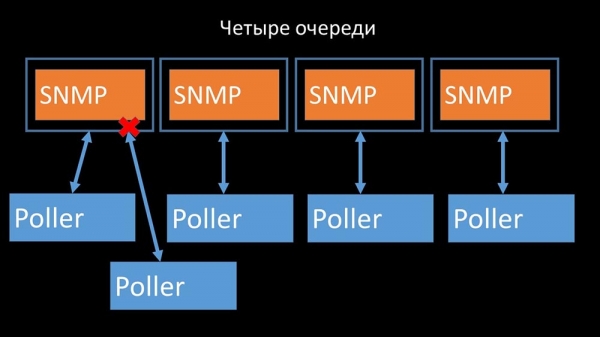
This removed the competition for the configuration cache, and the pollers' speed significantly increased. But then we faced the issue that the preprocessor manager started to accumulate a queue of tasks:
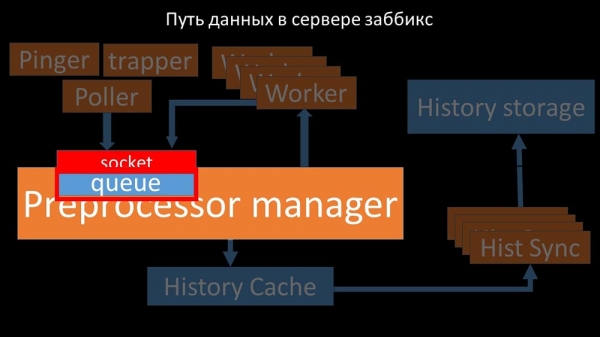
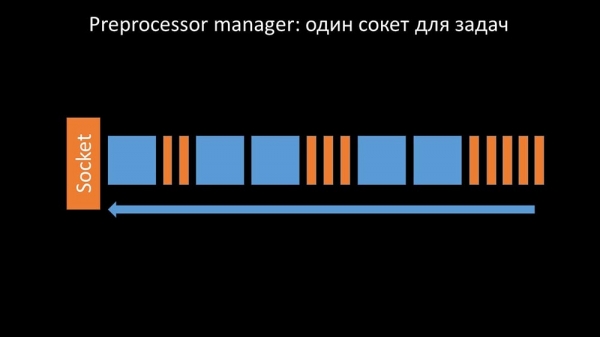
The preprocessor manager needs to be able to prioritize tasks
This occurred in cases where it lacked performance. Then all it could do was accumulate requests from data collection processes and stack them in the buffer until it consumed all the memory and crashed:
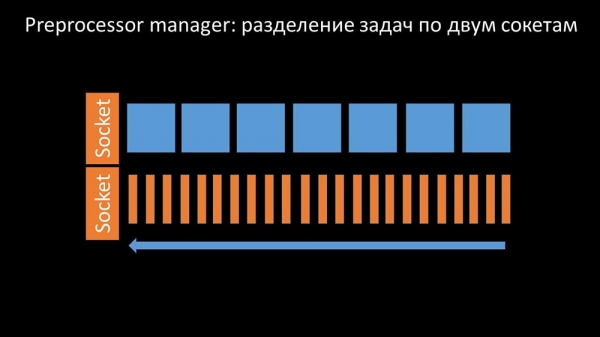
To address this problem, we added a second socket that was specifically allocated for workers:
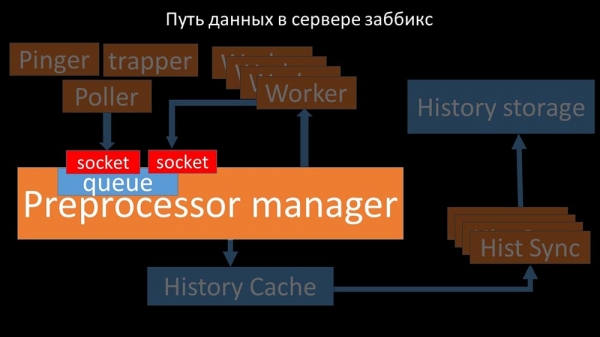
Thus, the preprocessor manager gained the ability to prioritize its work and in case of buffer growth, to delay the collection, allowing the workers to take that buffer:
Then we discovered that one of the reasons for slowdowns was the workers themselves, as they competed for a completely unimportant resource for their work. We resolved this issue with a bug fix, and it has already been addressed in new versions of 'Zabbix':
Increasing the number of sockets yields results
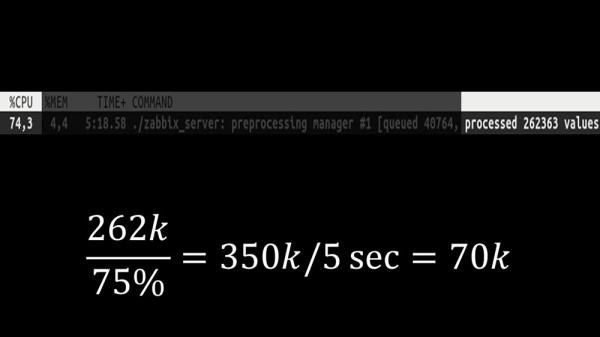
Next, the preprocessor manager became the bottleneck as it operates on a single thread. It hit the core speed, allowing a maximum speed of about 70,000 metrics per second:
That's why we created four, with four sets of sockets and workers:
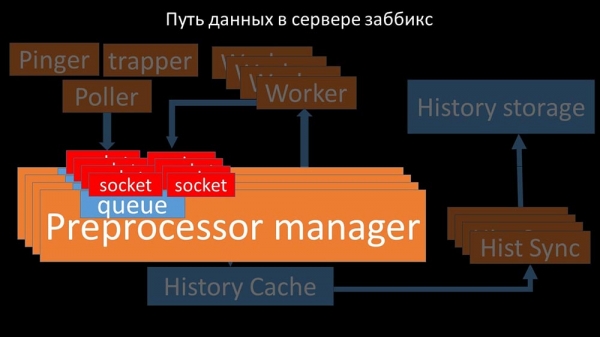
And this allowed us to increase the speed to about 130,000 metrics:
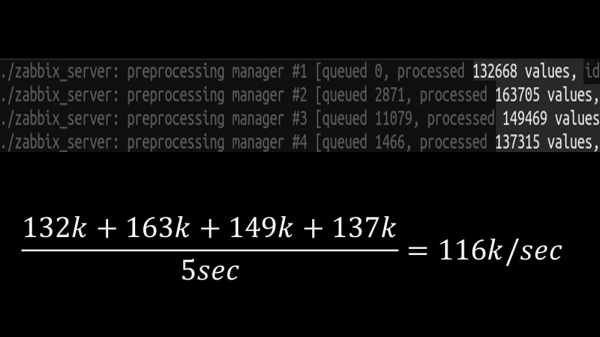
The non-linear growth is explained by the emergence of competition for cache history. Four preprocessor managers and history syncers were competing for it. By this point, we were receiving about 130,000 metrics per second on the test machine, utilizing it around 95% in terms of CPU:
About 2.5 months ago
Abandoning the snmp-community increased NVPs by one and a half times
MM: – Max, I need a new test machine! We can't fit into the current one anymore.
MC: – What do we have now?
MM: – Right now – 130k NVPs and the CPU is 'on the shelf'.
MC: – Wow! Cool! Wait, I have two questions. According to my calculations, our need is around 15-20 thousand metrics per second. Why do we need more?
MM: – I want to see it through to the end. I want to see how much we can squeeze out of this system.
MC: – But...
MM: – But it's useless for business.
MC: – Got it. And the second question: can we maintain what we have now on our own, without the developer's help?
MM: – I don’t think so. Changing how we work with the configuration cache is an issue. It affects changes in most threads and is fairly complex to maintain. Most likely, it will be very difficult to support.
MC: – Then we need some alternative.
MM: – There's such an option. We can switch to fast cores while abandoning the new locking system. We will still achieve performance of 60-80 thousand metrics. At the same time, we can keep all the other code. ClickHouse, asynchronous polling will work. And it will be easy to maintain.
MC: – Wonderful! I suggest we stop here.
After optimizing the server part, we finally managed to launch the new code into production. We abandoned some changes in favor of switching to a machine with fast cores and minimizing changes in the code. We also simplified the configuration and, where possible, abandoned macros in data elements, as they are a source of additional locking.

For example, abandoning the often-used macro snmp-community in our case allowed us to accelerate NVPs by about 1.5 times.
After two days in production
Removing the incident history pop-ups
MC: – Misha, we have been using the system for two days, and everything works. But only when everything is working! We had scheduled maintenance involving the transfer of a large segment of the network, and we manually checked what was up and what wasn’t.
MM: – It can't be! We checked everything 10 times. The server processes even a complete network outage instantly.
MC: – I understand everything: server, database, top, austat, logs – everything is fast... But we are looking at the web interface, and there it shows the processor ‘idle’ on the server and this:

MM: – I see. Let's look at the web. We discovered that in situations with a large number of active incidents, most operational widgets started working very slowly:
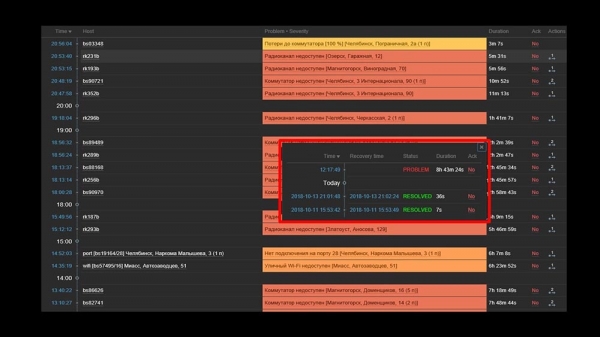
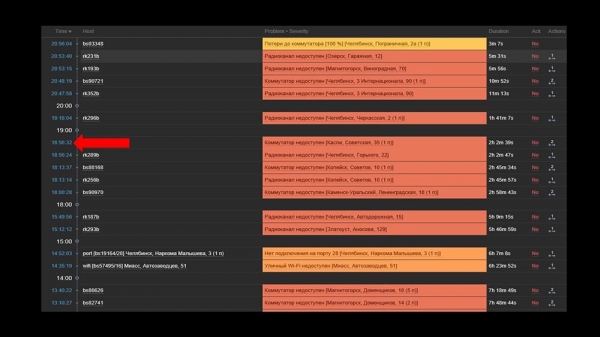
The reason for this was the generation of pop-up windows with incident histories, which are created for each item in the list. Therefore, we decided to disable these windows (commented out 5 lines in the code), and that solved our problems.
The load time for the widgets, even during complete unavailability, decreased from several minutes to acceptable 10-15 seconds, and the history can still be viewed by clicking on the time:
After the job. 2 months ago
MC: – Misha, are you leaving? We need to talk.
MM: – I wasn't planning on it. Is it something again with Zabbix?
MC: – No, relax! I just wanted to say: everything works, thank you! My treat for beer.
Zabbix is effective
Zabbix is a fairly versatile and feature-rich system. It can be used for small installations 'out of the box', but as needs grow, it has to be optimized. For storing a large archive of metrics, use an appropriate storage:
- you can use built-in tools like integration with Elasticsearch or exporting history to text files (available from version four);
- you can leverage our experience and integration with ClickHouse.
To drastically increase the speed of metric collection, gather them using asynchronous methods and send them through the trapper interface to the Zabbix server; alternatively, you can use a patch for the asynchronous polling of Zabbix itself.
Zabbix is written in C and is quite efficient. However, addressing a few narrow architectural spots can further enhance its performance, and based on our experience, it can handle over 100,000 metrics on a single-processor machine.
That same Zabbix patch
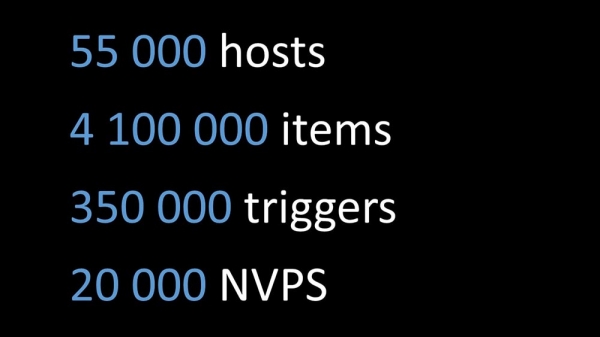
MM: – I want to add a couple of points. The entire current report, all tests, and figures are based on the configuration we are using. We are currently pulling about 20,000 metrics per second from it. If you're trying to understand whether this will work for you, you can compare. What we've discussed today is available on GitHub as a patch:

The patch includes:
- full integration with ClickHouse (for both Zabbix server and frontend);
- resolving issues with the preprocessor manager;
- asynchronous polling.
The patch is compatible with all version 4.x, including LTS. Most likely, with minimal changes, it will work on version 3.4.
Thank you for your attention.
Questions
Question from the audience (A): – Good day! Could you please tell us if you have plans for intensive interaction with the Zabbix team or them with you, so that this is not just a patch, but standard behavior for Zabbix?
MM: – Yes, we will definitely commit some of the changes. Some elements will remain in the patch.
A: – Thank you very much for the excellent presentation! Could you please tell us if support from Zabbix will remain after applying the patch and how to update to higher versions later? Will it be possible to upgrade Zabbix to 4.2, 5.0 after your patch?
MM: – I can't comment on support. If I were Zabbix technical support, I would probably say no, because this is third-party code. Regarding the codebase for 4.2, our position is: 'We will keep up with the times and will update to the next version ourselves.' Therefore, for some time, we will provide the patch for updated versions. I mentioned in the report that the number of changes between versions is still relatively small. I think the transition from 3.4 to 4 took us about 15 minutes. Some things changed, but they are not very important.
A: – So you plan to maintain your patch and it can safely be deployed in production, receiving updates in some manner afterward?
MM: – We strongly recommend it. It resolves many issues for us.
MC: Once again, I would like to emphasize that the changes that do not involve architecture and do not relate to blocks or queues are modular and exist in separate modules. They can be maintained relatively easily even with minor changes.
MM: If you are interested in the details, ClickHouse uses what's known as a history library. It is decoupled – it is a copy that supports Elastic, meaning it is configurable. Polling only changes the pollers. We believe this will work for a long time.
A: Thank you very much. Could you tell me if there is any documentation for the changes made?

MM: Documentation is the patch. Obviously, with the introduction of ClickHouse and new types of pollers, new configuration options arise. The link from the last slide provides a brief description of how to use it.
On replacing fping with nmap
A: How did you ultimately implement this? Can you give specific examples: do you have strappers and an external script? What checks such a massive number of hosts so quickly? How do you obtain these hosts? Do you need to feed them to nmap, obtain them from somewhere, store them, and run something?
MM: Great. That's a very relevant question! Here's the gist: We modified the library (ICMP ping, a part of Zabbix) for ICMP checks, where the packet count is set to one (1), and the code attempts to use nmap. So this is internal Zabbix work, which became internal work for the pinger. Consequently, no synchronization or use of a trapper is required. This was done intentionally to keep the system cohesive and avoid struggling with synchronizing two database systems: what to check, how to send via the poller, and whether our data ingestion has failed... This is much simpler.
A: Does it work for proxies as well?
MM: Yes, but we haven’t tested it. The polling code is the same in Zabbix and on the server. It should work. Again, I emphasize: the system's performance is such that we do not need a proxy.
MC: The right answer to the question is: 'Why do you need a proxy with such a system?' Only for NAT or monitoring through some slow channel...
A: So you use Zabbix as an alertor, if I understood correctly. Or have the graphs (where the archival layer is) gone to another system, like Grafana? Or do you not use this functionality?
MM: – I want to emphasize again: we have completed full integration. We are transferring history to 'ClickHouse', but we have also changed the PHP frontend. The PHP frontend connects to 'ClickHouse' and generates all graphs from there. Honestly, we also have a part that builds data in other graphical representation systems from the same 'ClickHouse' and the same 'Zabbix' data.
MC: – Including in 'Grafana'.
How was the decision made regarding resource allocation?
A: – Share a bit about your internal processes. How was the decision made to allocate resources for a serious product overhaul? This certainly involves some risks. And please tell us, in the context of supporting new versions, how is this decision justified from a management perspective?
MM: – Apparently, we did not convey the drama of the situation very well. We found ourselves in a position where we had to do something, and we essentially proceeded with two parallel teams:
- One focused on launching a monitoring system using new methods: monitoring as a service, a standard set of open-source solutions that we combine and then try to change our business processes to work with the new monitoring system.
- At the same time, we had an enthusiastic programmer working on this (about himself). It turned out that he succeeded.
A: – And what is the size of the team?
MC: – They are right in front of you.
A: – So, as always, a passionate person is needed?
MM: – I don't know what a passionate person is.
A: – In this case, apparently, it is you. Thank you very much, you are awesome.
MM: – Thank you.
About patches for Zabbix
A: – For a system that uses proxies (for instance, in some distributed systems), is it possible to adapt and patch your solution, say, for pollers, proxies, and partially for the preprocessor of Zabbix itself; and their interaction? Is it possible to optimize existing developments for a system with multiple proxies?
MM: – I know that the Zabbix server is built using proxies (it is compiled and the code is generated). We haven’t tested this in production. I’m not sure about it, but I believe that the preprocessor manager is not used in proxies. The proxy's task is to acquire a set of metrics from Zabbix, pull them (it also records the configuration, local database) and return them to the Zabbix server. The preprocessing will be done by the server itself once it receives the data.
The interest in proxies is understandable. We will check this. It's an intriguing topic.
A: – The idea was this: if we can patch pollers, we can patch them for proxies and modify the interaction with the server, adapting the preprocessor for these purposes only on the server.
MM: – I think it's even simpler. You take the code, apply the patch, then configure it as you need – assemble proxy servers (for instance, with ODBC) and distribute the patched code across systems. Where necessary, you set up proxies, where necessary, the server.
A: – Additionally, we probably won't have to patch the proxy transmission to the server?
MC: – No, it's standard.
MM: – In fact, one of the ideas wasn't mentioned. We have always maintained a balance between an explosion of ideas and the amount of changes, and ease of support.

A little advertisement 🙂
Thank you for staying with us. Do you enjoy our articles? Want to see more interesting content? Support us by placing an order or recommending us to your friends, , a unique entry-level server alternative that we have created for you: (options available with RAID1 and RAID10, up to 24 cores and up to 40GB DDR4).
Dell R730xd at half the price in the Equinix Tier IV data center in Amsterdam? Only with us in the Netherlands! Dell R420 — 2x E5-2430 2.2GHz 6C 128GB DDR3 2x960GB SSD 1Gbps 100TB — from $99! Read about how
Source: habr.com
