


Elasticsearch is faced by many. But what happens when you want to use it to store logs in "large volumes"? And do so without pain when any of several data centers fail? What architecture should be built, and what pitfalls will you encounter?
At Odnoklassniki, we decided to use Elasticsearch to tackle log management issues, and now we share our experience with Habr: both about architecture and pitfalls.
I am Pyotr Zaytsev, a system administrator at Odnoklassniki. Previously, I was also an admin, working with Manticore Search, Sphinx Search, and Elasticsearch. If there happens to be another search... I will likely work with it as well. I also participate in several open-source projects on a voluntary basis.
When I joined Odnoklassniki, I foolishly claimed in the interview that I could work with Elasticsearch. After I got accustomed and handled a few simple tasks, I was given a large assignment to reform the existing log management system at that time.
Requirements
The system requirements were formulated as follows:
- Graylog was to be used as the frontend. This is because the company already had experience with this product; the programmers and testers knew it, found it familiar and convenient.
- Data volume: on average 50-80 thousand messages per second, but if something breaks, the traffic is unlimited, which can reach 2-3 million lines per second.
- After discussing the requirements for the speed of processing search queries with the clients, we understood that the typical pattern of using such a system was as follows: people search logs of their application for the last two days and do not want to wait more than a second for the results of their query.
- Admins insisted that the system should easily scale as needed, without requiring them to deeply understand how it is structured.
- So the only maintenance task that these systems required periodically was to replace some hardware.
- Additionally, Odnoklassniki has a wonderful technical tradition: any service we launch must withstand a data center failure (sudden, unplanned, and at any time).
The final requirement in implementing this project was the most challenging for us, which I will elaborate on further.
Environment
We operate in four data centers, but the Elasticsearch data nodes can only be located in three (for several non-technical reasons).
These four data centers house approximately 18,000 different log sources — hardware, containers, virtual machines.
An important feature: the cluster runs in containers not on physical machines, but on . Containers are guaranteed 2 cores, equivalent to 2.0GHz v4, with the ability to utilize additional cores when they are idle.
In other words:

Topology
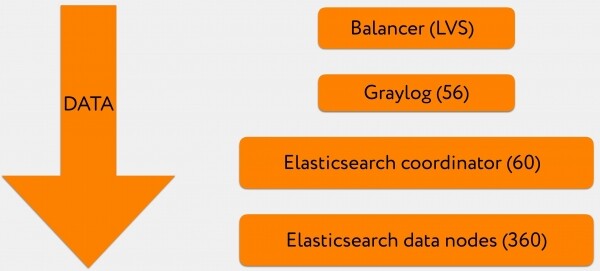
The overall structure of the solution initially appeared to me as follows:
- 3-4 VIPs stand behind the A record of the Graylog domain, which is the address to which logs are sent.
- Each VIP represents an LVS load balancer.
- After that, the logs go to a battery of Graylog, part of the data is in GELF format, and part in syslog format.
- Next, all this is written in large batches to a battery of Elasticsearch coordinators.
- They, in turn, send write and read requests to the relevant data nodes.
Terminology
Not everyone may be familiar with the terminology, so I would like to pause to explain it a bit.
In Elasticsearch, there are several types of nodes — master, coordinator, data node. There are also two other types for different transformations of logs and the connection of different clusters, but we used only the ones listed.
Master
Pings all nodes present in the cluster, maintains an up-to-date map of the cluster and disseminates it among the nodes, processes event logic, and handles various cluster-wide housekeeping tasks.
Coordinator
Performs a single task: accepts read or write requests from clients and routes that traffic. If it's a write request, it will most likely ask the master which shard of the relevant index to place it in, and then forward the request.
Data node
Stores data, executes incoming search queries, and performs operations on the shards located on it.
Graylog
This is somewhat like a combination of Kibana and Logstash in the ELK stack. Graylog merges both a UI and a log processing pipeline. Under the hood, Graylog operates with Kafka and Zookeeper, which provide connectivity for Graylog as a cluster. Graylog can cache logs (Kafka) in case Elasticsearch is unavailable and retry failed read and write requests, grouping and tagging logs according to specified rules. Like Logstash, Graylog has the functionality to modify strings before writing them to Elasticsearch.
Additionally, Graylog has a built-in service discovery that allows you to obtain the entire cluster map based on a single available Elasticsearch node and filter it by a specific tag, enabling the directing of requests to certain containers.
Visually, it looks something like this:

This is a screenshot from a specific instance. Here, we build a histogram based on the search query, displaying relevant lines.
Indexes
Returning to the system architecture, I would like to elaborate on how we built the index model to ensure everything works correctly.
In the previously provided diagram, this is the lowest level: Elasticsearch data nodes.
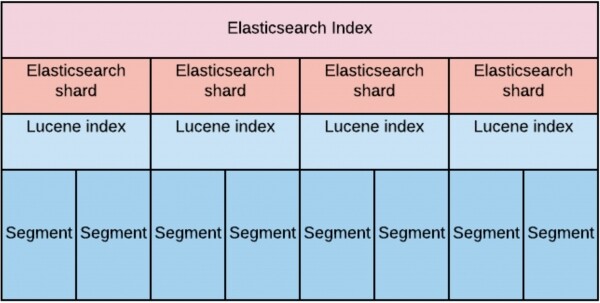
An index is a large virtual entity consisting of Elasticsearch shards. Each shard is nothing more than a Lucene index. Each Lucene index, in turn, consists of one or more segments.
During the design phase, we estimated that to meet the reading speed requirement with a large volume of data, we needed to evenly "spread" this data across the data nodes.
This resulted in the requirement that the number of shards per index (including replicas) must strictly equal the number of data nodes. First, to ensure a replication factor of two (meaning we can lose half the cluster). Secondly, to handle read and write requests on at least half of the cluster.
We initially defined the retention time as 30 days.
The distribution of shards can be graphically represented as follows:
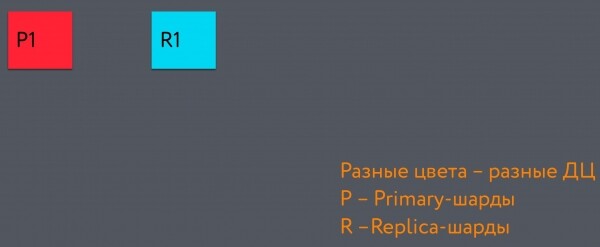
The entire dark gray rectangle represents the index. The left red square within it is the primary shard, the first in the index. The blue square is the replica shard. They are located in different data centers.
When we add another shard, it goes to the third data center. Ultimately, we achieve a structure that allows for the loss of a data center without sacrificing data consistency.

We set the index rotation, i.e., the creation of a new index and deletion of the oldest one, to 48 hours (based on the index usage pattern: the last 48 hours are searched most frequently).
This index rotation interval is related to the following reasons:
When a search request hits a specific data node, it is more advantageous performance-wise to query a single shard if its size is comparable to the node's heap size. This allows us to keep the 'hot' part of the index in the heap for quick access. When there are many 'hot parts', the search speed across the index degrades.
When a node starts processing a search request on a shard, it allocates a number of threads equal to the number of hyper-threading cores of the physical machine. If the search request affects a large number of shards, the number of threads increases proportionally. This negatively impacts search speed and adversely affects the indexing of new data.
To ensure the required search latency, we decided to use SSDs. For fast query processing, the machines hosting these containers needed to have at least 56 cores. The figure of 56 was chosen as a conditionally sufficient amount to determine the number of threads that Elasticsearch would generate during operation. In Elasticsearch, many thread pool parameters depend directly on the number of available cores, which in turn directly affects the required number of nodes in the cluster based on the principle of 'fewer cores - more nodes'.
As a result, we found that on average, a shard weighs about 20 gigabytes, with 360 shards per index. Accordingly, if we rotate them once every 48 hours, we have 15 of them. Each index contains data for 2 days.
Data Writing and Reading Schemas
Let's explore how data is written in this system.
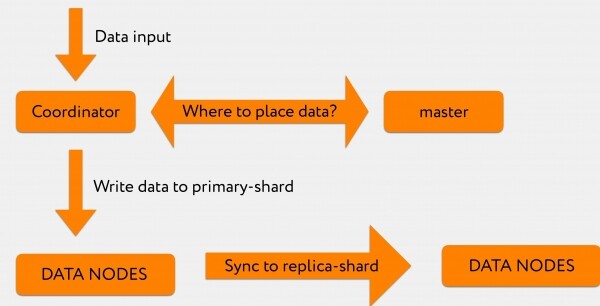
Suppose we receive a request from Graylog to the coordinator. For example, we want to index 2-3 thousand rows.
The coordinator, upon receiving a request from Graylog, queries the master: "The indexing request specifically stated the index, but it did not specify which shard to write to."
The master responds: "Write this information to shard number 71," after which it is sent directly to the relevant data node, where primary shard number 71 is located.
Subsequently, the transaction log is replicated to the replica shard, which is located in a different data center.
A search query comes from Graylog to the coordinator. The coordinator redirects it based on the index, while Elasticsearch distributes queries between the primary shard and the replica shard on a round-robin basis.
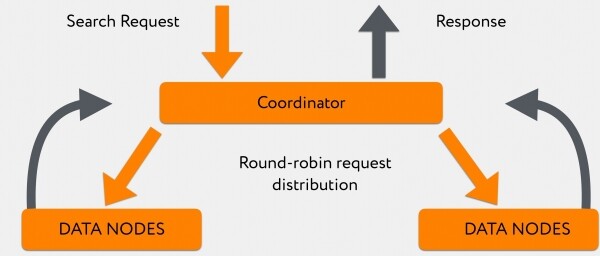
The 180 nodes respond unevenly, and while they respond, the coordinator accumulates information that has already been "spat out" by faster data nodes. After that, when either all information has arrived or the timeout for the request is reached, it sends everything directly to the client.
On average, this system processes search queries for the last 48 hours in 300-400ms, excluding those queries that have a leading wildcard.
"Little Flowers" with Elasticsearch: Java Configuration

To ensure everything worked as we initially wanted, we spent a long time fine-tuning various things in the cluster.
The first set of issues discovered was related to how Java is configured by default in Elasticsearch.
Problem One
We observed a very large number of messages indicating that, at the Lucene level, when background jobs are running, the merging of Lucene segments fails with an error. The logs showed that this was an OutOfMemoryError. Telemetry indicated that the heap was free, and it was unclear why this operation was failing.
It turned out that the merges of Lucene indexes occur outside the heap. And the containers are quite strictly limited in resource consumption. Only the heap could fit into the resources (the heap.size value was approximately equal to the RAM), while some off-heap operations failed with allocation errors if, for some reason, they did not fit within the ~500MB remaining until the limit.
The fix was quite trivial: we increased the available RAM for the container, after which we forgot that we ever had such problems.
Problem Two
About 4-5 days after launching the cluster, we noticed that the data nodes began to periodically drop out of the cluster and rejoin it after about 10-20 seconds.
When we began to investigate, it turned out that the off-heap memory in Elasticsearch is virtually uncontrolled. When we assigned more memory to the container, we gained the ability to fill direct buffer pools with various information, and it was cleared only after an explicit GC was triggered by Elasticsearch.
In some cases, this operation took quite a long time, and during that time, the cluster marked this node as already having gone down. This issue is well documented .
The solution was as follows: we limited Java's ability to use most of the memory outside the heap for these operations. We set a limit of 16 gigabytes (-XX:MaxDirectMemorySize=16g), which led to explicit GC being invoked much more frequently and executing significantly faster, thus stabilizing the cluster.
The third problem
If you think that the issues with 'nodes leaving the cluster at the most unexpected moments' ended here, you are mistaken.
When we configured the work with indices, we chose mmapfs to on fresh shards with high segmentation. This was quite a major mistake because when using mmapfs, the file is mapped into memory, and then we work with the mapped file. Because of this, when the GC tries to stop threads in the application, we take a very long time to reach the safepoint, and on the way there, the application stops responding to the master's requests about whether it is still alive. Consequently, the master considers that the node is no longer present in the cluster. After about 5-10 seconds, the garbage collector completes its work, the node revives, re-enters the cluster, and begins to initialize shards. All of this strongly resembled the 'production we deserved' and was not suitable for anything serious.
To eliminate such behavior, we first switched to standard niofs, and later, when we migrated from the fifth versions of Elastic to the sixth, we tried hybridfs, where this issue did not occur. You can read more about storage types .
The fourth problem
Then there was another very engaging problem that we tackled for an exceptionally long time. We pursued it for 2-3 months because its pattern was completely unclear.
Sometimes our coordinators would go into Full GC, usually after lunch, and wouldn't return from there. When logging the GC delays, it looked like this: everything was going well, well, well, and then suddenly — it all turned bad.
At first, we thought there was a malicious user who was triggering a query that knocked the coordinator out of operation. We logged requests for a long time trying to determine what was happening.
Eventually, it turned out that when a user sent a huge request that landed on a specific Elasticsearch coordinator, some nodes responded slower than others.
And during the time the coordinator waits for responses from all nodes, it accumulates the results from nodes that have already responded. For GC, this meant that our heap usage pattern changed rapidly. And the GC we were using couldn't handle this task.
The only fix we found to change the cluster's behavior in such situations was migrating to JDK13 and using the Shenandoah garbage collector. This solved the problem, and our coordinators stopped crashing.
With that, the problems with Java ended, and we started encountering issues with throughput.
"Berries" with Elasticsearch: Throughput

Throughput issues mean that our cluster operates steadily, but during peak document indexing and maneuver times, the performance is inadequate.
The first symptom encountered: during some "explosions" in production, when a very large amount of logs is generated suddenly, the es_rejected_execution indexing error frequently appears in Graylog.
This occurred because the thread_pool.write.queue on one data node, before Elasticsearch could process the indexing request and send information to the shard on disk, by default can cache only 200 requests. And in very little is said about this parameter. Only the maximum number of threads and the default size are mentioned.
Of course, we went to tweak this value and found the following: specifically in our setup, it caches quite well up to 300 requests, and a higher value risks sending us back into Full GC.
Additionally, since these are batches of messages arriving in a single request, it was also necessary to tweak Graylog so that it would not write too frequently and in small batches, but in large batches or once every 3 seconds if the batch is still not full. In this case, the information we write to Elasticsearch becomes available not in two seconds, but in five (which suits us just fine), but the number of retries required to push a large batch of information decreases.
This is especially important at times when something goes down somewhere and aggressively reports it, so as not to completely spam Elastic, and later find Graylog nodes non-functional due to filled buffers.
Moreover, when these very explosions occurred in production, we received complaints from developers and testers: at the moment when they really needed these logs, they were being delivered very slowly.
We began to investigate. On one hand, it was clear that both search queries and indexing requests were essentially processed on the same physical machines, and certain drops would occur one way or another.
However, this could be partially mitigated by the fact that the sixth versions of Elasticsearch introduced an algorithm that allows requests to be distributed among relevant data nodes not randomly through round-robin (a container that handles indexing and holds the primary shard can be very busy, making it unable to respond quickly), but by directing the request to a less loaded container with a replica shard, which would respond significantly faster. In other words, we adopted use_adaptive_replica_selection: true.
The reading pattern begins to look like this:
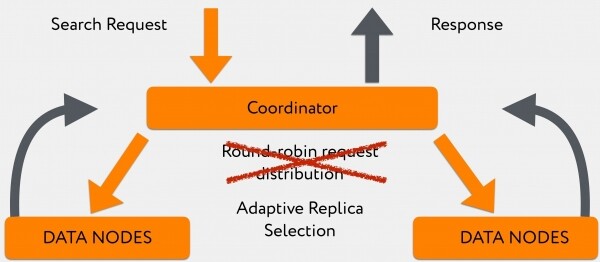
Switching to this algorithm significantly improved query time during periods of high log writing.
Finally, the main issue was the seamless removal of the data center.
What we wanted from the cluster immediately after losing contact with one data center:
- If the current master is in the downed data center, it will be re-elected and its role will move to another node in a different data center.
- The master will quickly remove all unavailable nodes from the cluster.
- Based on what remains, it will understand: in the lost data center we had such primary shards, quickly promoting complementary replica shards in the remaining data centers, and our data indexing will continue.
- As a result, we will experience a gradual degradation of the cluster's throughput for both writing and reading, but overall, everything will function, albeit slowly, yet stably.
As it turned out, we wanted something like this:

But we got the following:

How did this happen?
At the moment the data center went down, our bottleneck became the master.
Why?
The thing is that the master has a TaskBatcher responsible for distributing certain tasks and events within the cluster. Any node outage, any promotion of a shard from replica to primary, any task to create some shard somewhere — all of this first goes into the TaskBatcher, where it is processed sequentially and in a single thread.
At the moment when one data center went down, all the data nodes in the surviving data centers felt it was their duty to report to the master, "we have lost such shards and such data nodes."
Meanwhile, the surviving data nodes were sending all this information to the current master and were trying to wait for confirmation that he received it. They did not wait for this, as the master received tasks faster than he could respond. Nodes repeated requests on timeout, and the master at that time was not even trying to respond to them, being completely absorbed by the task of sorting requests by priority.
In terminal form, it turned out that the data nodes spammed the master to the point that he went into full GC. After this, our role of master would move to some next node, experiencing absolutely the same thing, and ultimately, the cluster would completely fall apart.
We conducted measurements, and up until version 6.4.0, where this was fixed, it was enough for us to bring down just 10 data nodes out of 360 simultaneously to completely crash the cluster.
It looked something like this:

After version 6.4.0, where this troubling bug was fixed, data nodes stopped killing the master. However, it didn't become "smarter" from that. Specifically: when we bring down 2, 3, or 10 (any number other than one) data nodes, the master receives some first message indicating that node A has gone down, and tries to inform node B, node C, node D about this.
Currently, the only way to address this is by setting a timeout for attempts to communicate something to someone, lasting around 20-30 seconds, thus controlling the speed at which the data center is removed from the cluster.
In general, this aligns with the initial requirements set for the final product in the project, but from the standpoint of 'pure science,' this is a bug. By the way, it was successfully fixed by the developers in version 7.2.
Moreover, when a certain data node went down, it turned out that disseminating information about its failure was more important than informing the entire cluster that specific primary shards were located on it (to promote a replica shard in another data center to primary, allowing data writes).
Therefore, once everything has 'settled down,' the failed data nodes are not immediately marked as stale. Consequently, we must wait for all pings to the failed data nodes to timeout, and only after that does our cluster start broadcasting that information needs to continue being written at certain locations. You can read more about this. .
Ultimately, the operation of removing the data center currently takes about 5 minutes during peak hours. For such a large and cumbersome system, this is quite a good result.
As a result, we arrived at the following solution:
- We have 360 data nodes with disks of 700 gigabytes.
- 60 coordinators for routing traffic across those data nodes.
- 40 masters that we retained as a legacy from versions prior to 6.4.0 — to survive the removal of the data center, we were mentally prepared to lose a few machines to ensure we would have a quorum of masters even in the worst-case scenario.
- Any attempts to combine roles on a single container ran into issues where sooner or later the node would fail under load.
- The entire cluster uses a heap size of 31 gigabytes: all attempts to reduce the size led to either some nodes failing under heavy search queries with leading wildcards or the circuit breaker in Elasticsearch being tripped.
- Additionally, to maintain search performance, we tried to keep the number of objects in the cluster as low as possible to process as few events as possible at the bottleneck that we encountered in the master.
Lastly, regarding monitoring.
To ensure everything works as intended, we monitor the following:
- Each data node reports to our cloud that it exists and has certain shards. When we shut down something somewhere, the cluster reports within 2-3 seconds that in center A we have shut down nodes 2, 3, and 4 — this means that in other data centers, we cannot shut down those nodes where shards remain unique.
- Knowing the master's behavior, we closely monitor the number of pending tasks. Because even one stalled task, if not timed out timely, can theoretically become the reason we do not manage, for example, to promote a replica shard to primary, which would halt indexing.
- We also pay close attention to garbage collector delays, as we have faced significant difficulties with this during optimization.
- Rejects by threads to understand in advance where the "bottleneck" is.
- And the standard metrics, like heap, RAM, and I/O.
When building monitoring, it is essential to account for the characteristics of the Thread Pool in Elasticsearch. describes the settings capabilities and default values for search and indexing, but completely omits thread_pool.management. These threads handle, in particular, requests like _cat/shards and other similar ones, which are convenient for monitoring implementation. The larger the cluster, the more such requests are executed per unit of time, and the aforementioned thread_pool.management is not only absent from the official documentation but is also limited by default to 5 threads, which gets consumed very quickly, after which monitoring stops functioning correctly.
In conclusion, I want to say: we did it! We managed to provide our programmers and developers with a tool that can quickly and reliably deliver information about what is happening in production in almost any situation.
Yes, it turned out to be quite complicated, but nonetheless, we were able to fit our requirements into existing products without having to patch and rewrite them.

Source: habr.com
