

Hello everyone!
My name is Masha, and I work as a quality assurance engineer at Tinkoff Group. The QA role requires extensive communication with various people from different teams, and I have also been a manager and lecturer for educational programs, which broadened my communication map significantly. At one point, I hit a breaking point: I realized I could no longer fill out endless amounts of unreadable tables and documents.

I'm sure each of you can now picture what I'm talking about, and you might even be sweating: lists of names without alphabetical order, tables with hundreds of columns and misaligned formatting, thousands of rows that require you to scroll with your finger on the mouse wheel just to see the header, tons of pages of unnumbered instructions, and hundreds of emails being shuffled around with data to analyze, systematize, and stuff back into unreadable tables.

So, when I calmed down a bit, I decided to write this article. I will talk about how to properly (and sometimes even conveniently) manage various non-product documentation. I hope this article gets shared widely online, reducing the level of chaos in departments adjacent to development just a bit, and that people (including myself) become a little happier.

Tools
Product documentation is often stored alongside the code, which is good. Non-product documentation, however, is usually scattered all over. People often try to transfer information from different locations into Confluence, and we are no exception. So here's my story about it.
Overall, Confluence is an advanced wiki engine. It allows you to work with data in various display formats: formatted text, tables, diverse diagrams. It's a very interesting and powerful tool, but if you don't know how to prepare it properly, you'll end up with yet another heap of unreadable documents. I'll teach you how to get it ready!

Macros
Most of Confluence's magic is built on macros. There are a lot of macros, and they can be combined with each other. Some are paid, and some are free; I'll provide various examples of macros along with links to their documentation.
The interface for working with macros is as simple as possible. To add a macro, you just need to click on the plus sign and select the desired item from the list.
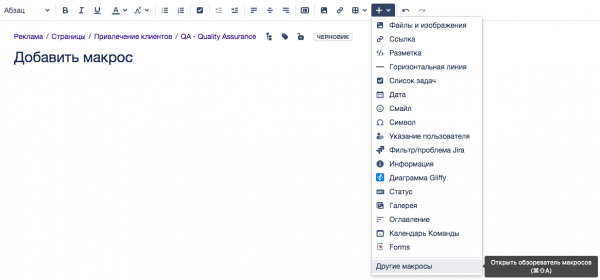
If the macro is self-sufficient, meaning it does not require anything else to be inserted inside it, it looks like a block.

If the macro requires something to be placed inside, it resembles a frame.

You can place as many other elements inside a single frame as you want, as long as there is logic to your pyramid.
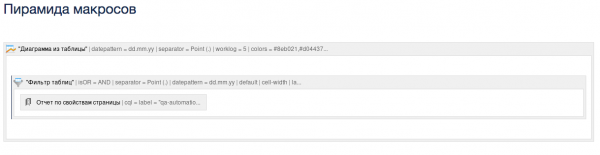
Each macro has a preview: it immediately shows whether you have filled out and configured the macro correctly.
Templates
In addition to macros, there is a convenient content pre-filling tool — it's a template.
Templates can be used when creating any page: just click on the three dots next to the 'Create' button and select the desired template.
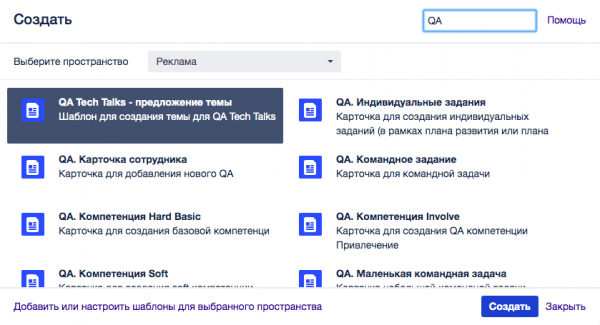
Then all the content from the template will be added to the created page.
Anyone can create pages from templates, but only those with permissions can create or edit the templates themselves. Additional instructions on how to manage the page can be added to the template.

The Magic of Tables
As a techie, I naturally love tables and can wrap almost any information in them (even if it's not always effective). Tables, in and of themselves, are clear, structured, scalable, and magical!

But even such a wonderful entity as a table can be ruined. However, it can also be used successfully and even improved. More on that below.
Filtering (paid plugin)
Any large unreadable table can be made somewhat less enormous and a bit more readable through filtering. For this, a paid macro can be used. .
You need to insert the entire table into this macro (even the ugliest one, as long as you fit it all in). You can select columns for filtering with a dropdown list, a text filter, numeric filters, and date filters within the macro.
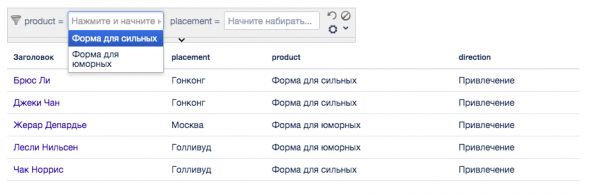
Imagine that all the information about candidates for all positions is recorded in a tabular list. Naturally, it is unsorted — people don’t come for interviews in alphabetical order. And you need to determine whether you have interviewed a specific candidate before. You just need to stuff this chaos into the filter macro, add a text filter by last name — and voila, the information is at your screen.

It is worth noting that filtering large tables can affect system performance and page loading times, so putting a huge table into a filter is a temporary workaround. It's better to establish a process where people aren't forced to create huge, unreadable tables (an example of this process will be at the end of the article).
Sorting (paid plugin)
With the magical macro , you can also set a default sort by any column and number the rows. Or just click on any column of the table embedded in the filter macro, and it will sort by that column.
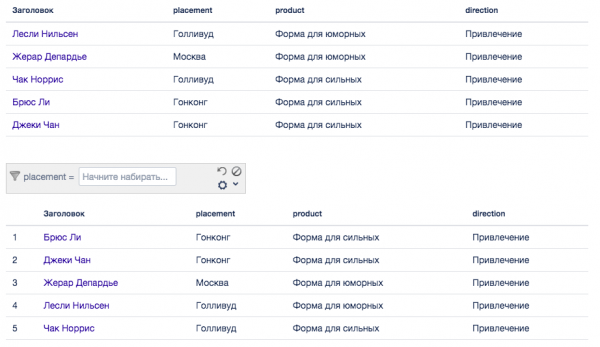
For example, if you have the same table with candidates and need to estimate how many interviews were conducted in a specific month, sort by date and enjoy.
Pivot tables (paid plugin)
Now let’s move on to a more interesting case. Imagine that your table is huge and you need to compute something from it. Of course, you could copy it to Excel, calculate what you need, and upload the data back to Confluence. But you could just apply the macro once and get the same result, but also keep it updated.
For example, you have a table that collects data on all employees—where they are located and what positions they hold. To count how many people are in each city, you need to select in the “Pivot Table” macro the row by which the data is aggregated (location) and the operation type (summation).
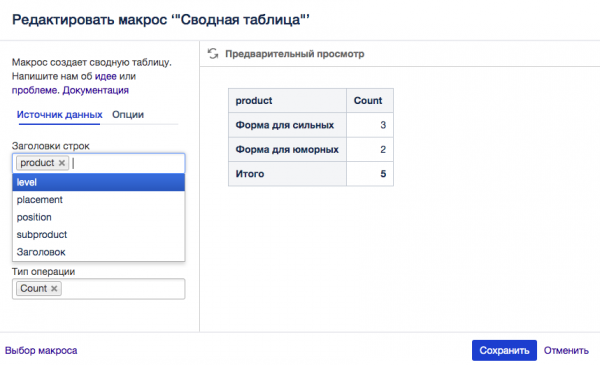
Naturally, you can group by several criteria at once; all the options can be viewed .
Charts (paid plugin)
As I mentioned, not everyone loves tables as much as I do. Unfortunately, most managers don’t like them at all. However, everyone loves bright, colorful charts.
The creators of Confluence undoubtedly knew this (they most likely have bosses who love reports and charts, after all). So, you can use the magical macro . You need to insert the pivot table from the previous section into this macro, and voila—your gray, boring data is beautifully visualized.
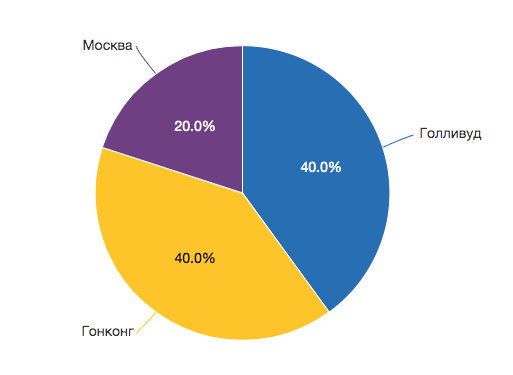
Of course, there are also settings in this macro. You can find the documentation link for any macro in the editing mode of that macro.
Ease of aggregation
The information from previous points was surely not a revelation for you. But now you definitely know how to use macros, and I can move on to a more interesting part of the article.

Tags
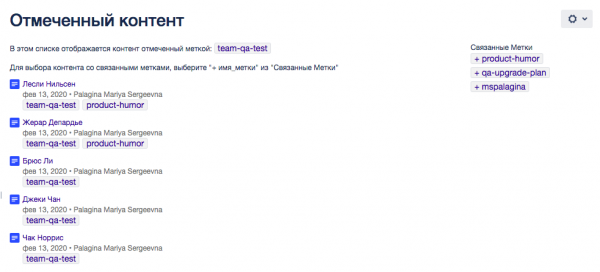
It’s problematic when people store information in a single unstructured article or a huge table. Even worse is when parts of this information are not only poorly formatted but also scattered across the vastness of Confluence. Fortunately, there is a way to gather all that scattered information in one place. For this, you need to use (familiar to everyone from social networks).

You can add any number of tags to any page. If you click on a tag, you will be taken to an aggregation page, which contains links to all materials with that tag, as well as a set of related tags. Related tags are those that frequently appear on the same page.
Page Properties
You can add another interesting macro for structuring information to the page — . You need to feed it a table of two columns; the first will be the key, and the second will be the value of the property. Moreover, the macro can be hidden from the page so that it doesn’t interfere with reading the content, but the page will still be marked with the necessary keys.
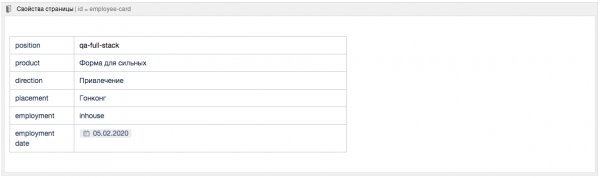
Note the ID — it is convenient to assign it so that different groups of properties can be attached to different pages (or even different property groups on the same page).
Reports
You can generate reports based on tags. For example, the macro collects all pages with a specific set of tags.
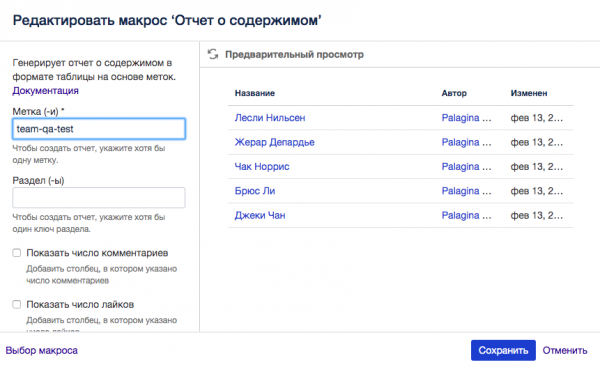
But a more interesting report is the macro . It also gathers all pages with a specific set of tags, but instead of simply listing them, it creates a table (catching the connection with the beginning of the article?), where the columns are the keys of the page properties.

It results in a summary table of information from various sources. It’s nice that it has convenient features: responsive layout, sorting by any column. This report table can also be configured within the macro.
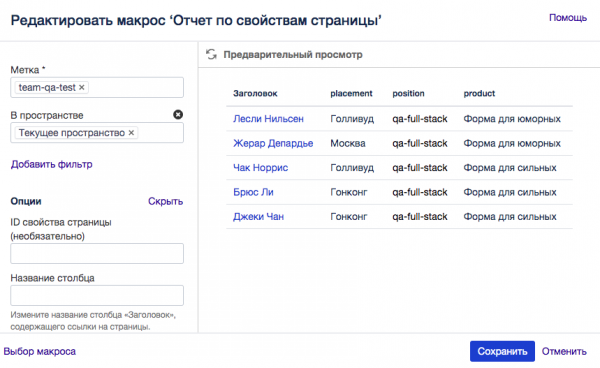
When configuring, you can remove certain columns from the report, set a default state, or specify the number of displayed records. You can also set the page property ID to see only the desired information.
For example, you have multiple employee pages, and each of these pages has a set of properties about the person: their level, where they are located, when they joined the team, and so on. These properties are marked. ID = employee_inf. And there is a second set of properties on the same page, which contains information about the person as part of the team: what role the person performs, which team they belong to, and so on. These properties are marked. ID = team_inf. Thus, when generating a report, you can display information by a single ID or at once for both—whichever is more convenient.
The beauty of this approach is that everyone can compile the information table they need, which will not duplicate anything and will be updated when the main page is updated. For instance: a team lead is not concerned with when their developers joined the company, but is interested in what role each of them plays in the team. The team lead will compile a report on the team. An accountant, on the other hand, does not care what roles are performed, but cares about the positions—so they will compile a report on the positions. Meanwhile, the source of information will not be duplicated or moved.
Final process
Instruction
So, we can beautifully structure and effectively aggregate information in Confluence using macros as an example. But ideally, we need to ensure that new information is immediately structured and fitting into all the already-used aggregation mechanisms.
Here, a combination of macros and templates will come to the rescue. To make people create new pages in the desired format, you can use the 'Create from template' macro. It adds a button to the page, which, when clicked, creates a new page from the template you need. This way, you ensure that people immediately work in the format you require.
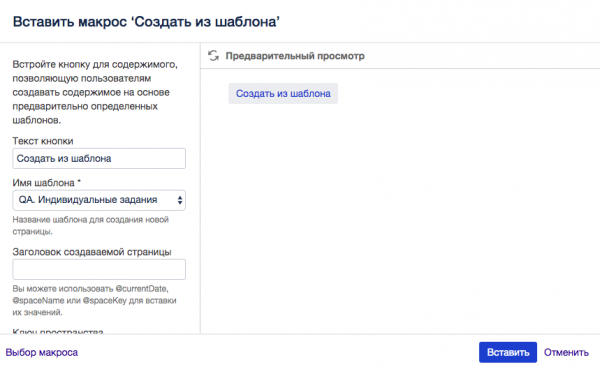
In the template from which you allow page creation, you should pre-add tags, the 'Page Properties' macro, and the table of required properties. I also recommend adding instructions on what values should fill the page, along with property values.
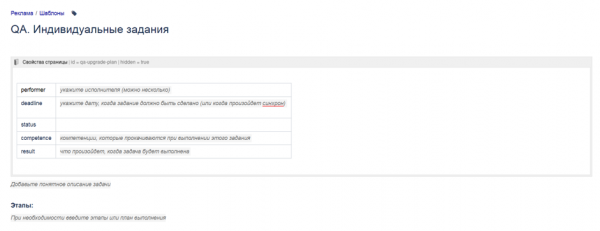
Then the final process will look like this:
- You create a template for a specific type of information.
- In this template, you add tags and page properties in the macro.
- Create a root page in any convenient location with a button that generates a child page from the template when clicked.
- Allow users on the root page who can potentially generate the needed information (using the specified template by clicking the button).
- Gather a report on the page properties through the tags you specified in the template.
- Rejoice: you have all the necessary information in a convenient format.

Pitfalls
As a quality engineer, I can confidently state that nothing in the world is perfect. Not even divine tables are flawless. And there are pitfalls in the above process.
- If you decide to change the names or composition of page properties, you will have to update all already created objects so that their data is correctly pulled into the summary report. This is unfortunate, but on the other hand, it forces you to think carefully about the 'architecture' of your information set, which is quite an interesting challenge.
- You will need to write a decent amount of instructions on how to fill out information tables and use tags. However, on the other hand, you can simply share this article with all the necessary people.
Example of storing non-product documentation
Through the process described above, you can organize the storage of almost any information. The beauty of this approach is its universality: once users get used to it, they stop generating clutter. Also, a significant (but not free) plus is the ability to collect various statistics on the fly and create beautiful charts from it.
Let me illustrate our process of managing team information.

For each person on the team, we decided to create an employee card. Accordingly, we have a template that each new person uses to create this card and maintain all personal information.
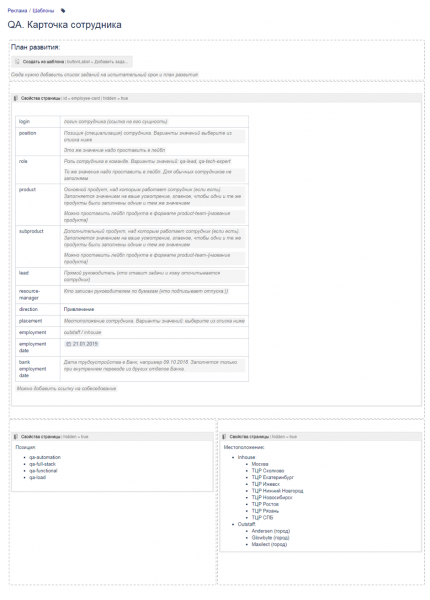
As you can see, we have a detailed table of properties and immediately have instructions on how to manage this page. Some tags are filled out by the employees following the instructions, while the main ones are in the template: the card tag employee-card, the direction tag direction-involve , and the team tag team-qa.
As a result, after everyone has created their profile, it forms a complete table with employee information. This information can be used in various contexts. Resource managers can create general tables for themselves, while team leaders can create team tables by adding their team's tag to the selection.
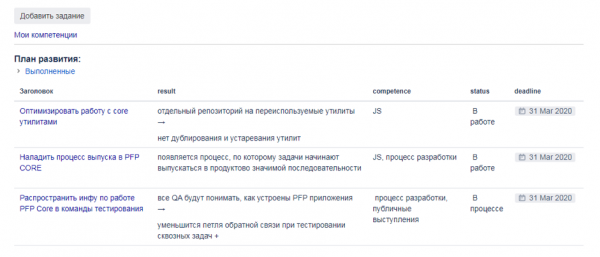
By tags, you can see different summaries, for example, on qa-upgrade-plan all tasks for the development of QA will be displayed. At the same time, each person maintains an important history and their development plan in their profile — creating a nested page from the development plan templates.
Conclusion
Keep any documentation in a way that you won’t be ashamed of it and users won’t be in painful suffering!
I really hope this article will be helpful and that order will come to all the documentation in the world.

Source: habr.com
