

Note: translation.: This instructive story from Omio, a European travel aggregator, takes readers from basic theory to fascinating practical nuances in Kubernetes configuration. Familiarity with such cases helps not only broaden horizons but also prevent non-trivial issues.
Have you ever encountered a situation where an application gets stuck, stops responding to health check requests, and you couldn’t understand the cause of such behavior? One possible explanation is related to CPU resource quota limits. This is what this article will discuss.
TL;DR:
We strongly recommend avoiding CPU limits in Kubernetes (or disabling CFS quotas in Kubelet) if you are using a Linux kernel version with a CFS quota bug. In the kernel there is a serious and bug that leads to excessive throttling and delays..
At Omio, the entire infrastructure is managed by Kubernetes.All our stateful and stateless workloads operate solely on Kubernetes (we use Google Kubernetes Engine). Over the past six months, we have observed random slowdowns. Applications freeze or stop responding to health checks, lose network connectivity, and so on. Such behavior left us puzzled for a long time, and finally, we decided to tackle the issue head-on.
Summary of the article:
- A few words about containers and Kubernetes;
- How CPU requests and limits are implemented;
- How CPU limits work in multi-core environments;
- How to monitor CPU throttling;
- Problem-solving and nuances.
A few words about containers and Kubernetes.
Kubernetes is essentially the modern standard in the infrastructure world. Its main task is container orchestration.
Containers
In the past, we needed to create artifacts like Java JARs/WARs, Python Eggs, or executable files for subsequent deployment on servers. However, to make them function, additional work had to be done: setting up the runtime environment (Java/Python), placing necessary files in the right locations, ensuring compatibility with a specific version of the operating system, etc. In other words, we had to pay close attention to configuration management (which often led to friction between developers and system administrators).
Containers changed everything. Now the artifact is a container image. It can be thought of as an extended executable file that contains not only the program but also a complete runtime environment (Java/Python/...), along with the necessary files/packages that are pre-installed and ready to run. Containers can be deployed and run on various servers without any additional actions.
Moreover, containers operate in their own sandboxed environment. They have their own virtual network adapter, their own filesystem with restricted access, their own process hierarchy, CPU and memory limits, etc. All of this is implemented through a special subsystem of the Linux kernel — namespaces.
Kubernetes
As mentioned earlier, Kubernetes is a container orchestrator. It works like this: you provide it with a pool of machines, and then you say, 'Hey, Kubernetes, run ten instances of my container with 2 CPUs and 3 GB of memory each, and keep them running!' Kubernetes will take care of everything else. It will find available resources, launch the containers, and restart them if necessary, roll out updates when versions change, and so on. Essentially, Kubernetes allows you to abstract away from the hardware component and makes diverse systems suitable for deploying and running applications.
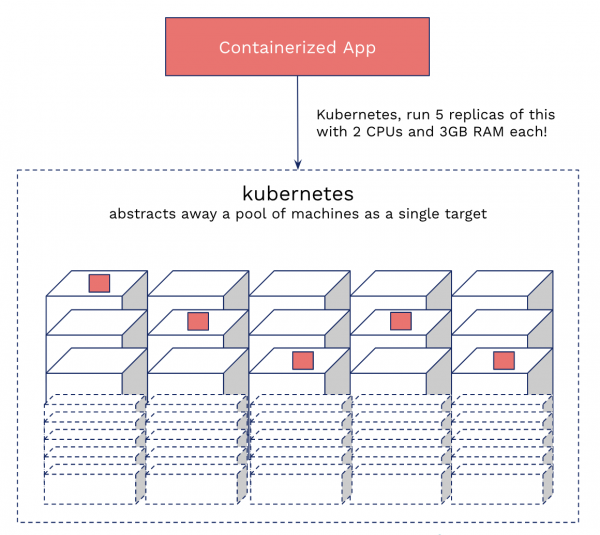
Kubernetes from the perspective of an average user
What are requests and limits in Kubernetes
Okay, we have understood containers and Kubernetes. We also know that several containers can be on one machine.
You can draw an analogy with a shared apartment. A spacious room (machines/nodes) is taken and rented out to several tenants (containers). Kubernetes acts as the realtor. The question arises: how do we keep tenants from conflicting with each other? What if one of them decides to occupy the bathroom for half a day?
This is where requests and limits come into play. CPU Request is needed solely for scheduling. It's somewhat like a 'wish list' for the container, used to match it with the most suitable node. Simultaneously, CPU Limit can be compared to a lease agreement — once we find a node for the container, it cannot exceed the established limits. And that’s where the problem arises...
How requests and limits are implemented in Kubernetes
Kubernetes uses a built-in kernel throttling mechanism to implement CPU limits. If an application exceeds the limit, throttling kicks in (i.e., it receives fewer CPU cycles). Memory requests and limits are organized differently, making them easier to detect. You just need to check the last restart status of the pod: is it 'OOMKilled'? CPU throttling is more complex since K8s only provides metrics related to usage, not cgroups.
CPU Request
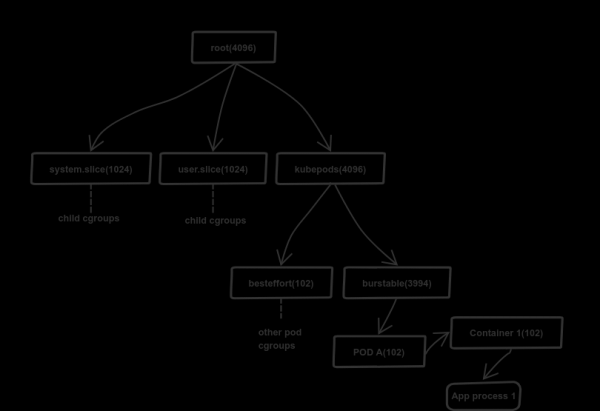
How CPU request is implemented
For simplicity, let's consider the process using a machine with a 4-core CPU as an example.
K8s uses control groups (cgroups) to manage the allocation of resources (memory and CPU). It has a hierarchical model: a child inherits limits from its parent group. The details of resource allocation are stored in a virtual file system (/sys/fs/cgroup). In the case of CPU, this is /sys/fs/cgroup/cpu,cpuacct/*.
K8s uses the file cpu.share to allocate CPU resources. In our case, the root control group receives 4096 CPU shares — 100% of the available CPU power (1 core = 1024; this is a fixed value). The root group distributes resources proportionally based on the shares of the child groups specified in cpu.share, and they, in turn, do the same with their children, and so on. In a typical Kubernetes node, the root control group has three children: system.slice, user.slice and kubepods. The first two subgroups are used to distribute resources among critical system workloads and user programs outside of K8s. The last one — kubepods — is created by Kubernetes to allocate resources among pods.
In the diagram above, it can be seen that the first and second subgroups received shares of 1024 , while the kubepod subgroup has been allocated 4096 shares. How is this possible: after all, the root group has only 4096 shares available, whereas the total shares of its children significantly exceed this number (6144)? The matter is that the value has logical meaning, so the Linux scheduler (CFS) uses it for proportional allocation of CPU resources. In our case, the first two groups get real shares of 680 (16.6% of 4096), while kubepod gets the remaining 2736 shares. In case of idle time, the first two groups will not use the allocated resources.
Fortunately, the scheduler has a mechanism that prevents the loss of unused CPU resources. It transfers "idle" power to a global pool from which it is distributed to groups that need additional CPU power (the transfer occurs in batches to avoid losses from rounding). A similar method is applied to all descendants.
This mechanism ensures fair distribution of CPU power and prevents any process from "stealing" resources from others.
CPU Limit
Despite the similar appearance of limit and request configurations in K8s, their implementation is fundamentally different: it is the most misleading and least documented part.
K8s employs to implement limits. Their settings are defined in the files cfs_period_us and cfs_quota_us in the cgroup directory (where the file is located as well). cpu.share).
Unlike cpu.share, the quota is based on time period, not on available CPU power. cfs_period_us defines the duration of the period (epoch) — it's always 100000 µs (100 ms). K8s has the option to change this value, but it is currently available only in alpha version. The scheduler uses the epoch to restart the consumed quotas. The second file, cfs_quota_us, defines the available time (quota) in each epoch. Note that it is also specified in microseconds. The quota can exceed the duration of the epoch; in other words, it can be greater than 100 ms.
Let's consider two scenarios on 16-core machines (the most common type of computers we have at Omio):
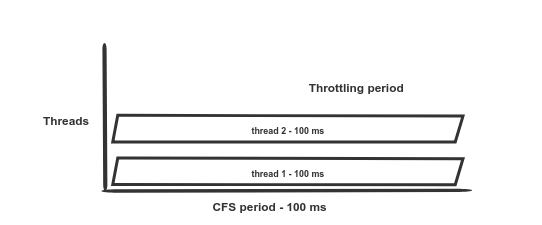
Scenario 1: 2 threads and a limit of 200 ms. Without throttling.
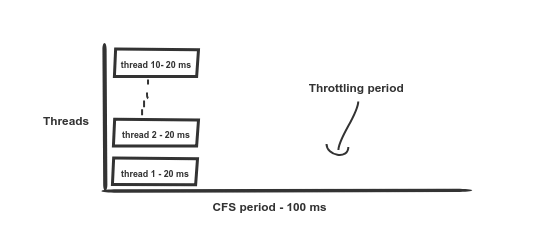
Scenario 2: 10 threads and a limit of 200 ms. Throttling begins after 20 ms; access to CPU resources resumes after another 80 ms.
Suppose you set the CPU limit to 2 cores; Kubernetes will convert this value to 200 ms. This means that the container can use a maximum of 200 ms of CPU time without throttling.
And here comes the interesting part. As stated above, the available quota is 200 ms. If you have, in parallel, ten threads running on a 12-core machine (see the illustration for scenario 2), while all other pods are idle, the quota will be exhausted in just 20 ms (since 10 * 20 ms = 200 ms), and all threads of this pod will "hang" (throttle) for the next 80 ms. The issue is exacerbated by the previously mentioned , which causes excessive throttling and the container can't even utilize its existing quota.
How to assess throttling in pods?
Simply enter the pod and execute cat /sys/fs/cgroup/cpu/cpu.stat.
-
nr_periods— total number of scheduler periods; -
nr_throttled— number of throttled periods included innr_periods; -
throttled_time— total throttled time in nanoseconds.
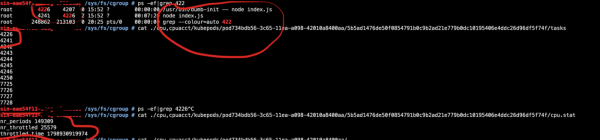
What is actually happening?
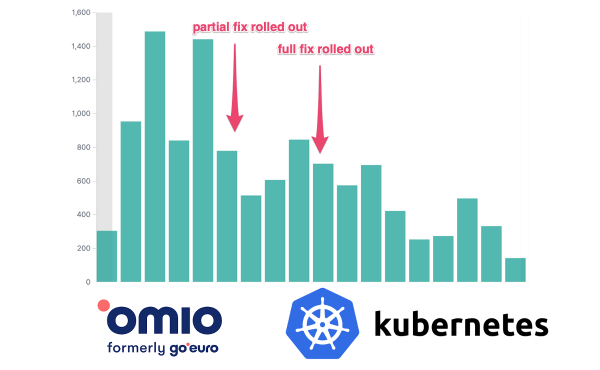
As a result, we experience high throttling across all applications. Sometimes it is one and a half times stronger than expected!
This leads to various errors — readiness check failures, container hangs, network connection drops, timeouts in service calls. Ultimately, this manifests as increased latency and a rise in error rates.
Solution and consequences
The solution is straightforward. We removed CPU limits and upgraded the operating system kernel in our clusters to the latest version where the bug was fixed. The number of errors (HTTP 5xx) in our services immediately dropped significantly:
HTTP 5xx errors
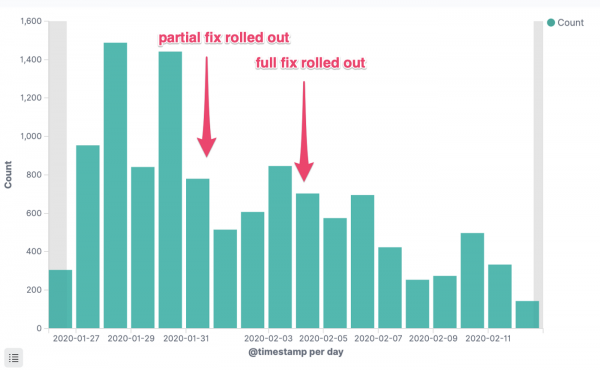
HTTP 5xx errors of a critical service
Response time p95
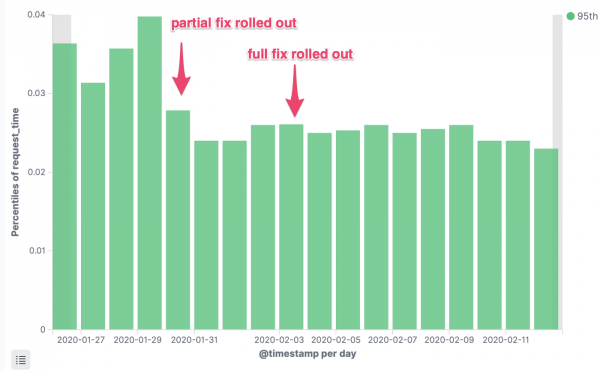
Latency of requests to a critical service, 95th percentile
Operating expenses
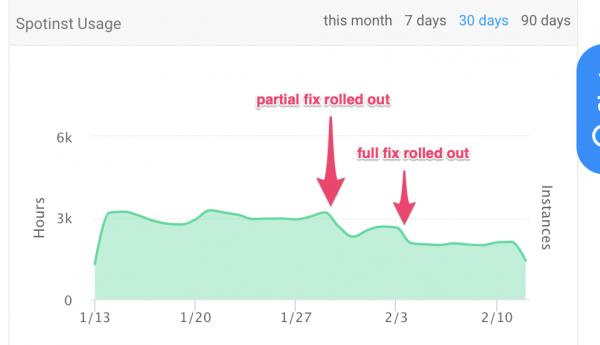
Number of consumed instance hours
What's the catch?
As mentioned at the beginning of the article:
One can draw an analogy with a shared apartment... Kubernetes acts as the realtor. But how do you keep tenants from conflicting with each other? What if one decides to hog the bathroom for half a day?
That's the catch. One negligent container can consume all available CPU resources on the machine. If you have a solid application stack (for example, properly configured JVMs, Go, Node VMs), then this is not an issue: you can operate under such conditions for a long time. But if the applications are poorly optimized or not optimized at all (FROM java:latest), the situation can spiral out of control. At Omio, we have automated base Dockerfiles with adequate default settings for the main programming stacks, so this problem did not exist.
We recommend monitoring metrics. (usage, saturation, and errors), API delays, and error occurrences. Ensure that the results meet expectations.
Links
This is our story. The following materials helped greatly in understanding what is happening:
- ;
- ;
- ;
- ;
- — look for 'cpu throttling'.
Kubernetes Error Reports:
- ;
- ;
- .
Have you encountered similar issues in your practice or have experience related to throttling in containerized production environments? Share your story in the comments!
P.S. from the translator
Also read in our blog:
- «»;
- «»;
- «».
Source: habr.com
