

These are exactly the complaints I heard from our developers. Interestingly, it turned out to be true, leading to a lengthy investigation. We are talking about SQL servers running on VMware.
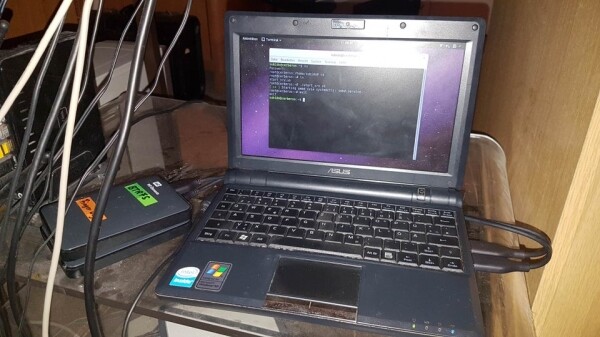
In fact, it's easy to make the production server hopelessly lag behind a laptop. Execute the following code (not on tempdb and not on a database with Delayed Durability):
set nocount on
create table _t (v varchar(100))
declare @n int=300000
while @n>0 begin
  insert into _t select 'What a slowpoke!'
  delete from _t
  set @n=@n-1
  end
GO
drop table _t
On my desktop, it runs in 5 seconds, while on the production server — it takes 28 seconds. This is because SQL needs to wait for the physical writing to the transaction log to finish, and we're dealing with very short transactions here. Essentially, we've put a huge powerful truck into city traffic, and we're watching as pizza delivery drivers on scooters effortlessly overtake it — throughput doesn't matter here, only latency does. And no network storage, regardless of how many zeros are in its price, can outperform local SSDs in terms of latency.
(In the comments, it turned out that I was mistaken — I have Delayed Durability present in both places. Without Delayed Durability, it results in:
Desktop — 39 seconds, 15K tr/sec, 0.065ms /io roundtrip
PROD — 360 seconds, 1600 tr/sec, 0.6ms
I should have noticed that it was too fast)
However, in this case, we are dealing with trivial zeros of the Riemann function with a trivial example. In the example brought to me by the developers, it was something different. I confirmed they were right, and started stripping out all their business logic specifics from the example. At some point, I realized I could completely discard their code and write my own — which demonstrates the same issue — it runs 3-4 times slower in production:
create function dbo.isPrime (@n bigint)
returns int
as
  begin
  if @n = 1 return 0
  if @n = 2 return 1
  if @n = 3 return 1
  if @n % 2 = 0 return 0
  declare @sq int
  set @sq = sqrt(@n)+1 -- check odds up to sqrt
  declare @dv int = 1
  while @dv < @sq
    begin
	set @dv=@dv+2
	if @n % @dv = 0 return 0
	end
  return 1
  end
GO
declare @dt datetime set @dt=getdate()
select dbo.isPrime(1000000000000037)
select datediff(ms,@dt,getdate()) as ms
GO
If everything is fine, the primality check will take 6-7-8 seconds. That's how it was on a number of servers. But interestingly, on some checks took 25-40 seconds. Curiously, there were no servers where the execution took, say, 14 seconds — the code either ran very quickly or very slowly, meaning the problem was, let's say, black and white.
What did I do? I dove into the VMware metrics. Everything looked fine there—resources were abundant, Ready time = 0, everything was sufficient; during testing, CPU=100 on a single vCPU on both fast and slow servers. I ran a test calculating Pi—the results were the same on all servers. It increasingly smelled like black magic.
Once I accessed the DEV farm, I began experimenting with the servers. It turned out that vMotion from host to host could 'heal' a server but could also, conversely, turn a 'fast' server into a 'slow' one. It seemed like there were some hosts with an issue... but… no. A certain virtual machine was slow on host A but worked quickly on host B. Conversely, another virtual machine was fast on A and slow on B! Both 'fast' and 'slow' machines often ran on the host!
At this point, the air clearly smelled of sulfur. The problem couldn’t be attributed to the virtual machine (like Windows patches, for example)—it turned 'fast' during vMotion. But the issue also couldn't be blamed on the host—since it had both 'fast' and 'slow' machines. Furthermore, it wasn't related to load—I managed to get a 'slow' machine on a host that had nothing else on it.
Out of desperation, I launched Process Explorer from Sysinternals and checked the SQL stack. On the slow machines, one line immediately caught my eye:
ntoskrnl.exe!KeSynchronizeExecution+0x5bf6
ntoskrnl.exe!KeWaitForMultipleObjects+0x109d
ntoskrnl.exe!KeWaitForMultipleObjects+0xb3f
ntoskrnl.exe!KeWaitForSingleObject+0x377
ntoskrnl.exe!KeQuerySystemTimePrecise+0x881 < — !!!
ntoskrnl.exe!ObDereferenceObjectDeferDelete+0x28a
ntoskrnl.exe!KeSynchronizeExecution+0x2de2
sqllang.dll!CDiagThreadSafe::PxlvlReplace+0x1a20
… skipped
sqldk.dll!SystemThread::MakeMiniSOSThread+0xa54
KERNEL32.DLL!BaseThreadInitThunk+0x14
ntdll.dll!RtlUserThreadStart+0x21
This was already something. A program was written:
    class Program
    {
        [DllImport("kernel32.dll")]
        static extern void GetSystemTimePreciseAsFileTime(out FILE_TIME lpSystemTimeAsFileTime);

        [StructLayout(LayoutKind.Sequential)]
        struct FILE_TIME
        {
            public int ftTimeLow;
            public int ftTimeHigh;
        }

        static void Main(string[] args)
        {
            for (int i = 0; i < 16; i++)
            {
                int counter = 0;

                var stopwatch = Stopwatch.StartNew();

                while (stopwatch.ElapsedMilliseconds  0)
                {
                    Console.WriteLine("{0}", counter);
                }
            }
        }
    }
This program demonstrated an even more pronounced slowdown — on the "fast" machines it shows 16-18 million cycles per second, while on the slow ones — one and a half million, or even 700 thousand. So the difference is 10-20 times (!!!). This was already a small victory: at least, there was no threat of getting stuck between Microsoft and VMware support with them shifting blame onto each other.
Then the progress stalled — vacation, important matters, viral hysteria, and a sudden increase in workload. I often mentioned the magical problem to my colleagues, but at times it seemed they didn't always believe me — the claim that VMware slows down code by 10-20 times was just too monstrous.
I tried to dig into what was causing the slowdown. At times I felt I had found a solution — toggling Hot plugs, changing the memory allocation or number of processors often turned the machine into a "fast" one. But not permanently. However, what turned out to be true is that just going out and tapping the wheel — meaning changing any parameter of the virtual machine
Finally, my American colleagues suddenly found the root cause.
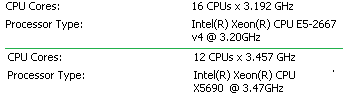
The hosts differed in frequency!
- Generally, this is not critical. But: when moving from a 'native' host to a host with a 'different' frequency, VMware must adjust the result of GetTimePrecise.
- Generally this is not critical, unless there is an application that requests the exact time millions of times per second, like SQL server.
- But even this is not critical, as SQL server doesn’t do this all the time (see Conclusion)
But there are cases when these pitfalls hit hard. And indeed, tapping the wheel (changing something in the VM settings) made me force VMware to 'recalculate' the configuration, and the frequency of the current host became the 'native' frequency of the machine.
Solution
When you disable virtualization of the TSC, reading the TSC from within the virtual machine returns the physical machine’s TSC value, and writing the TSC from within the virtual machine has no effect. Migrating the virtual machine to another host, resuming it from a suspended state, or reverting to a snapshot causes the TSC to jump discontinuously. Some guest operating systems fail to boot or exhibit other timekeeping problems when TSC virtualization is disabled. In the past, this feature has sometimes been recommended to improve performance of applications that read the TSC frequently, but performance of the virtual TSC has been improved substantially in current products. The feature has also been recommended for use when performing measurements that require a precise source of real time in the virtual machine.
In short, you need to add the parameter
monitor_control.virtual_rdtsc = FALSE
Conclusion
You may be wondering: why call GetTimePrecise so often in SQL?
I don’t have the source code for SQL Server, but logically, SQL functions almost like an operating system with cooperative concurrency, where each thread must periodically 'yield'. And where is this best done? Where there's a natural wait — lock or IO. Well, what if we're looping through compute cycles? Then the obvious and almost only place is in the interpreter (though it's not exactly an interpreter) after executing the next statement.
Generally, SQL Server isn't designed for pure computational tasks, and that's not a problem. However, loops working with various temporary tables (which get cached immediately) turn the code into a series of very quickly executed statements.
By the way, if you wrap a function in NATIVELY COMPILED, it stops requesting time, and its speed increases by about 10 times. What about cooperative multitasking? Well, for natively compiled code, SQL had to implement PREEMPTIVE MULTITASKING.
Source: habr.com
