

Hello everyone. In May, OTUS is launching , for both infrastructure and applications using Zabbix, Prometheus, Grafana, and ELK. Accordingly, we traditionally share useful materials on the subject.
for Prometheus allows monitoring of external services over HTTP, HTTPS, DNS, TCP, and ICMP. In this article, I will show you how to set up HTTP/HTTPS monitoring using the Blackbox exporter. We will run the Blackbox exporter in Kubernetes.
Environment
We will need the following:
- Kubernetes
- Prometheus Operator
Blackbox exporter configuration
We configure the Blackbox through ConfigMap to set up the HTTP web service monitoring module.
apiVersion: v1
kind: ConfigMap
metadata:
  name: prometheus-blackbox-exporter
  labels:
    app: prometheus-blackbox-exporter
data:
  blackbox.yaml: |
    modules:
      http_2xx:
        http:
          no_follow_redirects: false
          preferred_ip_protocol: ip4
          valid_http_versions:
          - HTTP/1.1
          - HTTP/2
          valid_status_codes: []
        prober: http
        timeout: 5s
Module http_2xx is used to check that the web service returns an HTTP status code of 2xx. More about the Blackbox exporter configuration is described in .
Deploying the Blackbox exporter in the Kubernetes cluster
Describe Deployment and Service for deployment in Kubernetes.
---
kind: Service
apiVersion: v1
metadata:
  name: prometheus-blackbox-exporter
  labels:
    app: prometheus-blackbox-exporter
spec:
  type: ClusterIP
  ports:
    - name: http
      port: 9115
      protocol: TCP
  selector:
    app: prometheus-blackbox-exporter

---
apiVersion: apps/v1
kind: Deployment
metadata:
  name: prometheus-blackbox-exporter
  labels:
    app: prometheus-blackbox-exporter
spec:
  replicas: 1
  selector:
    matchLabels:
      app: prometheus-blackbox-exporter
  template:
    metadata:
      labels:
        app: prometheus-blackbox-exporter
    spec:
      restartPolicy: Always
      containers:
        - name: blackbox-exporter
          image: "prom/blackbox-exporter:v0.15.1"
          imagePullPolicy: IfNotPresent
          securityContext:
            readOnlyRootFilesystem: true
            runAsNonRoot: true
            runAsUser: 1000
          args:
            - "--config.file=/config/blackbox.yaml"
          resources:
            {}
          ports:
            - containerPort: 9115
              name: http
          livenessProbe:
            httpGet:
              path: /health
              port: http
          readinessProbe:
            httpGet:
              path: /health
              port: http
          volumeMounts:
            - mountPath: /config
              name: config
        - name: configmap-reload
          image: "jimmidyson/configmap-reload:v0.2.2"
          imagePullPolicy: "IfNotPresent"
          securityContext:
            runAsNonRoot: true
            runAsUser: 65534
          args:
            - --volume-dir=/etc/config
            - --webhook-url=http://localhost:9115/-/reload
          resources:
            {}
          volumeMounts:
            - mountPath: /etc/config
              name: config
              readOnly: true
      volumes:
        - name: config
          configMap:
            name: prometheus-blackbox-exporter
The Blackbox exporter can be deployed using the following command. Namespace monitoring refers to Prometheus Operator.
kubectl --namespace=monitoring apply -f blackbox-exporter.yamlEnsure all services are running by using the following command:
kubectl --namespace=monitoring get all --selector=app=prometheus-blackbox-exporterBlackbox Check
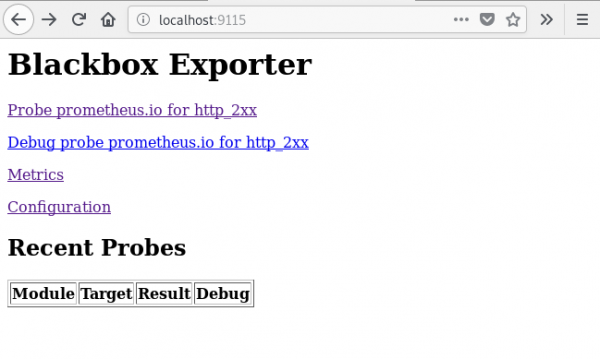
You can access the web interface of the Blackbox exporter via port-forward:
kubectl --namespace=monitoring port-forward svc/prometheus-blackbox-exporter 9115:9115Connect to the Blackbox exporter web interface through your web browser at :9115.
If you navigate to , you will see the results of checking the specified URL ().
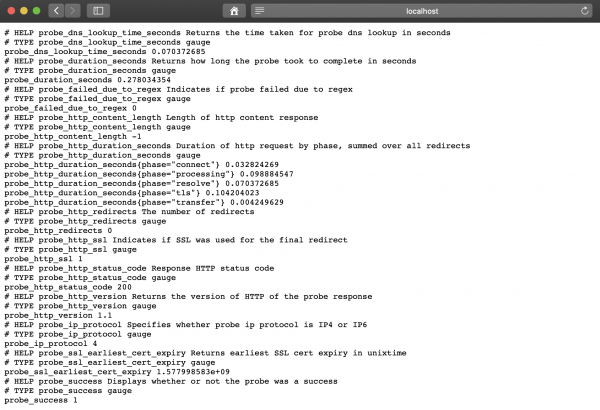
Metric Value probe_success equal to 1 indicates a successful check. A value of 0 indicates an error.
Configuring Prometheus
After deploying the BlackBox exporter, configure Prometheus in prometheus-additional.yaml.
- job_name: 'kube-api-blackbox'
  scrape_interval: 1w
  metrics_path: /probe
  params:
    module: [http_2xx]
  static_configs:
   - targets:
      - https://www.google.com
      - http://www.example.com
      - https://prometheus.io
  relabel_configs:
   - source_labels: [__address__]
     target_label: __param_target
   - source_labels: [__param_target]
     target_label: instance
   - target_label: __address__
     replacement: prometheus-blackbox-exporter:9115 # The blackbox exporter.
Generating Secret, using the following command.
PROMETHEUS_ADD_CONFIG=$(cat prometheus-additional.yaml | base64)
cat << EOF | kubectl --namespace=monitoring apply -f -
apiVersion: v1
kind: Secret
metadata:
  name: additional-scrape-configs
type: Opaque
data:
  prometheus-additional.yaml: $PROMETHEUS_ADD_CONFIG
EOF
Specify additional-scrape-configs for Prometheus Operator, using additionalScrapeConfigs.
kubectl --namespace=monitoring edit prometheuses k8s
...
spec:
  additionalScrapeConfigs:
    key: prometheus-additional.yaml
    name: additional-scrape-configs
Access the Prometheus web interface, check metrics and targets.
kubectl --namespace=monitoring port-forward svc/prometheus-k8s 9090:9090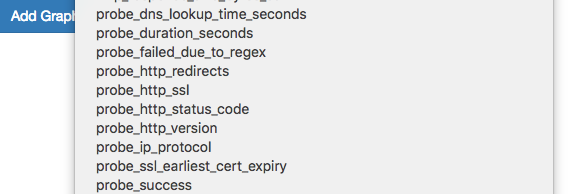
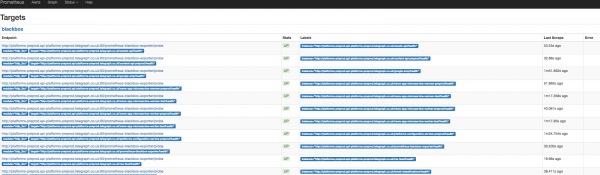
See the metrics and targets of Blackbox.
Adding alert rules
To receive alerts from the Blackbox exporter, we will add rules to the Prometheus Operator.
kubectl --namespace=monitoring edit prometheusrules prometheus-k8s-rules
...
  - name: blackbox-exporter
    rules:
    - alert: ProbeFailed
      expr: probe_success == 0
      for: 5m
      labels:
        severity: error
      annotations:
        summary: "Probe failed (instance {{ $labels.instance }})"
        description: "Probe failed
  VALUE = {{ $value }}
  LABELS: {{ $labels }}"
    - alert: SlowProbe
      expr: avg_over_time(probe_duration_seconds[1m]) > 1
      for: 5m
      labels:
        severity: warning
      annotations:
        summary: "Slow probe (instance {{ $labels.instance }})"
        description: "Blackbox probe took more than 1s to complete
  VALUE = {{ $value }}
  LABELS: {{ $labels }}"
    - alert: HttpStatusCode
      expr: probe_http_status_code = 400
      for: 5m
      labels:
        severity: error
      annotations:
        summary: "HTTP Status Code (instance {{ $labels.instance }})"
        description: "HTTP status code is not 200-399
  VALUE = {{ $value }}
  LABELS: {{ $labels }}"
    - alert: SslCertificateWillExpireSoon
      expr: probe_ssl_earliest_cert_expiry - time() < 86400 * 30
      for: 5m
      labels:
        severity: warning
      annotations:
        summary: "SSL certificate will expire soon (instance {{ $labels.instance }})"
        description: "SSL certificate expires in 30 days
  VALUE = {{ $value }}
  LABELS: {{ $labels }}"
    - alert: SslCertificateHasExpired
      expr: probe_ssl_earliest_cert_expiry - time()  1
      for: 5m
      labels:
        severity: warning
      annotations:
        summary: "HTTP slow requests (instance {{ $labels.instance }})"
        description: "HTTP request took more than 1s
  VALUE = {{ $value }}
  LABELS: {{ $labels }}"
    - alert: SlowPing
      expr: avg_over_time(probe_icmp_duration_seconds[1m]) > 1
      for: 5m
      labels:
        severity: warning
      annotations:
        summary: "Slow ping (instance {{ $labels.instance }})"
        description: "Blackbox ping took more than 1s
  VALUE = {{ $value }}
  LABELS: {{ $labels }}"
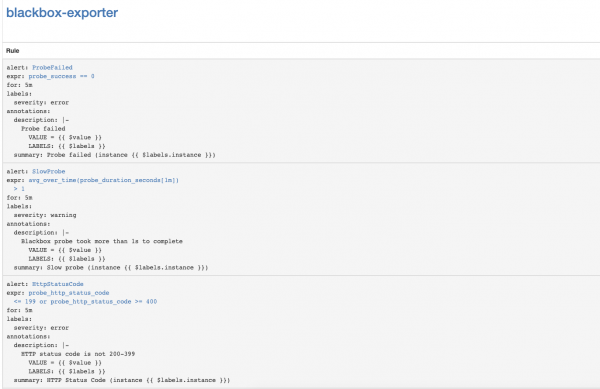
In the Prometheus web interface, go to the Status => Rules section and find the alerting rules for blackbox-exporter.
Configure notifications for SSL certificate expiration for Kubernetes API Server.
Let's set up monitoring for SSL certificate expiration for Kubernetes API Server. It will send notifications once a week.
Adding the Blackbox exporter module for Kubernetes API Server Authentication.
kubectl --namespace=monitoring edit configmap prometheus-blackbox-exporter
...
      kube-api:
        http:
          method: GET
          no_follow_redirects: false
          preferred_ip_protocol: ip4
          tls_config:
            insecure_skip_verify: false
            ca_file: /var/run/secrets/kubernetes.io/serviceaccount/ca.crt
          bearer_token_file: /var/run/secrets/kubernetes.io/serviceaccount/token
          valid_http_versions:
          - HTTP/1.1
          - HTTP/2
          valid_status_codes: []
        prober: http
        timeout: 5s
Adding Prometheus scrape configuration.
- job_name: 'kube-api-blackbox'
  metrics_path: /probe
  params:
    module: [kube-api]
  static_configs:
   - targets:
      - https://kubernetes.default.svc/api
  relabel_configs:
   - source_labels: [__address__]
     target_label: __param_target
   - source_labels: [__param_target]
     target_label: instance
   - target_label: __address__
     replacement: prometheus-blackbox-exporter:9115 # The blackbox exporter.
Applying Prometheus Secret
PROMETHEUS_ADD_CONFIG=$(cat prometheus-additional.yaml | base64)
cat << EOF | kubectl --namespace=monitoring apply -f -
apiVersion: v1
kind: Secret
metadata:
  name: additional-scrape-configs
type: Opaque
data:
  prometheus-additional.yaml: $PROMETHEUS_ADD_CONFIG
EOF
Adding alerting rules
kubectl --namespace=monitoring edit prometheusrules prometheus-k8s-rules
...
  - name: k8s-api-server-cert-expiry
    rules:
    - alert: K8sAPIServerSSLCertExpiringAfterThreeMonths
      expr: probe_ssl_earliest_cert_expiry{job="kube-api-blackbox"} - time() < 86400 * 90
      for: 1w
      labels:
        severity: warning
      annotations:
        summary: "Kubernetes API Server SSL certificate will expire after three months (instance {{ $labels.instance }})"
        description: "Kubernetes API Server SSL certificate expires in 90 daysn  VALUE = {{ $value }}n  LABELS: {{ $labels }}"
Useful links
Source: habr.com
