

I would like to share the transcript of Alexander Valialkin's presentation from the end of 2019 titled "Go optimizations in VictoriaMetrics"
— a fast and scalable DBMS for storing and processing time-series data (records form time along with a set of values corresponding to that time, e.g., collected through periodic polling of sensor states or metric gathering).
Here’s the link to the video of this presentation —
Let me tell you a bit about myself. I am Alexander Valialkin. Here’s . I am passionate about Go and performance optimization. I've written many useful, and some less useful, libraries. They primarily begin with fast, or quick prefix.
Currently, I am working on VictoriaMetrics. What is it and what am I doing there? I will explain in this presentation.
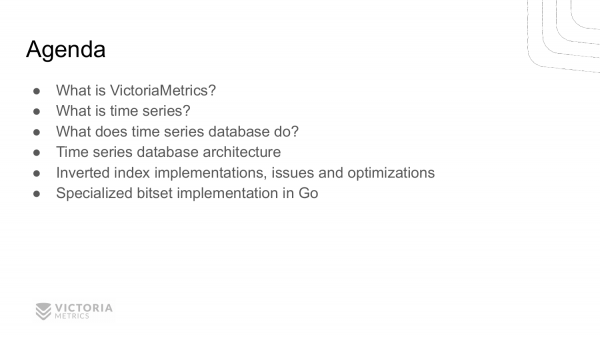
The outline of the presentation is as follows:
- First, I will explain what VictoriaMetrics is.
- Then I will describe what time-series are.
- Next, I will explain how a time-series database operates.
- After that, I will discuss the architecture of the database: what it consists of.
- Finally, we will move on to the optimizations present in VictoriaMetrics. This includes the optimization of inverted indexes and optimizations for bitset implementation in Go.
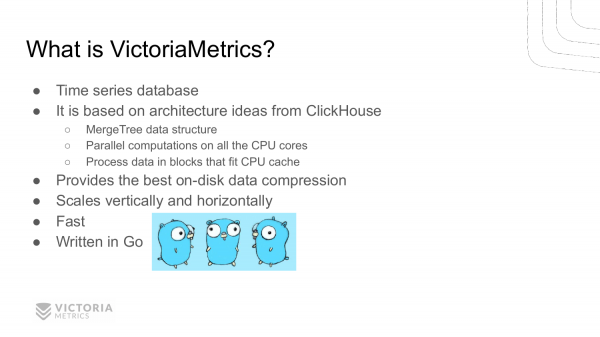
Does anyone in the audience know what VictoriaMetrics is? Wow, a lot of people do. That's good news. For those who don’t, it is a database for time series. It is based on the ClickHouse architecture, with some implementation details from ClickHouse, such as: MergeTree, parallel computing on all available processor cores, and performance optimization through work with data blocks that are cached by the processor.
VictoriaMetrics offers better data compression compared to other time-series databases.
It scales vertically — meaning you can add more processors and memory on a single machine. VictoriaMetrics will efficiently utilize these resources and enhance linear performance.
VictoriaMetrics also scales horizontally — meaning you can add additional nodes to the VictoriaMetrics cluster, and its performance will increase almost linearly.
As you might have guessed, VictoriaMetrics is a fast database, because I can't write about others. And it is written in Go, so I'm talking about it at this meetup.
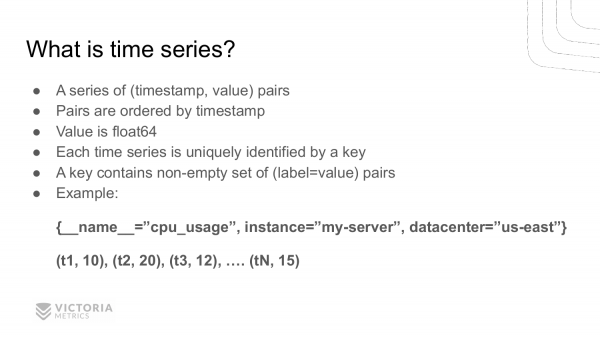
Who knows what a time series is? A lot of people know that too. A time series is a series of pairs (timestamp, value), where these pairs are sorted by time. The value is a floating-point number – float64.
Each time series is uniquely identified by a key. What does this key consist of? It consists of a non-empty set of key-value pairs.
Here is an example of a time series. The key for this series is a list of pairs: __name__="cpu_usage" – this is the name of the metric, instance="my-server" – this is the computer on which this metric is collected, datacenter="us-east" – this is the data center where this computer is located.
We have obtained a time series name consisting of three key-value pairs. This key corresponds to a list of pairs (timestamp, value). t1, t3, t3, ..., tN — these are timestamps, 10, 20, 12, ..., 15 — corresponding values. This is the cpu-usage at this moment for this series.
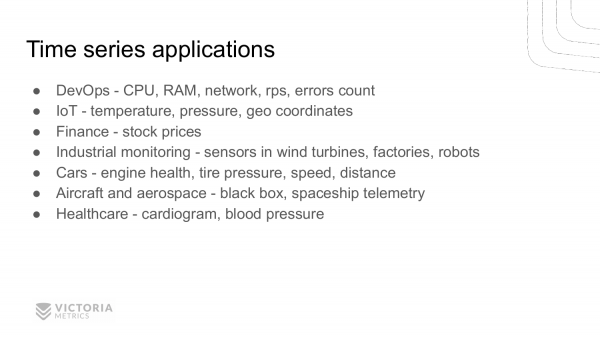
Where can time series be used? Does anyone have ideas?
- In DevOps, you can measure CPU, RAM, network load, rps, error counts, etc.
- IoT – we can measure temperature, pressure, geo coordinates, and more.
- Also in finance – we can monitor prices for various stocks and currencies.
- Moreover, time series can be used to monitor manufacturing processes in factories. We have users who use VictoriaMetrics for monitoring wind turbines and robots.
- Time series are also useful for collecting information from sensors of various devices. For instance, for engines; to measure tire pressure; speed, distance; fuel consumption, etc.
- Time series can also be used to monitor airplanes. Each airplane has a black box that collects time series on various parameters of the plane's health. Time series are also used in the aerospace industry.
- Healthcare – this includes blood pressure, pulse, etc.
There may be other applications I've forgotten about, but I hope you understand that time series are actively used in the modern world. And the volume of their usage is growing each year.
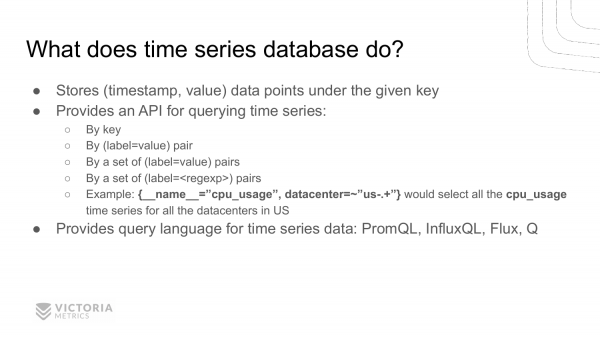
What is the purpose of a database for time series? Why can't a regular relational database be used for storing time series?
Because time series typically involve large amounts of information that are difficult to store and process in traditional databases. This is why specialized databases for time series have emerged. These databases efficiently store points (timestamp, value) with the specified key. They provide APIs for reading saved data by key, either by a single key-value pair, by several such pairs, or via regexp. For example, if you want to find the CPU load of all your services in a data center in America, you would need to use a query like this.
Typically, time series databases feature specialized query languages because SQL does not work very well for time series. Although there are databases that support SQL, it is not very well suited. Query languages such as , , , are much better suited. I hope someone has heard of at least one of these languages. Many have probably heard of PromQL, which is the query language for Prometheus.
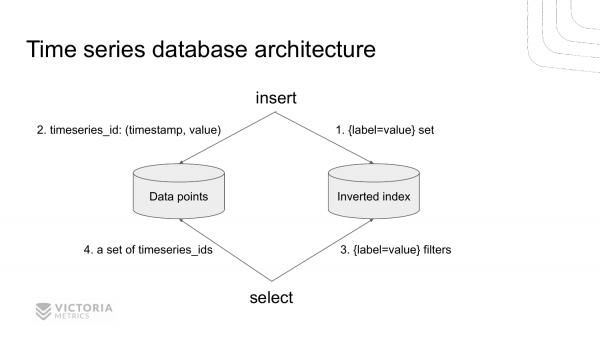
Here's what the architecture of a modern time series database looks like, using VictoriaMetrics as an example.
It consists of two parts: one for inverted index storage and one for time series value storage. These stores are separated.
When a new record arrives at the database, we first consult the inverted index to find the identifier of the time series based on the specified set label=value for the given metric. We locate this identifier and save the value in the data store.
When a request for data retrieval from the TSDB comes in, we first look in the inverted index. We fetch all timeseries_ids records that correspond to the specified set. label=valueThen we retrieve all the necessary data from the data store, indexed by timeseries_ids.
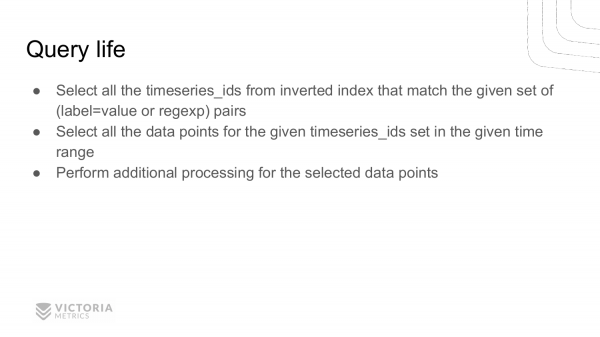
Let's consider an example of how a time series database processes an incoming select request.
- First, it fetches all
timeseries_idsfrom the inverted index that contain the specified pairslabel=value, or that meet a given regular expression. - Then it retrieves all data points from the data store over the specified time interval for the found
timeseries_ids. - After that, the database performs some calculations on these data points based on the user's request. It then returns the response.
In this presentation, I will talk to you about the first part. This is the search timeseries_ids using an inverted index. You can later look at the second and third parts , or wait until I prepare other presentations 🙂
Let’s get started with the inverted index. Many might think this is simple. Who knows what an inverted index is and how it works? Oh, not that many people now. Let’s try to understand what it is.
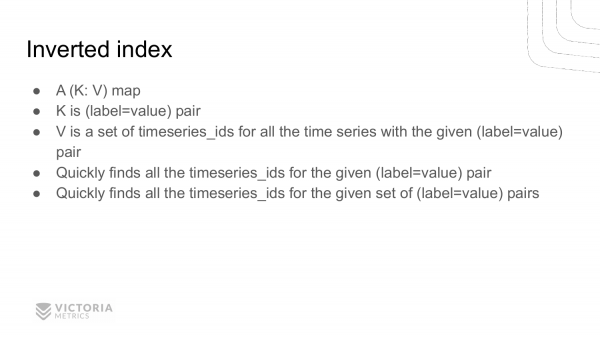
In fact, it's quite simple. It's just a dictionary that maps keys to values. What is a key? This pair label=value, where label and value — are strings. And the values are a set timeseries_ids, which includes the given pair label=value.
An inverted index allows you to quickly find all timeseries_ids, that have given label=value.
It also allows you to quickly find timeseries_ids time series for several pairs label=value, or for pairs label=regexp. How does this happen? By finding intersections of the set timeseries_ids for each pair label=value.
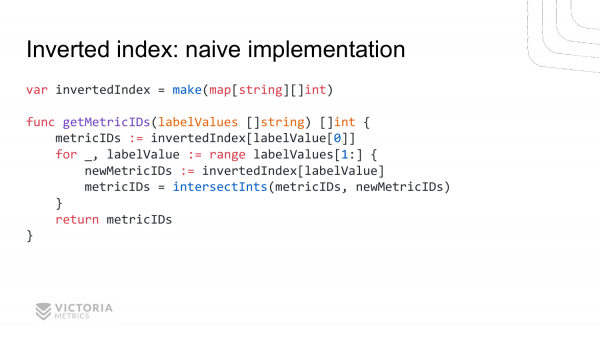
Let’s consider various implementations of the inverted index. We will start with the simplest naive implementation. It looks like this.
Function getMetricIDs retrieves a list of strings. Each string contains label=value. This function returns a list of metricIDs.
How does this work? Here we have a global variable called invertedIndex. This is a regular dictionary (map), which maps a string to a slice of integers. The string contains label=value.
Implementation of the function: we retrieve metricIDs for the first label=value, then go through all the others label=value, retrieving metricIDs for them. And we call the function intersectInts, which will be discussed later. And this function returns the intersection of these lists.
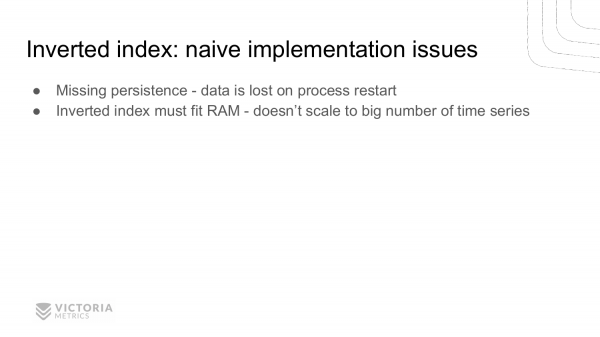
As you can see, the implementation of the inverted index is not very complex. But this is a naive implementation. What are its drawbacks? The main disadvantage of the naive implementation is that such an inverted index is stored in memory. After restarting the application, we lose this index. There is no saving of this index to disk. For a database, such an inverted index is unlikely to be suitable.
The second drawback is also related to memory. The inverted index must fit into RAM. If it exceeds the size of the RAM, it's clear that we will get an out of memory error, and the program will not work.
This problem can be solved using ready-made solutions such as , or .
In short, we need a database that allows us to perform three operations quickly.
- The first operation is writing
key-valueto this database. It does this very quickly, wherekey-valueare arbitrary strings. - The second operation is a fast lookup of a value by a given key.
- And the third operation is a fast lookup of all values by a given prefix.
LevelDB and RocksDB are databases developed at Google and Facebook. First came LevelDB. Then the folks at Facebook took LevelDB and began improving it, creating RocksDB. Now, almost all internal databases at Facebook operate on RocksDB, including migrating MySQL to RocksDB. They named it .
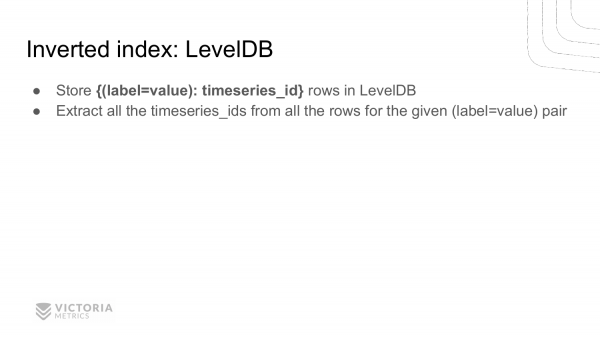
An inverted index can be implemented using LevelDB. How is this done? We store label=valueas the key. And as the value, we keep the time series identifier where the pair exists. label=value.
If we have many time series with this pair label=value, there will be many rows in this database with the same key and different timeseries_ids. To get a list of all timeseries_ids, which begin with this label=prefix, we perform a range scan, which this database is optimized for. That is, we select all rows that start with label=prefix and get the necessary timeseries_ids.
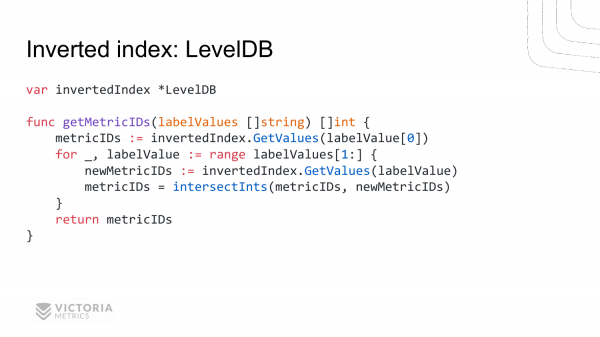
. Here is a rough implementation of how it would look in Go. We have an inverted index. This is LevelDB.
The function is the same as for the naive implementation. It almost line by line repeats the naive implementation. The only difference is that instead of referencing map we refer to the inverted index. We retrieve all values for the first label=value. Then we iterate through all remaining pairs label=value and fetch the corresponding sets of metricIDs for them. Then we find the intersection.
Everything seems fine, but this solution has its drawbacks. VictoriaMetrics initially implemented the inverted index based on LevelDB. But ultimately, they had to abandon it.
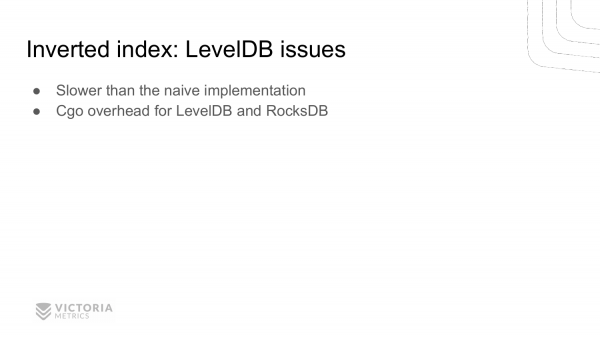
Why? Because LevelDB is slower than the naive implementation. In the naive implementation, given a key, we immediately retrieve the entire slice metricIDs. This is a very fast operation — the entire slice is ready for use.
In LevelDB, with each function call of GetValues , you need to iterate over all the rows that start with label=value. For each row, retrieve the value timeseries_ids. From these, timeseries_ids collect a slice of these timeseries_ids. Clearly, this is much slower than merely accessing a regular map by key.
The second drawback is that LevelDB is written in C. Calling C functions from Go is not very fast. It takes hundreds of nanoseconds. This is not fast because, compared to a typical function call written in Go, which takes 1-5 nanoseconds, the performance difference can be tens of times worse. For VictoriaMetrics, this was a fatal flaw 🙂
Therefore, I wrote my own implementation of an inverted index and named it .
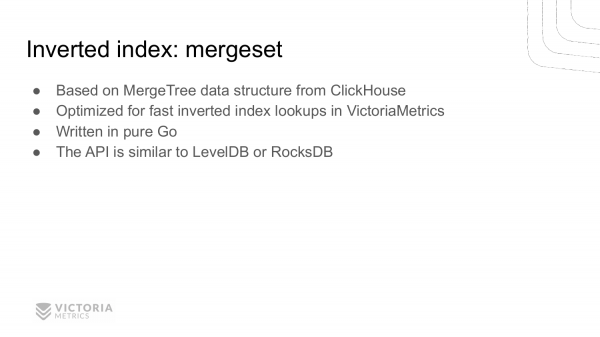
Mergeset is based on the MergeTree data structure. This data structure is borrowed from ClickHouse. Obviously, mergeset should be optimized for fast searching timeseries_ids by the specified key. Mergeset is fully written in Go. You can take a look at the . The implementation of mergeset is in the folder . You can try to figure out what’s happening there.
The API of mergeset is very similar to LevelDB and RocksDB. That is, it allows you to quickly save new records and efficiently retrieve records by a given prefix.
We'll talk about the drawbacks of mergeset later. For now, let's discuss the issues that arose with VictoriaMetrics in production while implementing the inverted index.
Why did they occur?
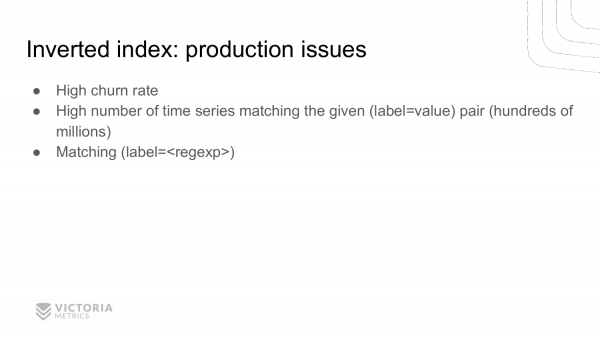
The first reason is the high churn rate. In simple terms, this means frequent changes in time series. This happens when a time series ends and a new one begins, or many new time series are initiated. And this happens often.
The second reason is the large number of time series. Initially, when monitoring became popular, the number of time series was small. For example, for each computer, you need to monitor the CPU, memory, network, and disk usage. That’s 4 time series per computer. Suppose you have 100 computers and 400 time series. That’s very few.
Over time, people have come up with the idea of measuring more detailed information. For example, measuring the load of not just the entire CPU, but each individual CPU core separately. If you have 40 CPU cores, you then have 40 times more time series to measure the CPU load.
But that's not all. Each CPU core can have several states, such as idle when it's not doing anything. There are also operations in user space, operations in kernel space, and other states. Each of these states can also be measured as a separate time series. This increases the number of series by an additional 7-8 times.
From one metric, we got 40 x 8 = 320 metrics for just one computer. Multiply that by 100, and we get 32,000 instead of 400.
Then Kubernetes came along, and it made things even worse because many different services can be hosted in Kubernetes. Each service in Kubernetes consists of many pods, and all of this needs to be monitored. Additionally, we have constant deployments of new versions of your services. For each new version, new time series must be created. As a result, the number of time series grows exponentially, and we face the issue of a large number of time series known as high-cardinality. VictoriaMetrics successfully handles this compared to other time series databases.
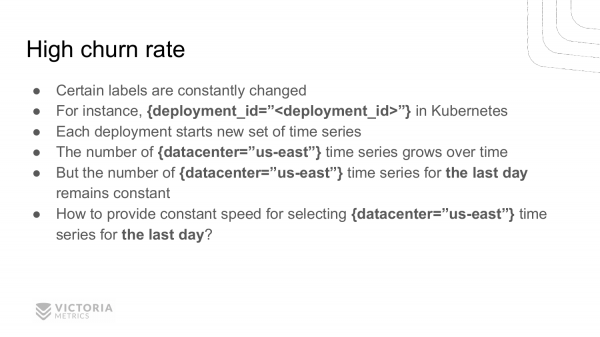
Let's take a closer look at high churn rate. What causes high churn rate in production? It occurs because certain label and tag values are constantly changing.
For example, let’s take Kubernetes, which has the concept of deployment, that is, when a new version of your application is rolled out. For some reason, Kubernetes developers decided to add a deployment ID to the label.
What did this lead to? It caused all old time series to break with every new deployment, and instead, new time series began with a new label value deployment_id. Such series can number in the hundreds of thousands or even millions.
An important feature of this is that while the total number of time series is increasing, the number of time series that are currently active, to which data is being sent, remains constant. This state is referred to as high churn rate.
The main issue with a high churn rate is ensuring consistent search speed for all time series across a given set of labels within a specific time interval. This is usually a time interval for the last hour or the last day.
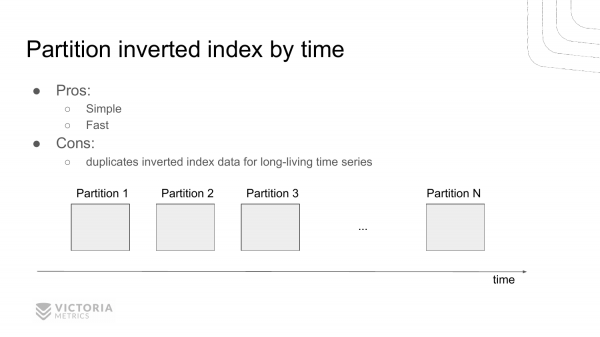
How can we solve this problem? Here’s the first option. It is to divide the inverted index into independent time-based parts. That is, once a certain time interval passes, we stop using the current inverted index and create a new one. Another time interval passes, and we create yet another one.
When querying these inverted indexes, we find a set of inverted indexes that fall within the specified interval. Accordingly, we select the time series IDs from there.
This helps save resources because we do not need to scan the parts that do not fall within the specified interval. For instance, if we are retrieving data for the last hour, we skip queries for the earlier time intervals.
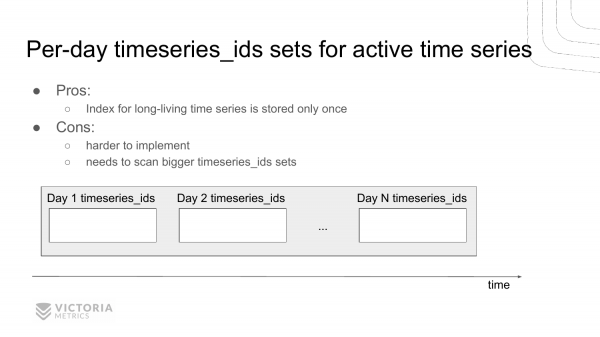
There’s another option to solve this problem. It involves storing a separate list of time series IDs encountered for each day.
The advantage of this solution over the previous one is that we do not duplicate information about time series that do not disappear over time. They are consistently available and do not change.
The downside is that this solution is more complex to implement and to debug. VictoriaMetrics chose this solution due to historical factors. This solution also performs fairly well compared to the previous one. The previous implementation was not designed due to the need to duplicate data in each partition for time series that do not change, i.e., those that do not disappear over time. VictoriaMetrics was primarily optimized for disk space consumption, and the prior implementation worsened disk space usage. This implementation, however, is better suited for minimizing disk space consumption, which is why it was chosen.
We had to deal with this issue. The challenge was that in this implementation, we still need to select a significantly larger amount timeseries_ids of data than when the inverted index is time-based.
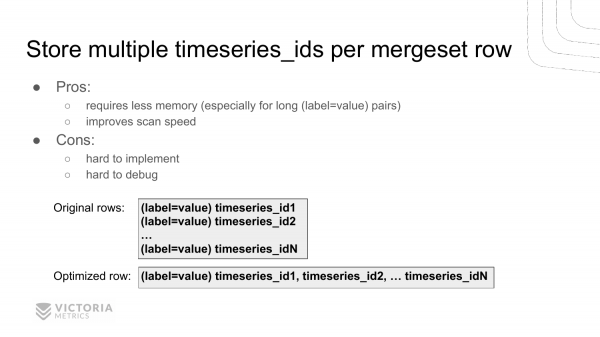
How did we solve this problem? We tackled it in a unique way—by saving multiple time series identifiers in each entry of the inverted index instead of just one identifier. That is, we have a key label=value, which appears in every time series. Now we store several timeseries_ids in a single record.
Here’s an example. Previously, we had N records, and now we have one record whose prefix is the same as all the others. The previous record value contains all the time series IDs.
This has increased the scanning speed of such an inverted index by up to 10 times. It also reduced memory consumption for the cache because now we store the string label=value only once in the cache instead of N times. And this string can be large, especially if you have long strings in your tags and labels that Kubernetes tends to generate.
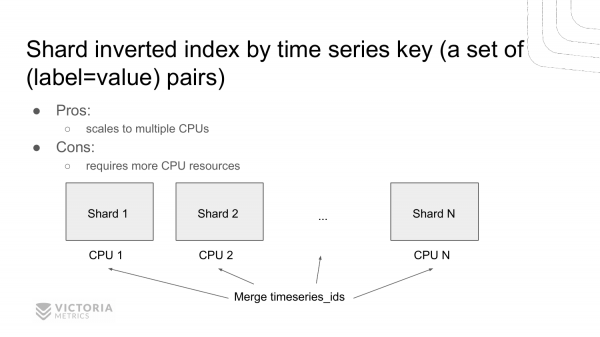
Another option to speed up searches in an inverted index is sharding. Creating multiple inverted indexes instead of one and sharding the data among them by key. This is a set key=value of pairs. That is, we end up with several independent inverted indexes that we can query in parallel on multiple processors. Previous implementations only allowed single-threaded operation, meaning data could only be scanned on one core. This solution allows scanning data across several cores simultaneously, just like ClickHouse prefers to do. We plan to implement this.
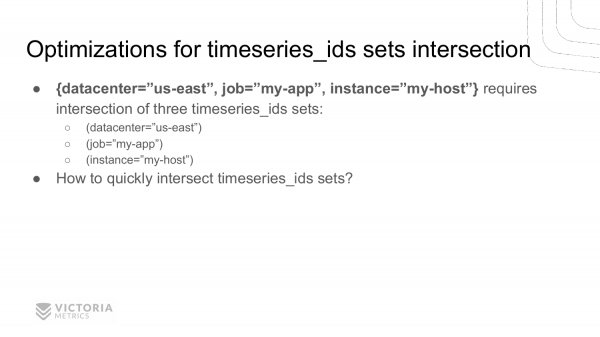
Now back to our topic—the intersection function timeseries_ids. Let's consider what implementations are possible. This function allows finding timeseries_ids for a given set label=value.
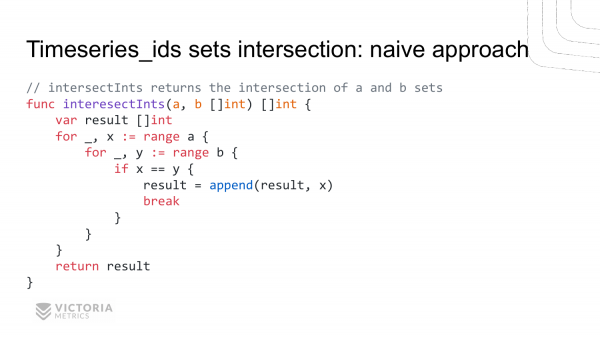
The first option is the naive implementation. Two nested loops. We provide the function with intersectInts two slices— a and b. It should return the intersection of these slices.
The naive implementation looks like this. We iterate through all the values of slice a, and within this loop, we iterate through all the values of slice b. We compare them. If they match, we've found an intersection. We save it in result.

What are the drawbacks? Quadratic complexity is the main downside. For instance, if your slice sizes are a and b If we consider one million, this function will never return an answer to you. Because it will need to perform one trillion iterations, which is a lot even for modern computers.
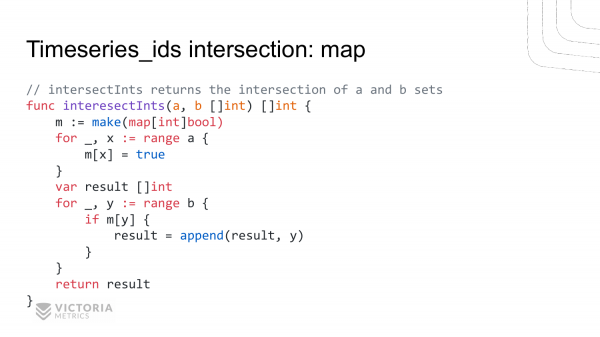
The second implementation is based on a map. We create a map. We place all the values from the slice into this map. aThen we iterate through the slice separately. bAnd we check if this value from the slice b is in the map. If it is, we add it to the result.
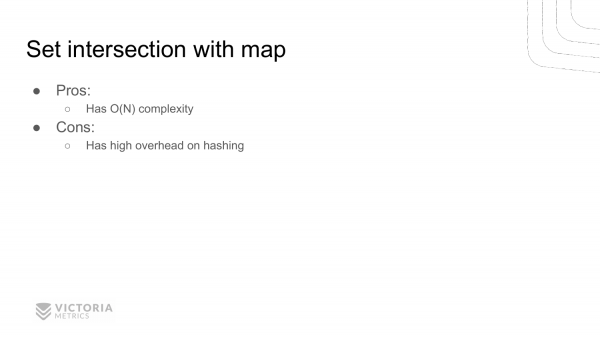
What are the advantages? The advantage is that here we have only linear complexity. That is, the function will run significantly faster for large sizes of slices. For a slice size of a million, this function will complete in 2 million iterations, unlike the trillion iterations in the previous function.
The downside is that this function requires more memory to create the map.
A second disadvantage is the large overhead for hashing. This disadvantage isn't very obvious. It wasn't immediately clear to us either, which is why initially in VictoriaMetrics the intersection implementation was through a map. However, profiling later showed that most of the CPU time was spent on writing to the map and checking the presence of values in this map.
Why is CPU time spent in these places? Because in those lines Go performs a hashing operation. That is, it calculates the hash from the key to access it later by the given index in the HashMap. The hash calculation operation takes tens of nanoseconds. This is slow for VictoriaMetrics.
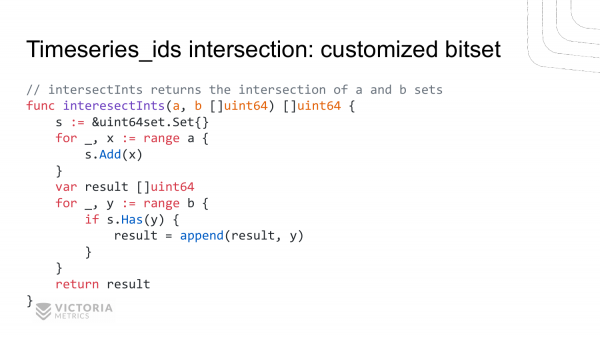
I decided to implement a bitset, specifically optimized for this case. Here's how the intersection of two slices now looks. We create a bitset. We add elements from the first slice into it. Then we check for the presence of these elements in the second slice. And we add them to the result. That is, it is almost no different from the previous example. The only thing we replaced here is the access to the map with custom functions. add and has.
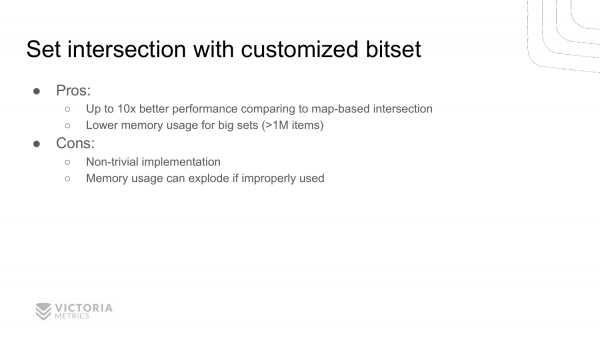
At first glance, it seems that this should work slower, given that a standard map was previously used and now some functions are being called, but profiling shows that this runs 10 times faster than the standard map for the case with VictoriaMetrics.
Additionally, it uses much less memory compared to the map implementation. Because we store bits here instead of eight-byte values.
The drawback of this implementation is that it is not very obvious and non-trivial.
Another drawback that many might not notice is that this implementation can perform poorly in certain cases. That is, it is optimized for a specific case, for the case of intersecting IDs in VictoriaMetrics time series. This does not mean that it will work for all cases. If used incorrectly, we will not see performance gain but rather an out of memory error and reduced performance.
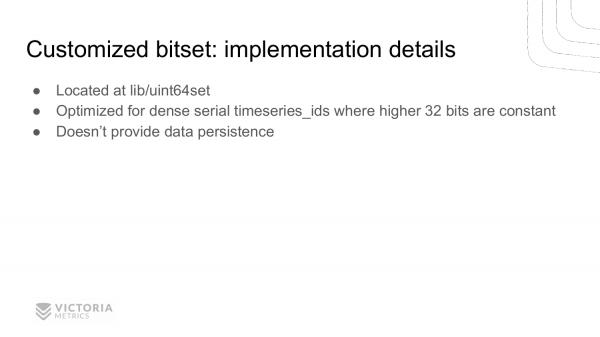
Let's consider the implementation of this structure. If you want to take a look, it is in the source code of VictoriaMetrics, in the folder . It is specifically optimized for the VictoriaMetrics case, where timeseries_id represents a 64-bit value, where the first 32 bits are mainly constant and only the last 32 bits change.
This data structure is not stored on disk; it only works in memory.
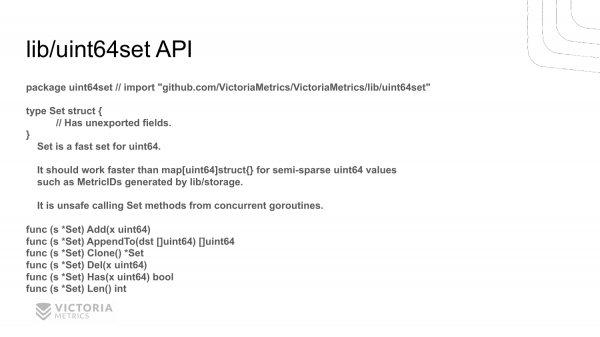
Here is its API. It is not very complex. The API is tailored specifically for the VictoriaMetrics usage example. That is, there are no unnecessary functions. Here are the functions that are explicitly used by VictoriaMetrics.
There is a function add, which adds new values. There is a function has, which checks new values. And there is a function del, which removes values. There is an auxiliary function len, which returns the size of the set. The function clone clones the set. And the function appendto converts this set into a slice. timeseries_ids.
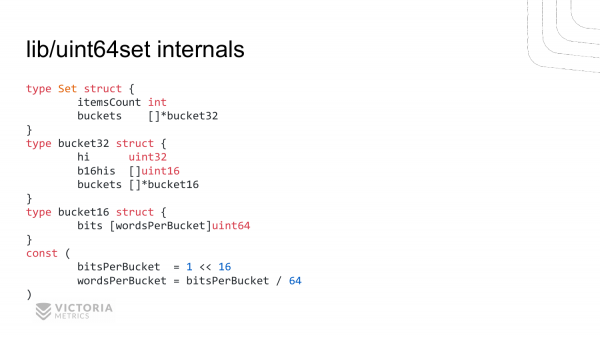
Here is how the implementation of this data structure looks. In the set, there are two elements:
ItemsCount– this is an auxiliary field to quickly return the number of elements in the set. It would be possible to do without this auxiliary field, but it had to be added here because VictoriaMetrics frequently queries the length of the bitset in its algorithms.The second field is
buckets.This is a slice of the structurebucket32.In each structure, there is ahifield. These are the upper 32 bits. And two slices —b16hisandbuckets.frombucket16structures.
Here, the upper 16 bits of the second part of the 64-bit structure are stored. And here are the bitsets for the lower 16 bits of each byte.
Bucket64 consists of an array uint64.The length is calculated using these constants. In one bucket16 a maximum can store 2^16=65536 bits. If divided by 8, that is 8 kilobytes. If divided again by 8, that is 1000 uint64. values. That is, Bucket16 is our 8-kilobyte structure.
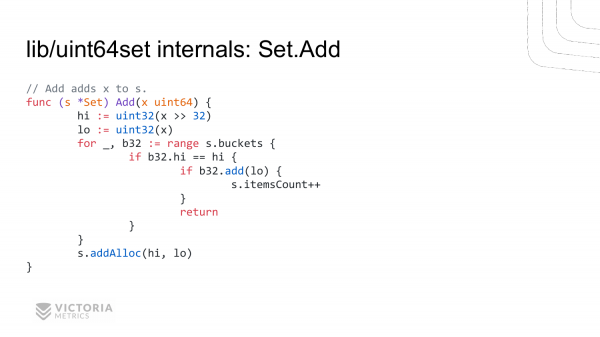
Let's consider how one of the methods of this structure for adding a new value is implemented.
It all starts with uint64. the value. We calculate the upper 32 bits and the lower 32 bits. We go through all buckets.. We compare the upper 32 bits in each bucket with the value being added. If they match, we call the function add in the b32 structure buckets.. And we add the lower 32 bits there. If this returns true, it means we have added this value and it was not previously present. If it returns false, then such a value already existed. We then increment the number of elements in the structure.
If we didn't find the required bucket with the required hi-value, we call the function addAlloc, which allocates a new bucket, adding it to the bucket structure.
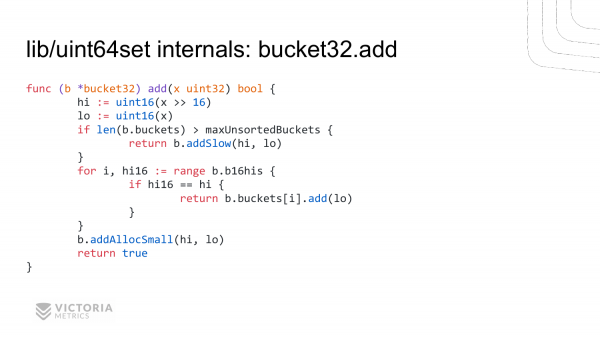
This is the implementation of the function b32.add. It is similar to the previous implementation. We compute the upper 16 bits and the lower 16 bits.
Then we go through all the upper 16 bits. We find matches. Upon a match, we call the add method, which we will examine on the next page for bucket16.
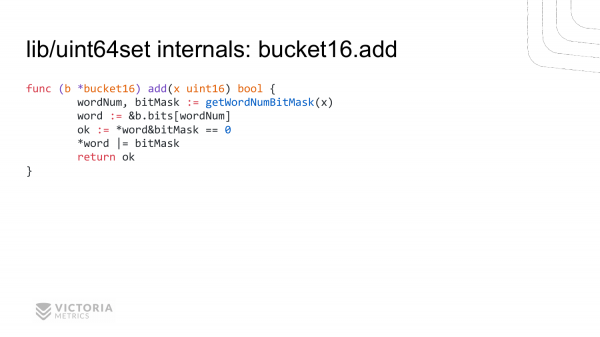
And here is the lowest level, which should be maximally optimized. We compute the id value in the slice bit, as well as the uint64. bitmask . This is a mask for the given 64-bit value, which can be used to check the presence of this bit or set it. We check the presence of this set bit, set it, and return its presence. This implementation allows us to speed up the intersection operation of time series ids by 10 times compared to regular maps.In VictoriaMetrics, in addition to this optimization, there are many other optimizations. Most of these optimizations are not added randomly, but after profiling the code in production.
This is the main rule of optimization – do not add optimization assuming that there will be a bottleneck here, because it may turn out that there is no bottleneck. Optimization usually degrades code quality. Therefore, one should optimize only after profiling and preferably in production, so that it uses real data. If you're interested, you can look at the source code of VictoriaMetrics and study other optimizations that are present there.
I have a question about bitset. It closely resembles the implementation of C++ vector, an optimized bitset. Did you take the implementation from there?
I have a question about bitset. It closely resembles the C++ optimized vector bool implementation. Did you take the implementation from there?
No, not from there. When implementing this bitset, I was guided by the knowledge of the timeseries structure used in VictoriaMetrics. Their structure is such that the upper 32 bits are mostly constant. The lower 32 bits can change. The lower the bit, the more often it can change. Therefore, this implementation is specifically optimized for this data structure. The C++ implementation, as far as I know, is optimized for the general case. If you optimize for the general case, it means it won't be the most optimal for a specific case.
I recommend you also check out Alexey Milovid's presentation. About a month ago, he discussed optimizations in ClickHouse for specific specializations. He explains that, in general, C++ implementations or any other implementations are tuned for good performance on average across the board. It may perform worse than a specialized implementation based on specific knowledge, as we have when we know that the upper 32 bits are mostly constant.
I have a second question. What is the fundamental difference from InfluxDB?
There are many fundamental differences. In terms of performance and memory consumption, InfluxDB shows 10 times more memory consumption in tests for high cardinality timeseries when you have many, for example, millions. For instance, VictoriaMetrics consumes 1 GB for a million active series, while InfluxDB consumes 10 GB. That’s a significant difference.
The second fundamental difference is that InfluxDB has strange query languages – Flux and InfluxQL. They are not very convenient for working with timeseries compared to , which is supported in VictoriaMetrics. PromQL is the query language from Prometheus.
Another difference is that InfluxDB has a somewhat odd data model where each line can store multiple fields with different sets of tags. These lines are further divided into various tables. These additional complexities make subsequent work with this database challenging. It is difficult to maintain and understand.
In VictoriaMetrics, everything is much simpler. Each timeseries is represented as a key-value pair. The value is a set of points – (timestamp, value), and the key is a set label=valueThere is no separation into fields and measurements. This allows you to select any data and then combine, add, subtract, multiply, or divide it, unlike InfluxDB, where calculations between different series have not been implemented yet, as far as I know. Even if they are implemented, it’s complicated; you have to write a lot of code.
I have a clarifying question. Did I understand correctly that there was some issue you mentioned about this inverted index not fitting into memory, which is why partitioning is being used?
At first, I showed a naive implementation of an inverted index based on a standard Go map. This implementation isn't suitable for databases because this inverted index is not saved to disk, and a database must save to disk so that this data remains available upon restart. In this implementation, the inverted index will be lost upon restarting the application. You will lose access to all your data because you won’t be able to find it.
Hello! Thank you for your presentation! My name is Pavel. I’m from Wildberries. I have a few questions for you. The first question is: Do you think that if you had chosen a different principle for building the architecture of your application and partitioned the data by time, you might have been able to perform data intersections during searches, based solely on the fact that a single partition contains data for only one time interval? This way, you wouldn’t have to worry about having pieces scattered differently. The second question is — since you’re implementing such an algorithm with a bitset and everything else, have you tried using processor instructions? Perhaps you have attempted such optimizations?
I'll answer the second question right away. We haven't gotten to that yet. But if necessary, we will get there. And what was the first question?
You discussed two scenarios and mentioned that you chose the second one with a more complex implementation, and you didn’t prefer the first one where the data is partitioned by time.
Yes. In the first case, the total index size would be larger because we would have to store duplicate data in each partition for those time series that span across all the partitions. If your churn rate for the time series is low, meaning the same series are frequently used, in the first case, we would have a much larger disk space overhead compared to the second case.
That's right – time-based partitioning is a good option. Prometheus uses it. However, Prometheus has another drawback. When merging these data chunks, it requires keeping metadata for all labels and timeseries in memory. Therefore, if the data chunks it merges are large, memory consumption increases significantly during merging, unlike in VictoriaMetrics. VictoriaMetrics requires very little memory during merging, using only a few kilobytes regardless of the size of the data chunks being merged.
The algorithm you are using consumes memory. It keeps track of timeseries labels that have values. This way, you check for the presence in one data array and another, allowing you to understand if an intersection has occurred or not. Usually, databases implement cursors and iterators that maintain their current state while traversing sorted data, resulting in a simple complexity for these operations.
Why don't we use cursors for data intersection?
Yes.
In LevelDB or in the mergeset, we store sorted rows. We can use a cursor to find the intersection. So why don't we use it? Because it's slow. Cursors imply that a function needs to be called for each row. A function call takes about 5 nanoseconds. If you have 100,000,000 rows, that means we spend half a second just on calling the function.
That exists, yes. And my last question. This question might sound a bit strange. Why can't we compute all necessary aggregates upon data arrival and save them in the required form? Why store huge volumes in systems like VictoriaMetrics, ClickHouse, etc., only to spend a lot of time on them later?
Let me give you an example to make it clearer. Suppose, how does a small toy speedometer work? It records the distance you have traveled, constantly adding it to one measurement, and the time to another. It then divides them. Thus, it obtains the average speed. You can do something similar. Collect all the necessary facts on the fly.
Okay, I understand the question. Your example is quite relevant. If you know what aggregates you need, then that's the best implementation. But the problem is that people store these metrics and some data in ClickHouse, and they don’t yet know how they will aggregate or filter them in the future, so they end up saving all the raw data. But if you know that you need to calculate something average, then why not calculate it instead of storing a bunch of raw values? But this is only if you know exactly what you need.
By the way, databases for storing time series support aggregate calculations. For example, Prometheus supports . That is, this can be done if you know what aggregates you will need. In VictoriaMetrics, this is currently not available, but Prometheus is typically installed in front of it, where you can do this in recording rules.
For instance, in my previous job, we needed to count the number of events in a sliding window over the last hour. The problem was that a custom implementation had to be created in Go, i.e., a service for counting this. This service turned out to be non-trivial because counting is complex. The implementation can be simple if you need to calculate some aggregates over fixed time intervals. However, if you want to count events in a sliding window, it's not as easy as it seems. I think this still hasn’t been implemented in ClickHouse or time series databases because it’s challenging to realize.
And one more question. We were just talking about averaging, and I remembered that there was once something called Graphite with a Carbon backend. It could downsample old data, leaving one point per minute, one point per hour, and so on. In principle, this is quite convenient if we need raw data, so to speak, for a month, while everything else can be downsampled. But Prometheus and VictoriaMetrics do not support this functionality. Is there a plan to support it? If not, then why?
Thank you for your question. Our users often ask it. They wonder when we will add support for downsampling. There are several issues here. First, every user has a different understanding of — automatic aggregate calculation. what they want: some want any arbitrary point within a given interval, others want maximum, minimum, or average values. If multiple systems are writing data into your database, you can't just treat them all the same. It may turn out that different downsampling needs to be used for each system. And this is complicated to implement.
Secondly, VictoriaMetrics, like ClickHouse, is optimized for working with large volumes of raw data. Therefore, it can process a billion rows in less than a second if you have many cores in your system. Scanning time series points in VictoriaMetrics is 50,000,000 points per second per core. This performance scales with the available cores. That is, if you have 20 cores, for example, you can scan a billion points per second. This characteristic of VictoriaMetrics and ClickHouse reduces the need for downsampling.
Another property is that VictoriaMetrics effectively compresses this data. Compression rates in production average from 0.4 to 0.8 bytes per point. Each point consists of a timestamp + value. And it compresses to less than one byte on average.
Sergey. I have a question. What is the minimum time quantum for recording?
One millisecond. Recently, we had a conversation with other developers of time series databases. Their minimum time quantum is one second. In Graphite, for example, it's also one second. In OpenTSDB, it's one second as well. In InfluxDB, there's nanosecond accuracy. In VictoriaMetrics, it's one millisecond because Prometheus operates on a one-millisecond basis. VictoriaMetrics was originally developed as a remote storage for Prometheus. But now it can also store data from other systems.
The person I spoke to mentioned that they use second accuracy — which is sufficient for them because it depends on the type of data stored in the time series database. If it's DevOps data or infrastructure data, collected at intervals of 30 seconds to a minute, then second accuracy is enough; anything less is unnecessary. However, if you are collecting data from high frequency trading systems, then nanosecond precision is required.
Millisecond accuracy in VictoriaMetrics is suitable for both DevOps cases and may fit most scenarios I mentioned at the start of the presentation. The only situation where it might not be appropriate is for high-frequency trading systems.
Thank you! And one more question. What compatibility exists in PromQL?
Full backward compatibility. VictoriaMetrics fully supports PromQL. Additionally, it adds extended functionality to PromQL called . Regarding this extended functionality, there is a presentation on YouTube. I spoke at the Monitoring Meetup in spring in St. Petersburg.
Telegram channel .
Only registered users can participate in the survey. , please.
What prevents you from switching to VictoriaMetrics as a long-term storage solution for Prometheus? (Write in the comments, and I'll add it to the survey)
71,4%I don't use Prometheus5
28,6%I wasn't aware of VictoriaMetrics2
7 users voted. 12 users abstained.
Source: habr.com
