

The translation of the article is specially prepared for the students of the course .
— a software developer, Go enthusiast, and lover of solving complex problems. He is also the maintainer of Prometheus and co-founder of Kubernetes SIG instrumentation. Previously, he was a production engineer at SoundCloud and led the monitoring group at CoreOS. He currently works at Google.
— an infrastructure engineer at Improbable. He is passionate about new technologies and issues in distributed systems. He has experience in low-level programming at Intel, contributed to Mesos, and has global-scale SRE experience at Improbable. He is focused on improving the world of microservices. His three loves: Golang, open source, and volleyball.
Looking at our flagship product SpatialOS, you can guess that Improbable requires a high-performance cloud infrastructure on a global scale with tens of Kubernetes clusters. We were among the first to start using the monitoring system . Prometheus can track millions of metrics in real time and comes with a powerful query language that allows for extracting necessary information.
The simplicity and reliability of Prometheus are among its main advantages. However, after reaching a certain scale, we encountered several drawbacks. To address these issues, we developed — an open-source project created by Improbable to seamlessly transform existing Prometheus clusters into a unified monitoring system with unlimited historical data storage. Thanos is available on Github .
Our goals with Thanos
At a certain scale, challenges arise that go beyond the capabilities of vanilla Prometheus. How can we reliably and cost-effectively store petabytes of historical data? Is it possible to do this without compromising response times for queries? Can we access all metrics located on different Prometheus servers using a single API request? Is there a way to consolidate replicated data collected using Prometheus HA?
To address these questions, we created Thanos. The following sections describe how we approached solving these issues and explain the goals we pursued.
Querying data from multiple Prometheus instances (global query)
Prometheus offers a functional approach to sharding. Even a single Prometheus server provides sufficient scalability to free users from the complexities of horizontal sharding in almost all use cases.
While this is an excellent deployment model, it is often necessary to access data from different Prometheus servers through a single API or UI — a global view. Of course, there is the option to display multiple queries in a single Grafana panel, but each query can only be executed against one Prometheus server. On the other hand, with Thanos, you can query and aggregate data from multiple Prometheus servers, as all of them are accessible from one endpoint.
Previously, to achieve a global view at Improbable, we organized our Prometheus instances in a multi-tiered . This involved creating a single meta-server Prometheus that collects a portion of the metrics from each "leaf" server.
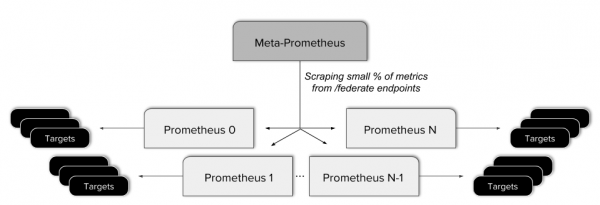
This approach turned out to be problematic. It complicated configuration, introduced an additional potential point of failure, and applied complex rules to provide the federated endpoint with only the necessary data. Additionally, this type of federation does not allow for a true global view, as not all data is available from a single API request.
This is closely related to a unified view of data collected on highly available (high-availability, HA) Prometheus servers. The HA model of Prometheus independently collects data twice, which is so straightforward that it couldn’t be simpler. However, using a combined and deduplicated view of both streams would be much more convenient.
Of course, there is a necessity for highly available Prometheus servers. At Improbable, we take real-time data monitoring seriously, but having a single instance of Prometheus in a cluster represents a single point of failure. Any configuration error or hardware failure could potentially lead to the loss of critical data. Even a simple deployment can result in minor metric collection disruptions, as restarts can take significantly longer than the scraping interval.
Reliable storage of historical data
Affordable, fast, and long-term metric storage is our dream (shared by most Prometheus users). At Improbable, we had to set the metrics retention period to nine days (for Prometheus 1.8). This imposes obvious limitations on how far back we can look.
Prometheus 2.0 has improved in this regard, as the number of time series no longer affects the overall server performance (see ). Nevertheless, Prometheus stores data on local disks. While highly efficient data compression can significantly reduce the usage of local SSDs, there still exists an ultimate limit to the amount of historical data that can be retained.
Additionally, at Improbable, we care about reliability, simplicity, and cost. Large local disks are more challenging to operate and back up. They are more expensive and require more tools for backup, leading to unnecessary complexity.
Downsampling
Once we started working with historical data, we realized there are fundamental complexities with big O, which make queries slower and slower if we work with data spanning weeks, months, and years.
A standard solution to this problem would be — reducing the sampling rate of the signal. By downsampling, we can 'scale down' to a larger time span while maintaining the same number of samples, which helps to preserve query responsiveness.
Downsampling old data is an inevitable requirement for any long-term storage solution and goes beyond vanilla Prometheus.
Additional Goals
One of the initial goals of the Thanos project was seamless integration with any existing Prometheus installations. The second goal was easy operation with minimal entry barriers. Any dependencies should be easily satisfied for both small and large users, which also implies minimal base costs.
Thanos Architecture
After listing our goals in the previous section, let’s work on them and see how Thanos addresses these challenges.
Global view
To achieve a global view on top of existing Prometheus instances, we need to link a single entry point for requests to all servers. This is exactly what the Thanos component does. . It is deployed alongside each Prometheus server and acts as a proxy, serving local Prometheus data through the gRPC Store API interface, enabling time series data selection based on labels and time ranges.
On the other hand, there is a horizontally scalable stateless Querier component, which does a little more than just respond to PromQL queries via the standard Prometheus HTTP API. The Querier, Sidecar, and other Thanos components interact through .
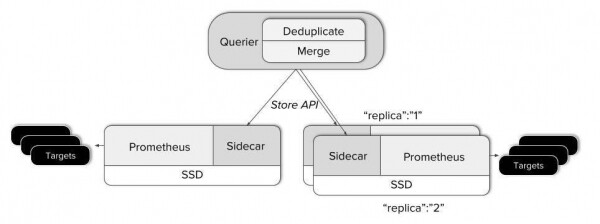
- When the Querier receives a request, it connects to the corresponding Store API server, that is, to our Sidecars, and retrieves time series data from the relevant Prometheus servers.
- After that, it combines the responses and executes the PromQL query. The Querier can merge both non-overlapping data and duplicated data from HA Prometheus servers.
This solves the main part of our puzzle — merging data from isolated Prometheus servers into a single view. In fact, Thanos can be used solely for this capability. There is no need to make any changes to existing Prometheus servers!
Unlimited retention!
However, sooner or later, we will want to retain data that exceeds the usual retention period of Prometheus. For historical data storage, we have chosen object storage. It is widely available in any cloud and also in local data centers and is very cost-effective. Additionally, practically any object storage is accessible via the well-known S3 API.
Prometheus writes data from memory to disk approximately every two hours. A block of stored data contains all data for a fixed time interval and is immutable. This is very convenient, as Thanos Sidecar can simply watch the Prometheus data directory and, as new blocks appear, load them into the object storage buckets.
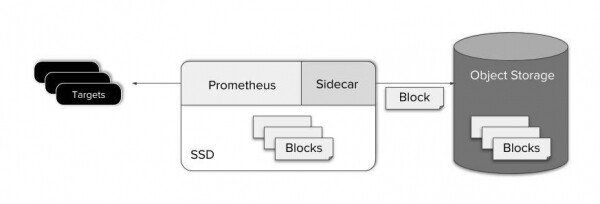
Uploading to object storage immediately after writing to disk also helps maintain the simplicity of the 'scraper' (Prometheus and Thanos Sidecar). This simplifies maintenance, costs, and system design.
As you can see, data backup is implemented very easily. But what about querying data in object storage?
The Thanos Store component acts as a proxy for retrieving data from object storage. Like Thanos Sidecar, it participates in the gossip cluster and implements the Store API. Thus, existing Queriers can see it as a Sidecar, serving as another source of time series data—no special configuration is required.
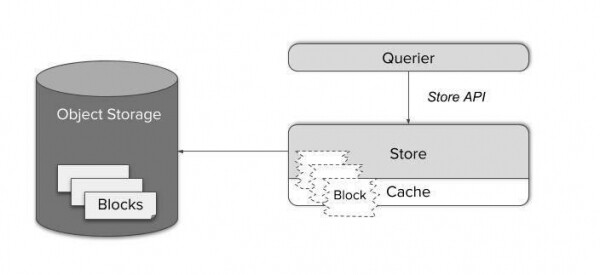
Time series data blocks consist of several large files. Loading them on demand would be quite inefficient, while local caching would require immense memory and disk space.
Instead, the Store Gateway knows how to handle the Prometheus storage format. With a smart query planner and caching of only the necessary index parts of the blocks, it has become possible to reduce complex queries to a minimal number of HTTP requests to the object storage files. This can reduce the number of requests by four to six orders of magnitude and achieve response times that are generally indistinguishable from queries to data on a local SSD.
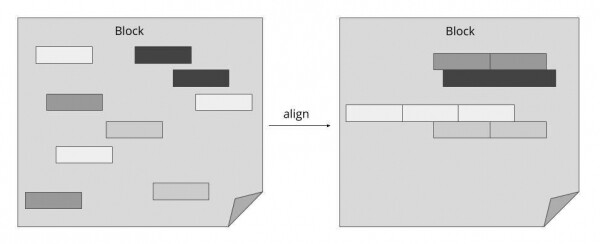
As shown in the diagram above, Thanos Querier significantly reduces the cost of a single data query in object storage by using the Prometheus storage format and placing related data together. By using this approach, we can combine many individual queries into a minimal number of bulk operations.
Compaction and Downsampling
Once a new time series data block is successfully uploaded to object storage, we consider it as 'historical' data, which immediately becomes accessible through the Store Gateway.
However, after some time, blocks from a single source (Prometheus with Sidecar) accumulate and no longer utilize the full potential of indexing. To solve this problem, we introduced another component called Compactor. It simply applies the local Prometheus compaction mechanism to the historical data in object storage and can be run as a simple periodic batch job.
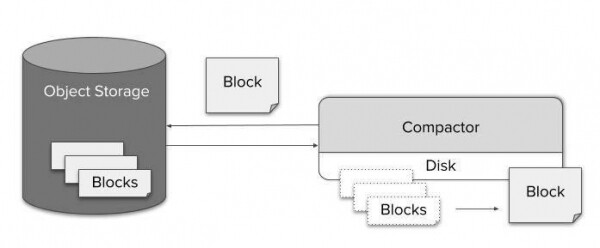
Thanks to effective compression, long-term storage requests pose no issues in terms of data size. However, the potential cost of unpacking a billion values and processing them through the query handler will inevitably lead to a sharp increase in query execution time. On the other hand, as hundreds of data points correspond to each screen pixel, visualizing the data at full resolution becomes impossible. Therefore, downsampling is not only feasible but also does not result in a noticeable loss of accuracy.
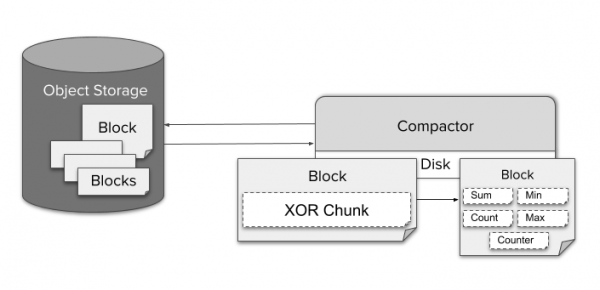
For downsampling data, Compactor continuously aggregates data with a resolution of five minutes and one hour. For each raw fragment encoded using TSDB XOR compression, various types of aggregated data are stored, such as min, max, or sum for a single block. This allows the Querier to automatically choose the aggregate that fits the given PromQL query.
No special configuration is required for users to use the low-precision data. The Querier automatically switches between different resolutions and raw data as the user zooms in and out. If desired, the user can manage this directly via the 'step' parameter in the query.
Since the cost of storing one GB is minimal, Thanos retains the original data, five-minute resolution data, and one-hour resolution data by default. There is no need to delete the original data.
Recording rules
Even with Thanos, recording rules are an essential part of the monitoring stack. They reduce query complexity, latency, and cost. They also provide users with aggregated data on metrics. Thanos is based on vanilla instances of Prometheus, so it is perfectly acceptable to store recording rules and alerting rules on an existing Prometheus server. However, in some cases, this may not be sufficient:
- Global alerts and rules (for example, notifications when a service is down in more than two out of three clusters).
- Rules for data outside the local storage.
- The desire to keep all rules and alerts in one place.
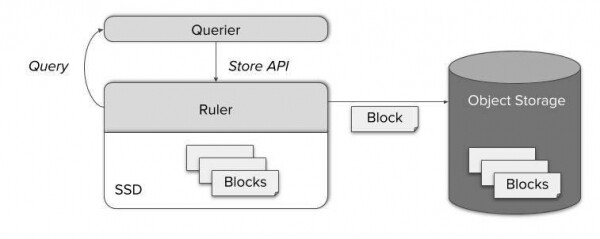
For all these cases, Thanos includes a separate component called Ruler, which computes rules and alerts through Thanos Queries. By providing a well-known StoreAPI, the Query node can access freshly computed metrics. Later, they are also stored in object storage and become available through the Store Gateway.
The Power of Thanos
Thanos is flexible enough to be customized to your needs. This is especially useful when migrating from a simple Prometheus. Let's quickly recall what we've learned about Thanos components with a brief example. Here’s how to transition your vanilla Prometheus into a world of 'unlimited metric storage':
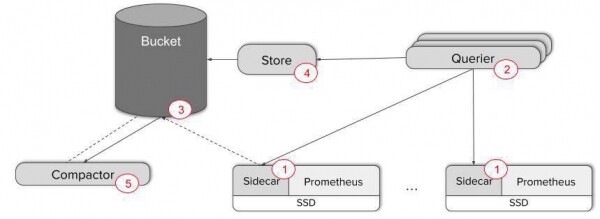
- Add Thanos Sidecar to your Prometheus servers — for instance, as a neighboring container in a Kubernetes pod.
- Deploy multiple replicas of Thanos Querier for data viewing capability. At this stage, it’s easy to set up gossip between Scraper and Querier. To check the interaction of components, use the ‘thanos_cluster_members’ metric.
These two steps are enough to ensure a global view and seamless deduplication of data from potential HA replicas of Prometheus! Just connect your dashboards to the HTTP Querier endpoint or use the Thanos UI interface directly.
However, if you need backup for metrics and long-term storage, you will need to perform three more steps:
- Create an AWS S3 or GCS bucket. Configure Sidecar to copy data to these buckets. You can now minimize local data storage.
- Deploy the Store Gateway and connect it to the existing gossip cluster. Now you can query data in your backups!
- Deploy the Compactor to enhance query efficiency for long time frames, utilizing compaction and downsampling.
If you want to learn more, feel free to check out our and !
In just five steps, we have transformed Prometheus into a reliable monitoring system with a global view, unlimited storage duration, and potential high availability of metrics.
Pull request: we need you!
from the very beginning has been an open-source project. Seamless integration with Prometheus and the ability to use only part of Thanos makes it a great choice for scaling a monitoring system without extra effort.
We always welcome GitHub Pull Requests and Issues. At the same time, feel free to reach out to us through GitHub Issues or Slack., if you have any questions or feedback, or if you want to share your experience with us! If you like what we do at Improbable, don't hesitate to contact us — !
Source: habr.com
