

Kubernetes is a powerful tool for running Docker containers in a clustered production environment. However, there are tasks that Kubernetes cannot handle on its own. With frequent deployments in a live environment, we need a fully automated Blue/Green deployment to avoid downtime during this process, which also requires handling external HTTP requests and managing SSL termination. This necessitates integration with a load balancer like HAProxy. Another task is semi-automated scaling of the Kubernetes cluster when operating in a cloud environment, such as partially reducing the cluster size at night.
Although Kubernetes doesn’t come with these features out of the box, it provides an API that can be leveraged to tackle such tasks. Tools for automated Blue/Green deployment and scaling of Kubernetes clusters have been developed as part of the Cloud RTI project, which was created based on open-source technology.
This article, based on a video transcript, explains how to set up Kubernetes alongside other open-source components to create a production-ready environment that seamlessly accepts code from a git commit without downtime.
Now that you have access to your applications from the outside world, you can proceed with fully setting up automation, bringing it to a stage where you can execute a git commit and ensure that this git commit ends up in production. Naturally, in implementing these steps and during the deployment process, we want to avoid downtime. Hence, any automation in Kubernetes begins with the API.
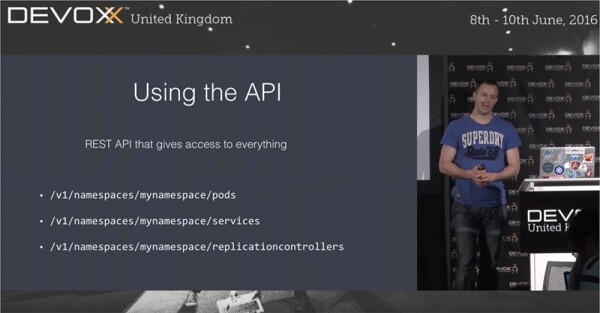
Kubernetes is not a tool that can be used productively right out of the box. Surely, you can do so using kubectl and other tools, but the API is the most interesting and useful aspect of this platform. By using the API as a set of functions, you can access virtually everything you want to do in Kubernetes. Kubectl itself also utilizes the REST API.
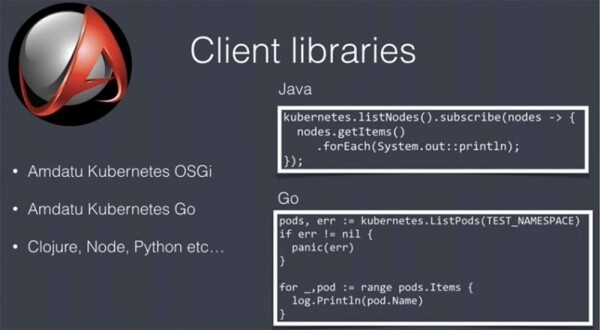
This is REST, so you can use any languages and tools to work with this API, but user libraries will significantly ease your life. My team has written two such libraries: one for Java / OSGi and one for Go. The second one is not used often, but you have these useful tools at your disposal. They are part of a partially licensed open-source project. There are many such libraries for different languages, so you can choose the most suitable ones.
So, before starting the deployment automation, it's essential to ensure that this process will not experience any downtime. For example, our team conducts production deployment in the middle of the day when people are using the applications the most, so it's crucial to avoid delays in this process. To prevent downtime, two methods are used: blue/green deployment or rolling update. In the latter case, if you have 5 replicas of the application running, they are updated sequentially one after the other. This method works great, but it is not suitable if you have different versions of the application running simultaneously during the deployment process. In such a case, you may update the user interface while the backend operates with the old version, causing the application to stop working. Therefore, from a programming perspective, operating under these conditions is quite challenging.
This is one of the reasons we prefer to use blue/green deployment for automating the deployment of our applications. With this method, you need to ensure that only one version of the application is active at any given moment.
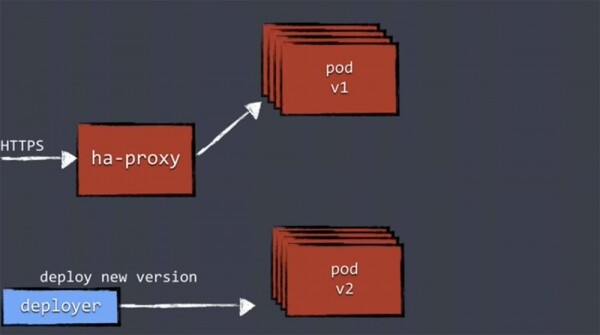
The blue/green deployment mechanism works as follows. We receive traffic for our applications through ha-proxy, which directs it to the running replicas of the application of the same version.
When a new deployment occurs, we use Deployer, which is provided with new components, and it performs the deployment of the new version. Deploying the new version of the application means that a new set of replicas is 'brought up,' after which these replicas of the new version are launched in a separate, new pod. However, ha-proxy is unaware of them and is not directing any workload to them yet.
Therefore, the first step is to perform health checking on the new versions to ensure that the replicas are ready to handle the load.
All deployment components must support some form of health check. This can be as simple as an HTTP check that returns a status code of 200, or a more in-depth check where you verify the replicas' connection to the database and other services, the stability of dynamic environment connections, and whether everything is starting and functioning correctly. This process can be quite complex.
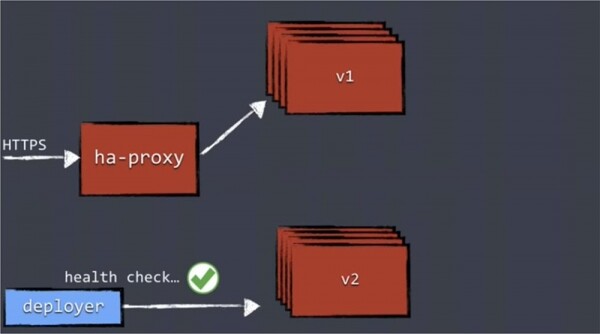
Once the system confirms the operability of all updated replicas, Deployer will update the configuration and pass the correct confd, which will reconfigure ha-proxy.
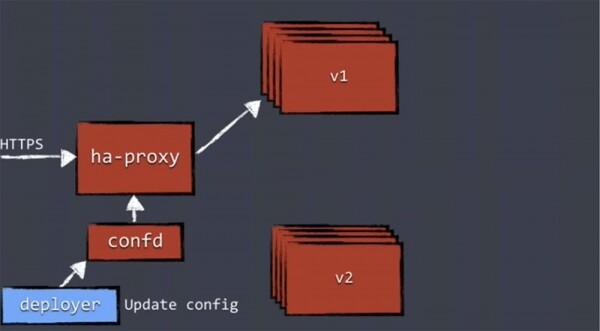
Only after this will traffic be directed to the pod with the replicas of the new version, and the old pod will disappear.
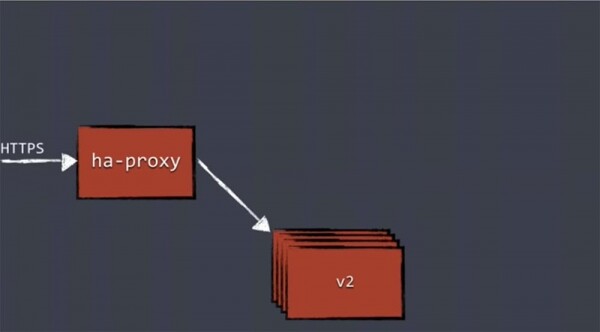
This mechanism is not a feature of Kubernetes. The concept of Blue/green deployment has been around for quite a while, and it has always used a load balancer. First, you direct all traffic to the old version of the application, and after the update, you fully switch it to the new version. This principle is not unique to Kubernetes.
Now I will present to you a new deployment component – Deployer, which performs health checks, reconfigures the proxy, and so on. This is a concept that doesn't pertain to the outside world and exists within Kubernetes. I will show you how to create your own Deployer concept using open-source tools.
The first thing Deployer does is create a replication controller (RC) using the Kubernetes API. This API creates pods and services for further deployment, meaning it establishes a completely new cluster for our applications. Once the RC verifies that the replicas have started, it performs a health check. For this, Deployer uses the command GET /health. This command initiates the corresponding verification components and checks all elements that ensure the cluster's operation.
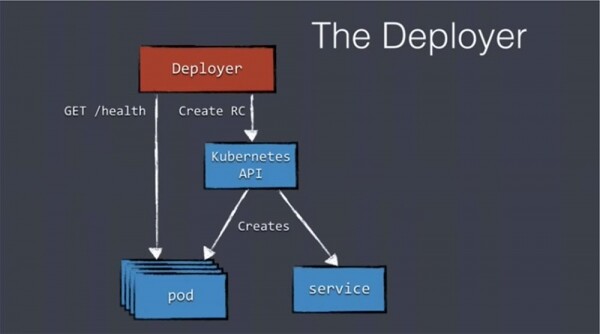
After all pods report their 'health,' Deployer creates a new configuration item—a distributed etcd storage, which is used internally by Kubernetes, including for storing load balancer configuration. We write data to etcd, and a small tool called confd monitors etcd for new data.
If it detects any changes to the initial configuration, it generates a new settings file and passes it to ha-proxy. In this case, ha-proxy reloads without losing any connections and directs traffic to the new services that support the new version of our applications.
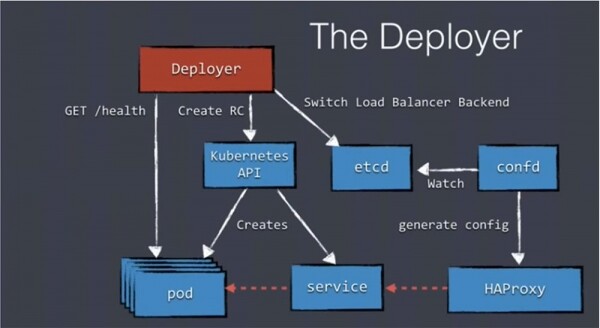
As you can see, despite the abundance of components, there's nothing complex here. You just need to pay more attention to the API and etcd. I want to tell you about the open-source deployer that we use ourselves—Amdatu Kubernetes Deployer.
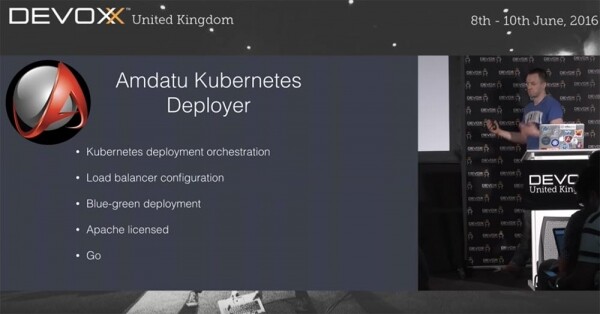
This is a tool for orchestrating Kubernetes deployments, featuring:
- Blue/Green deployment;
- external load balancer configuration;
- management of deployment descriptors;
- management of the actual deployment;
- health checks during deployment;
- injection of environment variables into pods.
This Deployer is built on top of the Kubernetes API and provides a REST API for managing descriptors and deployments, as well as a WebSocket API for streaming logs during deployment.
It places load balancer configuration data in etcd, so you don't have to use ha-proxy with 'out of the box' support, but can easily use your own load balancer configuration file. Amdatu Deployer is written in Go, just like Kubernetes itself, and is licensed under Apache.
Before using this version of the deployer, I utilized the following deployment descriptor, which specifies the parameters I need.
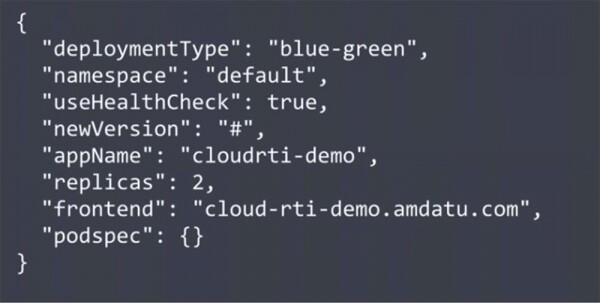
One important parameter of this code is enabling the 'useHealthCheck' flag. We need to specify that a health check must be performed during the deployment process. This parameter can be disabled when third-party containers are used in the deployment that do not need to be checked. This descriptor also specifies the number of replicas and the frontend URL required by ha-proxy. At the end, the pod specification flag 'podspec' is indicated, which refers to Kubernetes for information regarding port configuration, images, etc. This is a fairly simple descriptor in JSON format.
Another tool that is part of the open-source project Amdatu is Deploymentctl. It has a UI for configuring deployments, keeps a history of deployments, and contains webhooks for callbacks from third-party users and developers. You can choose not to use the UI, as the Amdatu Deployer itself is a REST API, but this interface can greatly simplify your deployment without needing to engage any API. Deploymentctl is written in OSGi/Vertx using Angular 2.
Now I will demonstrate the above on screen using a pre-recorded session, so you won't have to wait. We will deploy a simple application in Go. Don't worry if you haven't encountered Go before; this is a very simple application, so you should understand everything.
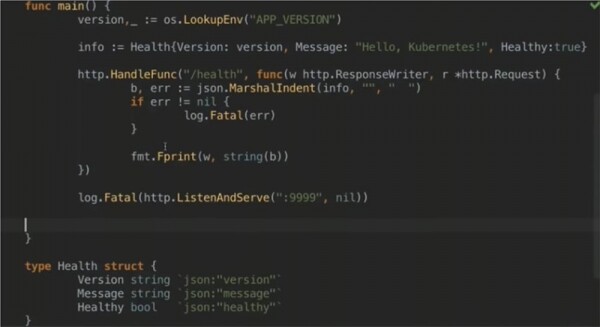
Here we are creating an HTTP server that responds only to /health, so this application only checks the health check and nothing more. If the check passes, the JSON structure shown below is activated. It contains the version of the application that will be deployed by the deployer, a message that you see at the top of the file, and a boolean type indicating whether our application is healthy or not.
With the last line, I was a bit clever because I placed a fixed boolean value at the top of the file, which will help me deploy an 'unhealthy' application later. We will sort this out later.
Let's get started. First, we check for any running pods using the command ~ kubectl get pods and by the absence of a response from the frontend URL, we confirm that no deployments are taking place at the moment.
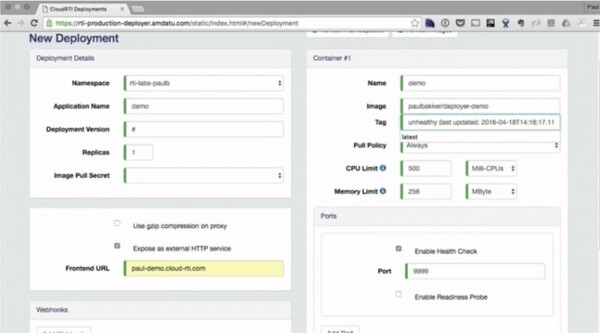
Next, on the screen, you see the Deploymentctl interface that I mentioned, where deployment parameters are set: namespace, application name, deployment version, number of replicas, frontend URL, container name, image, resource limits, health check port number, etc. Resource limits are crucial as they allow utilizing the maximum possible amount of hardware. You can also view the deployment log here.
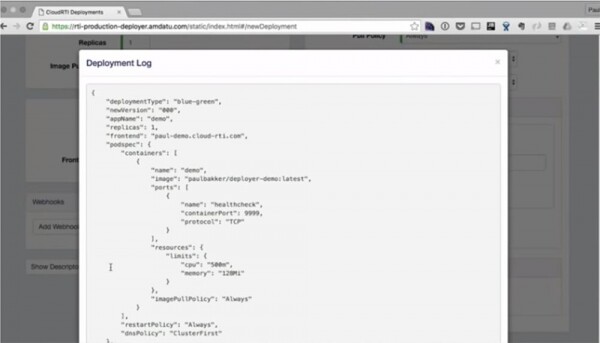
If we now repeat the command ~ kubectl get pods, it shows that the system 'pauses' for 20 seconds, during which the ha-proxy is reconfigured. After that, the pod starts, and we can see our replica in the deployment log.
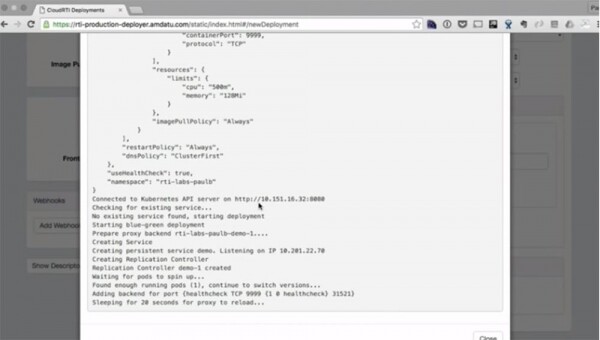
I cut the 20-second waiting time from the video, and now you can see on the screen that the first version of the application has been deployed. All of this was done solely using the UI.
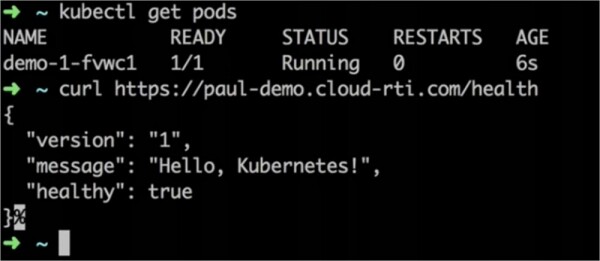
Now let's try the second version. For this, I change the message of the application from 'Hello, Kubernetes!' to 'Hello, Deployer!', the system creates this image and places it in the Docker registry, after which we simply click the 'Deploy' button again in the Deploymentctl window. At this point, the deployment log automatically starts, just as it did during the deployment of the first version of the application.
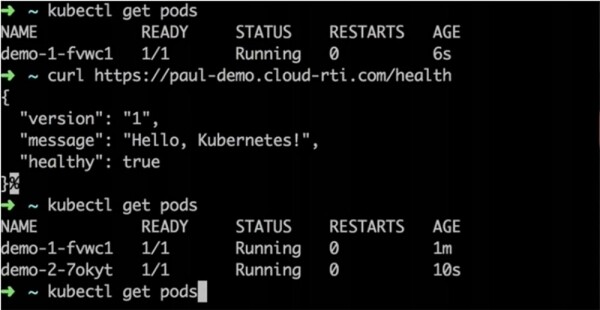
The command ~ kubectl get pods shows that there are currently 2 versions of the application running, however, the frontend indicates that we are still on version 1.
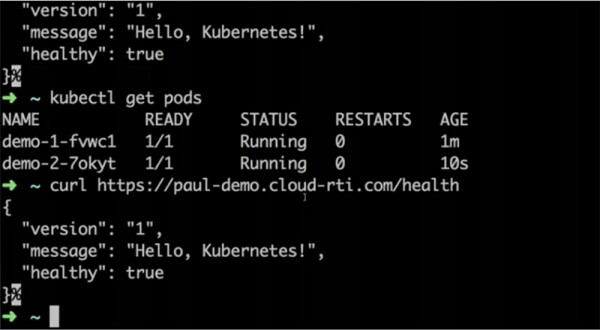
The load balancer waits until the health check is performed, after which it redirects traffic to the new version. After 20 seconds, we switch to curl and see that version 2 of the application is now deployed, and version 1 has been removed.
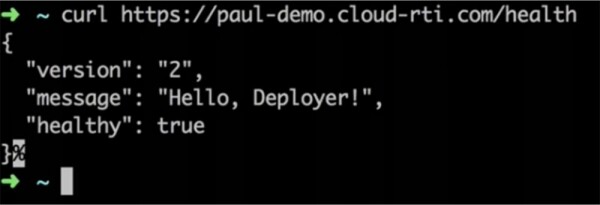
This was a deployment of a 'healthy' application. Let's see what happens if I change the Healthy parameter of the new version of the application from true to false, meaning I try to deploy an unhealthy application that failed the health check. This may happen if there were some configuration errors during development, and it was sent to production in this state.
As you can see, the deployment goes through all the stages mentioned above, and ~ kubectl get pods shows that both pods are running. However, unlike the previous deployment, the log indicates a timeout state. This means that due to the health check failing, the new version of the application cannot be deployed. As a result, you see that the system has reverted to using the old version of the application, and the new version has simply been discarded.
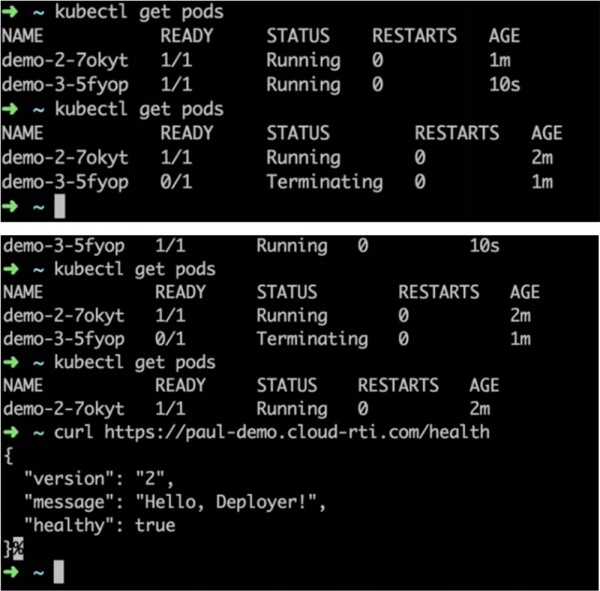
The good thing about this is that even if you have a huge number of simultaneous requests coming into the application, they won't even notice any downtime during the deployment process. If you test this application using the Gatling framework, which sends it the maximum possible number of requests, none of these requests will be dropped. This means that our users won't even notice version updates in real time. If it fails, the operation will continue on the old version; if it succeeds, users will switch to the new version.
There is only one thing that can lead to failure – if the health check passes successfully but the application crashes as soon as it receives the workload. That is, the collapse will occur only after the deployment is complete. In this case, you will have to roll back to the old version manually. So, we have discussed how to use Kubernetes with its intended open-source tools. The deployment process will be much smoother if you integrate these tools into your Build/Deploy pipelines. Additionally, you can use both the user interface and completely automate this process, for example, by using a commit to master.
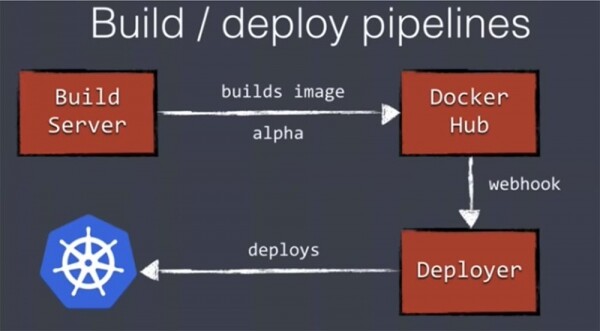
Our Build Server will create a Docker image, push it to Docker Hub, or any other registry you are using. Docker Hub supports webhooks, so we can trigger remote deployment through Deployer by the method shown above. This way, you can fully automate the application deployment to the potential production environment.
Let's move on to the next topic – scaling the Kubernetes cluster. I should note that the kubectl command is a scaling command. With it, you can easily increase the number of replicas in our existing cluster. However, in practice, we usually want to increase the number of nodes, not pods.
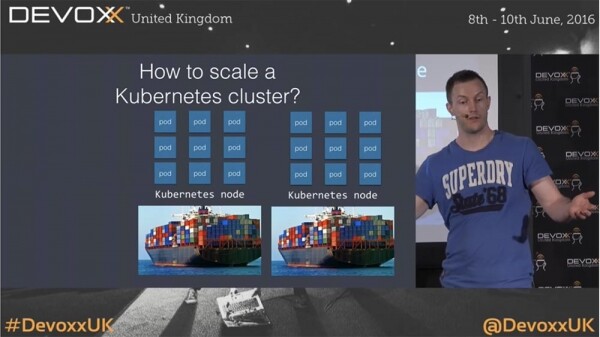
During working hours, you may need to scale up, while at night, to reduce Amazon service costs, you'll want to scale down the number of running application instances. This doesn’t mean that simply scaling the number of pods will suffice, because even if one of the nodes is idle, you'll still have to pay Amazon for it. So, alongside scaling pods, you'll also need to scale the number of machines in use.
This can lead to complications because regardless of whether we are using Amazon or another cloud service, Kubernetes is unaware of the number of machines in operation. It lacks a tool for scaling the system at the node level.
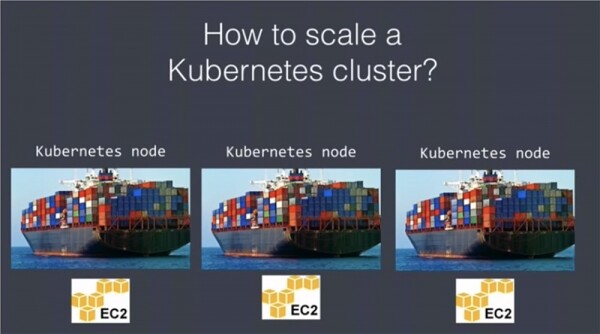
So, we will have to take care of both nodes and pods. We can easily scale the launch of new nodes using the AWS API and the Scaling group to configure the number of worker nodes in Kubernetes. You can also use cloud-init or a similar script to register nodes in the Kubernetes cluster.
A new machine starts in the Scaling group, initiates itself as a node, registers in the master registry, and begins operation. After that, the number of replicas can be increased to utilize the newly formed nodes. Scaling down requires more effort, as it is necessary to ensure that such a step does not lead to the destruction of already running applications after shutting down the 'unnecessary' machines. To prevent this scenario, nodes need to be set to 'unschedulable' status. This means that the default scheduler will ignore these nodes when scheduling DaemonSet pods. The scheduler will not remove anything from these servers but will also not launch any new containers there. The next step is to drain the node, meaning transferring the running pods from it to another machine or other nodes that have sufficient capacity for this task. Once it is confirmed that there are no containers left on these nodes, they can be removed from Kubernetes. After that, they will simply cease to exist for Kubernetes. Next, you need to use the AWS API to disable the unnecessary nodes or machines.
You can use Amdatu Scalerd — another open-source tool for scaling, similar to the AWS API. It provides a CLI for adding or removing nodes in the cluster. An interesting feature is the ability to configure the scheduler using the following JSON file.
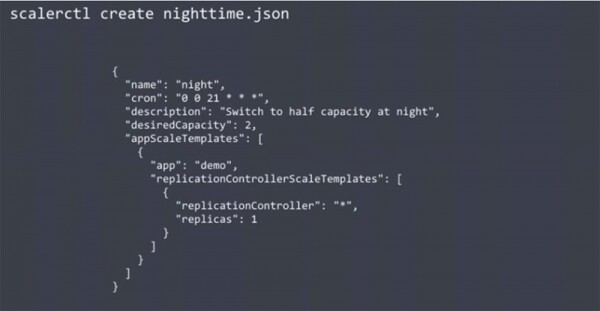
The illustrated code reduces the cluster's capacity by half during nighttime. It specifies both the current number of replicas and the desired capacity of the Amazon cluster. Using this scheduler will automatically decrease the number of nodes at night and increase them in the morning, allowing you to save on the cost of using nodes from cloud services like Amazon. This feature is not built into Kubernetes, but using Scalerd allows you to scale this platform as needed.
I want to draw your attention to the fact that many people tell me: "This is all well and good, but what about my database, which usually remains in a static state?" How can something like this be run in a dynamic environment like Kubernetes? In my opinion, you shouldn't do this; you shouldn't try to organize the functioning of a data store in Kubernetes. Technically, it is possible, and there are guides on this topic online, but it will seriously complicate your life.
Yes, Kubernetes has the concept of persistent storage, and you can try to run data stores like Mongo or MySQL, but it is quite a labor-intensive task. This is because data stores do not fully support interaction with dynamic environments. Most databases require significant configuration, including manual cluster setup, and do not favor auto-scaling and other such things.
Therefore, you shouldn't complicate your life by trying to run a data store in Kubernetes. Organize their functioning in the traditional way using familiar services and simply allow Kubernetes to utilize them.
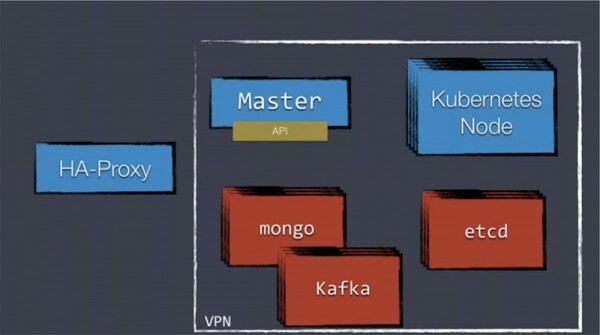
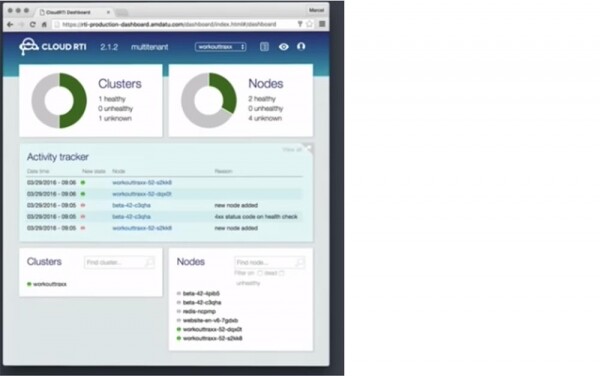
To conclude the topic, I want to introduce you to the Cloud RTI platform based on Kubernetes that my team is working on. It provides centralized logging, application and cluster monitoring, and has many other useful features that you will find valuable. It uses various open-source tools, such as Grafana for monitoring displays.

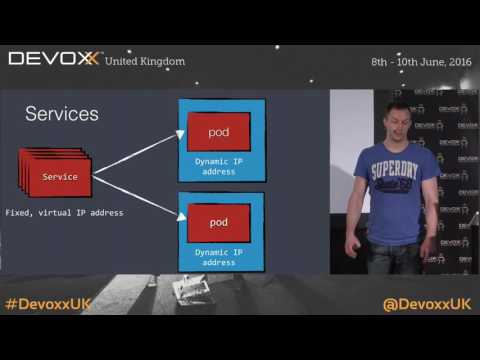
A question arose about why to use a load balancer ha-proxy with Kubernetes. That's a good question because there are currently two levels of load balancing. Kubernetes services are still on virtual IP addresses. You cannot use them for the ports of external host machines because if Amazon overloads its cloud host, the address will change. That's why we place ha-proxy in front of the services—to create a more static structure for uninterrupted traffic interaction with Kubernetes.
Another great question – how can we manage database schema changes during blue/green deployment? The fact is that regardless of using Kubernetes, modifying the database schema is a complex task. You need to ensure compatibility between the old and new schemas before you can update the database and subsequently the applications. You can carry out a 'hot swapping' of the database, and then update the applications. I know people who have loaded an entirely new database cluster with a new schema; that is an option if you have a schemeless database like Mongo, but in any case, it’s not a trivial task. If there are no further questions, thank you for your attention!
A little advertisement 🙂
Thank you for staying with us. Do you enjoy our articles? Want to see more interesting content? Support us by placing an order or recommending us to your friends, , a unique entry-level server alternative that we have created for you: (options available with RAID1 and RAID10, up to 24 cores and up to 40GB DDR4).
Dell R730xd at half the price in the Equinix Tier IV data center in Amsterdam? Only with us in the Netherlands! Dell R420 — 2x E5-2430 2.2GHz 6C 128GB DDR3 2x960GB SSD 1Gbps 100TB — from $99! Read about how
Source: habr.com
