

Transcript of Ilya Kosmodemyansky's 2015 report "Linux tuning to improve PostgreSQL performance"
Disclaimer: I would note that this report is dated from November 2015 — more than 4 years have passed and a lot of time has gone by. The version discussed in the report, 9.4, is no longer supported. Over the past 4 years, 5 new releases of PostgreSQL have been launched along with 15 Linux kernel versions. If we were to rewrite these sections, it would ultimately result in a different report. However, this presentation covers fundamental tuning of Linux for PostgreSQL, which remains relevant today.
My name is Ilya Kosmodemyansky. I work at PostgreSQL-Consulting. I will now share a bit about how to work with Linux as it relates to databases in general and to PostgreSQL in particular, as the principles are quite similar.
What will we talk about? If you interact with PostgreSQL, to some extent, you need to be a UNIX admin. What does this mean? If we compare Oracle and PostgreSQL, in Oracle, you need to be 80% a DBA database administrator and 20% a Linux admin.
With PostgreSQL, it's a bit more complex. You need to have a much better understanding of how Linux works. At the same time, you need to keep up because everything has been updating significantly lately. New kernels are being released, new functionalities are appearing, performance is improving, etc.
Why do we talk about Linux? Not simply because we are at the Linux Piter conference, but because, in modern conditions, one of the most justified operating systems for working with databases in general and PostgreSQL in particular is Linux. Unfortunately, FreeBSD is developing in a very strange direction. This will lead to problems both with performance and many other aspects. The performance of PostgreSQL on Windows is an entirely separate and serious topic, hinging on the fact that Windows lacks shared memory like UNIX does, which is crucial for PostgreSQL because it is a multi-process system.
I think exotic systems like Solaris are of less interest to everyone, so let's move on.
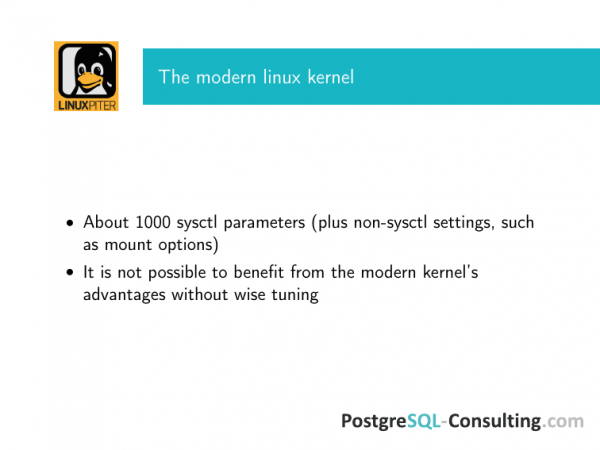
A modern Linux distribution has over 1,000 sysctl parameters, depending on how the kernel is compiled. Moreover, if we look at various tweaks, there are many ways to make adjustments. There are file system parameters, how to mount, and if there are questions about how to start: what to enable in the BIOS, how to configure the hardware, etc.
This is a very large volume that could be discussed for several days rather than in a short presentation, but I will now focus on important points about how to avoid pitfalls that will guarantee you won't effectively utilize a database on Linux if you don't address them. Furthermore, an important aspect is that many default parameters are not set in a way that is correct for the database. That is, it will perform poorly or may not work at all by default.
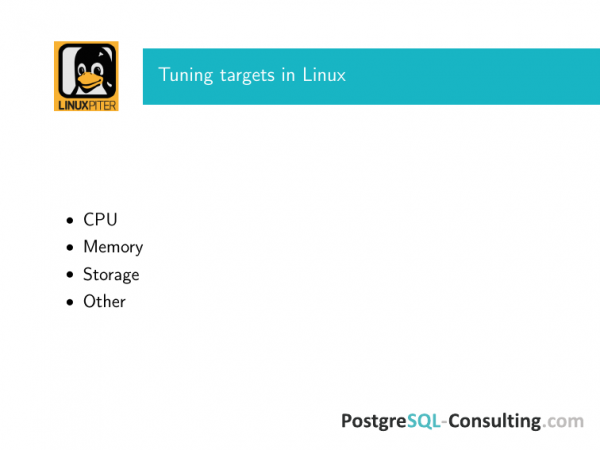
What traditional tuning targets exist in Linux? I think since you all deal with Linux administration, there is no need to explain what targets are in detail.
You can tune:
- CPU.
- Memory.
- Storage.
- Other. We will discuss this at the end as a bonus. Even parameters such as power-saving policies can unpredictably and unpleasantly impact performance.
What are the specifics of PostgreSQL and databases in general? The problem is that you cannot just tune a single knob and expect to see significant performance improvements.
Yes, there are such knobs, but a database is a complex entity. It interacts with all the resources available on the server and prefers to engage them fully. If you look at the modern recommendations from Oracle on how to use the host OS, it resembles a joke about a Mongolian cosmonaut – feed the dog and don’t touch anything. Give the database all the resources, and it will manage itself.
In principle, the situation with PostgreSQL is very similar. The difference is that the database does not have the capability to reclaim all resources by itself, meaning some of it needs to be managed at the Linux level.
The main idea is not to select a single target and start tuning it, such as memory, CPU, or something similar, but to analyze the workload and try to maximize throughput, so that the load created by our diligent programmers, including our users, flows through our database as efficiently as possible.
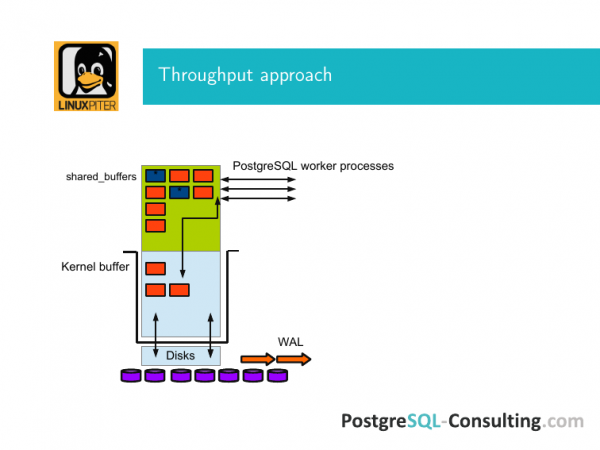
This is an illustration to explain what it is. There is a Linux OS buffer, shared memory, and shared buffers of PostgreSQL. Unlike Oracle, PostgreSQL operates directly through the kernel buffer, meaning for a page to go from disk to its shared memory, it must pass through the kernel buffer, and the same goes in reverse.
Beneath this system reside the disks. I've depicted them as disks. In reality, there can be a RAID controller, etc.
And this input-output takes place through this apparatus one way or another.
PostgreSQL is a classic database. It works internally with pages. All input-output occurs via pages. We raise blocks into memory using pages. If nothing has happened and we have only read them, they gradually fade from this cache and shared buffers and go back to the disk.
If we replaced something somewhere, the entire page is marked as dirty. I've noted them in blue here. This means that the page needs to be synchronized with the block storage. When we made it dirty, we recorded it in the WAL. At some point, an event called a checkpoint occurs, and information about this is logged. This means that all the dirty pages that were in the shared buffers at that moment were synchronized with the disk storage using fsync through the kernel buffer.
Why is this done? If we experience a power loss, we don't end up with a situation where all data is lost. Persistent memory, which we've all been told about, is still theoretical in database terms – it is a bright future that we are striving for and we like, but for now, they still date back 20 years. And, of course, all of this needs to be monitored.
The goal of maximizing throughput is to tune all these stages so that everything moves back and forth quickly. Shared memory is mainly page cache. In PostgreSQL, when we send a select query, it retrieves the data from the disk. They go into shared buffers. Therefore, to improve this, there should be a lot of memory.
For everything to work well and quickly, you need to configure the operating system correctly at all stages. You should also choose balanced hardware, because if there's any imbalance, you might have a lot of memory, but it will be serviced at an insufficient speed.
Let's go through each of these points.

To ensure that these pages travel back and forth faster, you need to achieve the following:
- First, you need to work with memory more efficiently.
- Secondly, the transition when pages move from memory to disk needs to be more efficient.
- And thirdly, you should have good disks.
If you have 512 GB of RAM in server and all this finally goes to a SATA hard disk without any caching, then the entire database server will not just become inadequate, but will turn into something that operates as if it has a SATA interface. You will be directly limited by this, and nothing will save you.
Regarding the first point about memory, there are three things that can significantly complicate your life.
The first is NUMA. NUMA is designed to improve performance. Depending on the workload, different things can be optimized. In its current form, it's not very suitable for applications like databases that heavily use page cache and shared buffers.
In short, how can you tell if something is wrong with NUMA? You might encounter an annoying jolt, and suddenly one CPU seems overloaded. In this case, you analyze queries in PostgreSQL and see that there’s nothing particularly intensive there. These queries shouldn’t be consuming CPU so aggressively. It can take a long time to catch this. It's easier to start with the correct recommendation on how to configure NUMA for PostgreSQL from the beginning.
What is actually happening? NUMA stands for Non-Uniform Memory Access. What does this mean? You have a CPU, and next to it is its local memory. This interconnect can pull memory from other CPUs.
If you run numactl --hardware, it will output a large report. Among other things, there will be a field for distances. You will see numbers – 10-20, something like that. These numbers indicate the number of hops to access that remote memory and use it locally. In principle, this is a good idea. It accelerates performance under certain loads.
Now imagine that one CPU first tries to use its local memory and then attempts to pull in other memory via interconnect for something. And all your PostgreSQL page cache ends up on this CPU—whatever gigabytes that may be. You always end up in the worst-case scenario because there is usually little memory directly available to the CPU in this memory module. All the memory being served has to go through these interconnects. It becomes slow and unfortunate. And you have a processor servicing this node that is constantly overloaded. The access time for this memory is poor and slow. This is the situation you want to avoid if you are using it for a database.
Therefore, a more appropriate solution for a database is for the Linux operating system to not know at all what is happening there. So that it accesses memory as it does.
Why is that? It would seem that it should be the other way around. This happens for one simple reason: we need a lot of memory for page cache—tens or hundreds of gigabytes.
If we allocate all this and cache our data there, the benefit of using the cache will be significantly greater than the advantage of that clever memory access. Thus, we will gain immensely compared to being more efficient in memory access using NUMA.
So there are currently two approaches until a bright future arrives when the database can figure out on which CPUs it operates and where it needs to pull something from.
Therefore, the correct approach is to disable NUMA altogether., for instance, during a reboot. In most cases, the gains are such that there is no question about which is better.
There is another option. We use it more often than the first because when a support client approaches us, rebooting the server is a big deal for them. Their business is running there. They experience issues due to NUMA. Therefore, we try to disable it in less invasive ways than rebooting, but here you need to check carefully to ensure it has been disabled. Because, as experience shows, disabling NUMA on the parent PostgreSQL process is good, but it is absolutely not guaranteed that it will work. You need to verify and see that it has truly been turned off.
There is a good post by Robert Haas. He is one of the committers of PostgreSQL, a key developer of all the low-level details. If you follow the links in this post, several colorful stories describe how NUMA complications affected people’s lives. Take a look and study the sysadmin checklist of what needs to be configured on the server for our database to perform well. These settings must be noted and verified; otherwise, things may not go well.
I want to emphasize that this applies to all settings I will discuss. Typically, databases are set up in a master-slave configuration for fault tolerance. Don’t forget to apply these settings to the slave, because at some point, you may experience a failure, switch to the slave, and it will become the master.
In an emergency situation, when everything is in disarray, your phone will be ringing constantly, and your boss will rush in with a big stick; you won’t have time to think about checking it. The results can be quite disappointing.

The next point is huge pages. Huge pages are difficult to test in isolation, and it’s not particularly useful to do so, although there are benchmarks that can handle this. They can be easily found online.
What’s the point? You have a relatively inexpensive server with a lot of RAM, for example, over 30 GB. You are not using huge pages. This means you definitely have overhead in memory usage, and that overhead is far from pleasant.
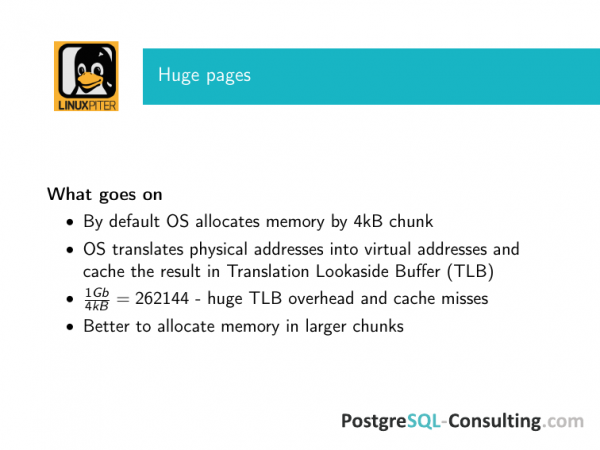
Why is this? What happens? The operating system allocates memory in small pieces. It’s convenient and has historically been done this way. Delving into the details, the OS has to translate virtual addresses into physical ones. This is not a simple process, so the OS caches the result of this operation in the Translation Lookaside Buffer (TLB).
And since TLB is a cache, all the inherent cache problems occur in this situation. First, if you have a lot of RAM and it is all allocated in small chunks, this buffer becomes quite large. If the cache is large, searching through it becomes slower. There is significant overhead, and it consumes space, meaning RAM is taken up by something inefficient. That’s one issue.
Two – the larger the cache grows in such a situation, the greater the likelihood of experiencing cache misses. The effectiveness of this cache drops sharply as its size increases. Therefore, operating systems have come up with a simple approach. Linux has been using it for a long time. FreeBSD recently adopted it. But we are talking about Linux. This is huge pages.
It's worth noting that huge pages, as an idea, were originally pushed forward by communities that included Oracle and IBM, meaning that database producers were carefully considering its usefulness, including for databases.

So how do we integrate this with PostgreSQL? Firstly, huge pages must be enabled in the Linux kernel.
Secondly, they must be explicitly specified using the sysctl parameter – how many should be allocated. The numbers here come from some old server. You can estimate how many shared buffers you have to ensure that huge pages fit into them.
If your entire server is dedicated to PostgreSQL, a good starting point is to allocate either 25% of the RAM for shared buffers, or 75% if you're confident that your database will fit into the 75%. This is the first starting point. If you have 256 GB of RAM, then, accordingly, you will have 64 GB for shared buffers. Make sure to calculate with some headroom – determine what this number should be set to.
Before version 9.2 (if I'm not mistaken, since version 8.2), you could use a third-party library to integrate PostgreSQL with huge pages. This is always necessary to do. Firstly, you need the kernel to allocate huge pages correctly. Secondly, the application working with them must be able to take advantage of them. It won't do so by itself. Since PostgreSQL allocated memory in the style of System V, you could achieve this using libhugetlbfs — that's the full name of the library.
In version 9.3, PostgreSQL's performance regarding memory management improved, and the system 5 memory allocation method was abandoned. Everyone was quite pleased because otherwise, when trying to run two PostgreSQL instances on the same machine, it would complain about insufficient shared memory and suggest adjusting sysctl settings. However, those sysctl settings often require a reboot. Overall, the change was well-received. Nevertheless, the mmap memory allocation broke the use of huge pages. Most of our clients utilize large shared buffers, and we strongly advised against upgrading to 9.3 due to the overhead, which began to incur substantial percentages.
However, the community paid attention to this issue, and in version 9.4, they significantly revamped this process. A parameter was introduced in postgresql.conf that allows you to enable try, on, or off.
Try is the safest option. Upon startup, PostgreSQL attempts to allocate shared memory from huge pages. If it fails, it reverts to standard allocation. If you're using FreeBSD or Solaris, setting it to try is always safe.
If set to on, PostgreSQL simply won't start if it cannot allocate from huge pages. It comes down to personal preference. But if you choose try, ensure that the necessary memory allocation is indeed achieved because there is plenty of room for error. Currently, this functionality only works on Linux.
Another small note before we proceed: Transparent huge pages are not yet relevant for PostgreSQL. It cannot fully utilize them under normal circumstances. For workloads requiring large chunks of shared memory, the advantages of Transparent huge pages appear only with very large volumes. If you have terabytes of memory, then it might matter. In more common scenarios, such as with 32, 64, 128, or 256 GB of memory on a machine, traditional huge pages are fine, while Transparent huge pages should just be disabled.

Lastly, one memory-related aspect that isn't directly tied to throughput can significantly disrupt performance. Overall bandwidth will suffer greatly if the server is constantly swapping.
And this will be quite unpleasant at various moments. The main issue is that modern kernels behave slightly differently from older Linux kernels. This is something that is quite troublesome because when we talk about working with swap, it often leads to the untimely arrival of the OOM-killer. And an OOM-killer that arrives too late and terminates PostgreSQL is unpleasant. Everyone will know about it, i.e., up to the last user.
What’s happening? You have a large amount of RAM, everything is working fine. But for some reason, the server hangs in swap and slows down because of it. It seems there’s plenty of memory, but this happens.
Previously, we recommended setting vm.swappiness to zero, i.e., turning off swap. It seemed that 32 GB of RAM and the corresponding shared buffers were a massive amount. The main purpose of swap is to have a place to throw the kernel if we get unresponsive. However, it no longer served this purpose effectively. And what will you do with that kernel afterward? It becomes a task where it’s unclear what the point of having such a large swap is.
But in more modern kernels, i.e., in the third versions, the behavior has changed. If you set swap to zero, i.e., turn it off, eventually, even with a certain amount of RAM left, the OOM-killer will come to terminate the most intensive consumers. Because it will calculate that with this workload, we have a little left and will run out, i.e., it won’t kill a system process but something less important. This less important process will turn out to be the intensive consumer of shared memory, namely the postmaster. After that, you will be lucky if you don’t have to restore the database.
Therefore, as far as I remember, the default in most distributions is now around 6, i.e., at what point to start using swap depending on how much memory is left. We now advise setting vm.swappiness = 1 because it practically disables it but avoids situations like having the OOM-killer arrive unexpectedly and terminating everything.
What's next? When we talk about database performance and gradually move towards disks, everyone starts to panic. This is because the truth that disks are slow and memory is fast is known to all from childhood. And everyone knows that there will be issues with disk performance in databases.
The main performance issue with PostgreSQL related to checkpoint spikes does not arise from slow disks. Instead, it stems from an imbalance between memory and disk throughput. This imbalance can occur in various aspects. PostgreSQL may not be configured properly, the OS may not be set up correctly, and the hardware might be inadequate. This problem only does not occur when everything functions as it should, i.e., either there is no load or the configurations and hardware are well matched.
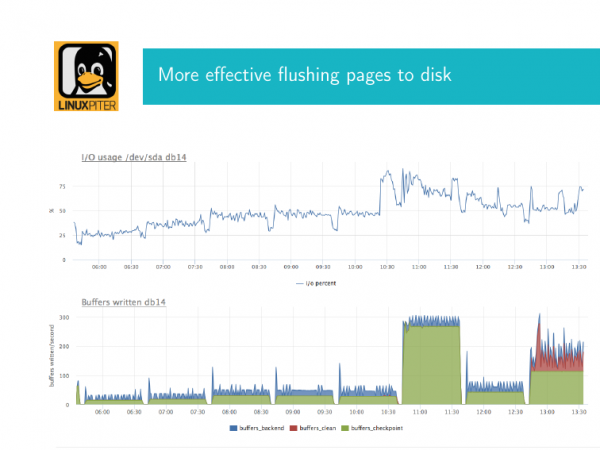
What is it and what does it look like? Generally, people who work with PostgreSQL have encountered this situation multiple times. Let me explain. As I mentioned, PostgreSQL periodically performs checkpoints to dump dirty pages in shared memory to disk. If we have a large amount of shared memory, then the checkpoint starts to heavily impact the disk because it dumps these pages using fsync. It reaches the kernel buffer and is written to the disks via fsync. And if the volume of this process is substantial, we can observe an unpleasant effect, namely a very high disk utilization.
Here I have two images. I will explain what they are. These are two correlated-time graphs. The first graph shows disk utilization. Here it reaches nearly 90% at that moment. If your database experiences this with physical disks and a RAID controller at close to 90% utilization, that's bad news. It means that very soon it will hit 100%, and the input/output will stop.
If you have a disk array, then the story is a bit different. It depends on how it is configured, what kind of array it is, etc.
At the same time, a chart from the internal PostgreSQL view has been configured here, showing how checkpoints occur. The green color indicates the number of dirty pages that arrived for synchronization at this checkpoint. This is the main point to understand. We see that many pages arrived, and at one point, we hit a bottleneck, meaning that the disk system is very busy. Our checkpoints have a significant impact on the disk. Ideally, the situation should look more like this, meaning we should have less writing happening. We can fix this with configurations to maintain a better balance. In other words, utilization is low, but we are writing something here.
What should be done to overcome this problem? If IO under the database has stopped, it means that all users executing their requests will be waiting.
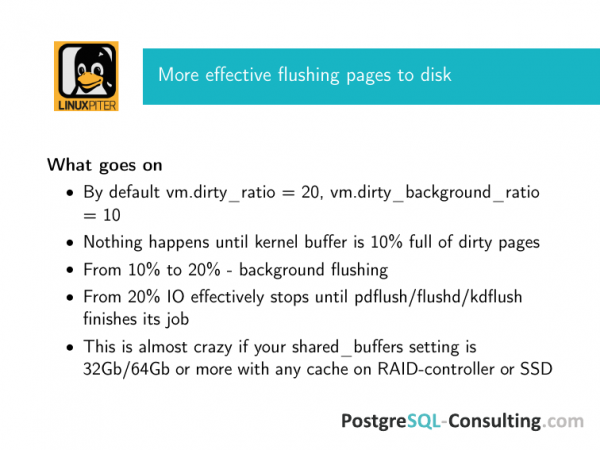
From a Linux perspective, if you have good hardware, configured it properly, and set PostgreSQL to perform checkpoints less frequently, spreading them over time, you are likely to fall back on the default Debian parameters. For most Linux distributions, the following parameters are used: vm.dirty_ratio=20, vm.dirty_background_ratio=10.
What does this mean? Starting from kernel 2.6, a flushing daemon appeared. Pdglush, depending on the specific use, handles the background flushing of dirty pages from the kernel buffer, triggered when it is necessary to flush dirty pages regardless of conditions when background flushing is no longer effective.
When does background flushing occur? When 10% of the total RAM on the server is occupied by dirty pages in the kernel buffer, a special background flushing function is invoked. Why is it called background? It takes the number of pages to flush as a parameter. For example, it flushes N pages. For a period, this function sleeps and then wakes up to flush another set of pages.
This is a very simple story. It's like a swimming pool where water flows in through one pipe and out through another. When a checkpoint occurs and it sends a small number of dirty pages for flushing, the pgflush will gradually handle the rest from the kernel buffer.
If these dirty pages continue to accumulate, they can reach up to 20%. After that, the OS prioritizes writing this data to disk because if the power fails, we will face serious issues. We could lose this data, for instance.
What's the trick? The trick is that these parameters representing 20% and 10% of the total RAM in the machine are utterly colossal in terms of the throughput of any disk system you have.
Imagine you have 128 GB of RAM. Out of that, 12.8 GB are reaching your disk system. Regardless of the cache or storage array you have in place, they won't handle that much.

Therefore, we recommend configuring these figures based on the capabilities of your RAID controller. Here I provide a recommendation for a controller with 512 MB of cache.
Everything is calculated very simply. You can set vm.dirty_background in bytes. These settings override the previous two. Either the default ratio or the ones activated by bytes will work. But since I am a DBA consultant and work with different clients, I prefer a cautious approach. So if it’s in bytes, then stick to bytes. No one guarantees that a well-meaning admin won't add memory to the server, restart it, and the number will remain the same. Just calculate these numbers to ensure everything fits properly.
What happens if you don't make it? It is stated that any flushing effectively stops, but in reality, this is a figure of speech. The operating system has a big problem—it has many dirty pages, thus the IO generated by your clients is effectively stopped. For example, when an SQL query from an application is sent to the database, it waits. Any input/output operations to it are at the very lowest priority because the database is busy with a checkpoint. And it’s unclear when it will finish. When you reach a non-background flushing state, it means all your IO is occupied with that. And until it completes, you can’t do anything.
There are also two important points that go beyond this report. These settings should match the configurations in postgresql.conf, specifically the checkpoint settings. Additionally, your disk system must be adequately configured. If you have a cache on RAID, it should have a battery. People buy RAID with good cache without a battery. If you have SSD in RAID, they must be server-grade, and there should be capacitors. Here is a detailed checklist. My report on how to configure disk performance in PostgreSQL can be found at this link. It includes all these checklists.
What else can complicate life significantly? There are two parameters. They are relatively new. They can be enabled by default in various applications. And they can complicate things just as much if they are incorrectly enabled.
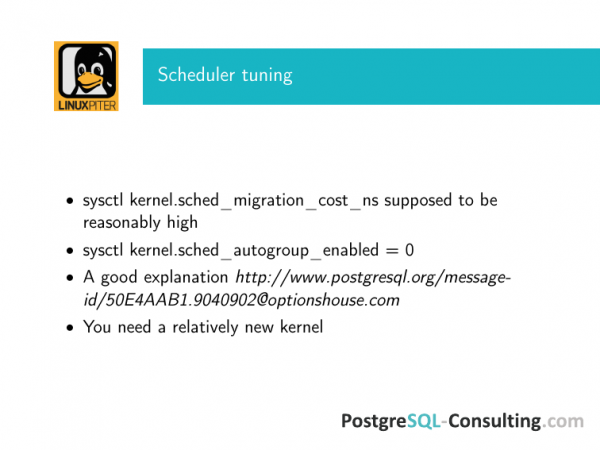
There are two relatively new features. They have already appeared in the third kernels. These are sched_migration_cost in nanoseconds and sched_autogroup_enabled, which is set to one by default.
And how do they mess things up? What is sched_migration_cost? The Linux scheduler can migrate a process from one CPU to another. For PostgreSQL, which processes queries, migrating to another CPU makes no sense. From the operating system's perspective, switching windows between OpenOffice and terminal may be fine, but for the database – it's very bad. Therefore, a reasonable policy is to set migration_cost to a large value, at least several thousand nanoseconds.
What does this mean for the scheduler? It will consider that for this duration the process is still hot. That is, if you have a long transaction doing something, the scheduler will understand it. It will think that until this timeout passes, there is no need to migrate this process anywhere. If the process is doing something, it will not be migrated anywhere, and it will finish on the CPU allocated to it. The result is excellent.
The second point is autogroup. There is a good idea for specific workloads that have nothing to do with modern databases – to group processes by the virtual terminal from which they were launched. This is convenient for certain tasks. In practice, PostgreSQL is a multi-process system with preforking that runs from a single terminal. You have a lock writer, a checkpoint, and all your client requests will be grouped on one scheduler, one CPU. They will wait there together for it to become free, which can cause them to interfere with each other and occupy it longer. This situation is completely unnecessary under such a load and should therefore be disabled.
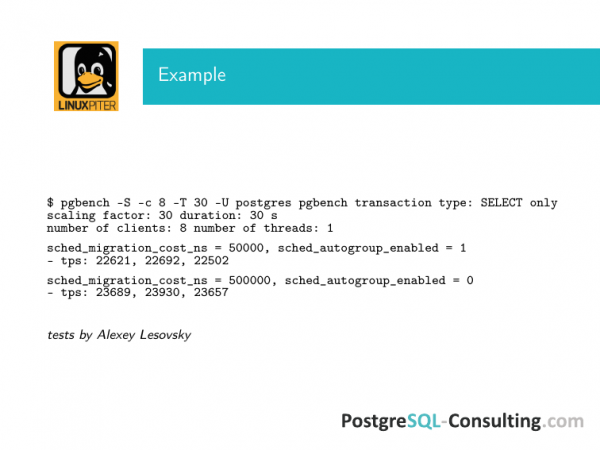
My colleague Alexey Lesovsky conducted tests with a simple pgbench, where he increased the migration_cost by an order of magnitude and disabled autogroup. The difference on poor hardware was almost 10%.There is a discussion in the PostgreSQL mailing list where people provide results on how similar changes affected query speed. This affected 50%.There are quite a few such stories.
And finally, about power saving policy. It's good that Linux can now be used on laptops. It supposedly manages battery consumption well. But it turns out that this can happen on servers too.
Moreover, if you rent servers from some hosting provider, the 'kind' ones hosts don't care about your performance needs. Their goal is to make sure their hardware is utilized as efficiently as possible. Therefore, by default, they might enable battery-saving mode in the operating system.
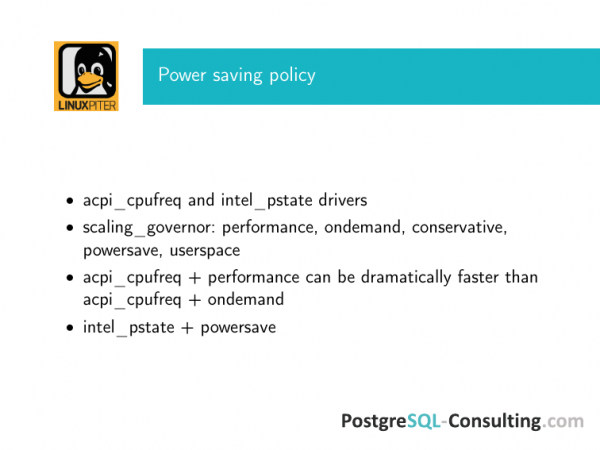
If you're running a database server under heavy load, your choice should be acpi_cpufreq + performance. Even with ondemand, you will encounter problems.
Intel_pstate is a slightly different driver. Currently, preference is given to this one as it is newer and works better.
Thus, the governor should only be set to performance. Ondemand, powersave, and everything else is not for you.
The results from explain analyze in PostgreSQL can vary by orders of magnitude if you enable powersave, as your CPU will be scheduled in a completely unpredictable manner under the database.
These settings may be enabled by default. Be sure to check if they have been enabled by default, as it can be a significant issue.

In conclusion, I want to thank the guys from our DBA team at PosgreSQL-Consulting, specifically Max Boguk and Alexey Lesovsky, who face challenges every day in this work. We strive to make everything work as well as possible for our clients. It's like the instructions for aviation safety. Everything is written in blood. Each of these issues has been found during some problem-solving process. I am happy to share them with you.
Questions:
Thank you! For example, if a company wants to save costs and host the database and application logic on a single server, or if the company is following the trendy microservices architecture where PostgreSQL runs in a container. What's the catch? Sysctl affects the entire kernel globally. I haven't heard of sysctl being virtualized in any way to work independently in a container. There's only cgroup for limited control. How can one manage this? Or if you want performance, should you run PostgreSQL on a dedicated physical server and optimize it?
We answered your question in about three ways. If it’s not a physical server that can be tuned, then relax, everything will work fine without those settings. If you experience so much load that those adjustments become necessary, you’ll find yourself moving to a physical server sooner than you reach those settings.
What's the problem? If it's a virtual machine, you’ll likely encounter many issues, such as inconsistent disk latency on most virtual machines. Even with good disk throughput, a single failed I/O transaction—insignificant to average throughput—which happens during a checkpoint or while writing to WAL can significantly impact the database. You will notice this before you run into those problems.
If you have NGINX on the same server, the same issue will arise. It will compete for shared memory. You'll encounter the problems described here before you know it.
On the other hand, some of these parameters will still be relevant to you. For example, setting the dirty_ratio with sysctl to avoid excessive values – in any case, this will help. You will interact with the disk anyway. And it will be done incorrectly. Those parameters I showed are the default settings. It’s best to change them in any case.
There can be issues with NUMA. VmWare, for example, works well with NUMA with exactly opposite settings. Here you need to choose – whether it's a physical server or not.
I have a question related to Amazon AWS. They have preconfigured images. One of them is called Amazon RDS. Are there any custom settings for their operating system?
There are settings, but they are different. Here we configure the operating system in terms of how the database will utilize it. There are parameters that determine our direction at the moment, such as shaping. That is, we need certain resources, and we will be consuming them right now. After that, Amazon RDS allocates these resources, which causes performance to drop. There are separate stories about how people start experimenting with this, sometimes quite successfully. But it doesn't relate to OS settings. This is more like cloud hacking. That’s a different story.
Why do Transparent Huge Pages not have the same effect compared to Huge TLB?
They don't. This can be explained in many ways. But factually, they simply do not provide the effect. What’s the story with PostgreSQL? At startup, it allocates a large chunk of shared memory. Whether it’s Transparent or not – it doesn’t matter. The fact that they are allocated at startup explains everything. If there is a lot of memory and the shared_memory segment needs to be restructured, then Transparent Huge Pages will be relevant. With PostgreSQL, it is allocated as a large chunk right at the start, and nothing particularly special happens thereafter. Of course, you can use it, but there’s a chance of shared_memory corruption when it reallocates something. PostgreSQL does not know about this.
Source: habr.com
