

Two years ago, I already made a post about . Now there is some development of the project, and I have also published under , so I decided to write this brief overview on Habr.
[ ]
Who might be interested in this
This may interest you if you work in a small team or even alone. You don't have monitoring and are unsure if it's necessary. Or, you've tried some popular serious monitoring tools 'for big boys', but they didn't really work for you, or they operate in almost default modes and haven't significantly changed your life. Also, if you definitely don't plan to allocate a whole employee (or even a department) to monitor the monitoring dashboard for at least a couple of hours a day or to configure it.
What is unique about okerr
Next, I will show interesting features of okerr that distinguish it from some other monitoring tools.
Okerr is a hybrid monitoring solution
With internal monitoring, an 'agent' runs on the monitored machines that sends data to the monitoring server (e.g., free disk space). With external monitoring, the server performs checks over the network (e.g., ping or website availability). Each approach has its limitations. Okerr uses both methods. Checks inside servers are performed by a very lightweight (30Kb) agent or your own scripts and applications, and network checks are conducted through okerr sensors located in various countries.
okerr is not just software, but also a service
The server part of any monitoring is large and complex; it's hard to install and configure, and it requires resources. With okerr, you can set up your own monitoring server (which is free and open-source), or you can just use the client part and utilize our server service. It’s also free.
If monitoring helps to compensate for the lack of reliability in servers and applications, it raises a philosophical question – who guards the guardian? How can monitoring alert us to a problem if it has 'failed' for some reason, separately or together with other resources (for example, if the connection to the data center goes down)? By using the external service okerr, this problem is resolved – you will receive an alert even if the entire data center with your servers is powered down or subjected to a zombie attack.
Of course, there is a risk that the okerr server itself will be unavailable, that’s true (as it is known, achieving 90% reliability is often simple and 'free', 99% requires minimal effort, and each subsequent percentage is exponentially harder). But, firstly, the chances of this happening are lower, and secondly, a problem may go unnoticed only if it coincides in time with issues on our servers. If we have a reliability of 99.9%, and you have 99.9% (which are not particularly high figures), then the chance of an unnoticed failure is 0.1% of 0.1% = 0.0001%. Adding three nines to reliability with almost no effort and no costs is quite a good deal!
Another advantage of monitoring as a service is that a hosting provider or web studio can set up an okerr server for themselves and provide access to clients as a paid or free additional service. Your competitors only offer hosting and websites – but you provide reliable hosting with monitoring.
Okerr is about indicators
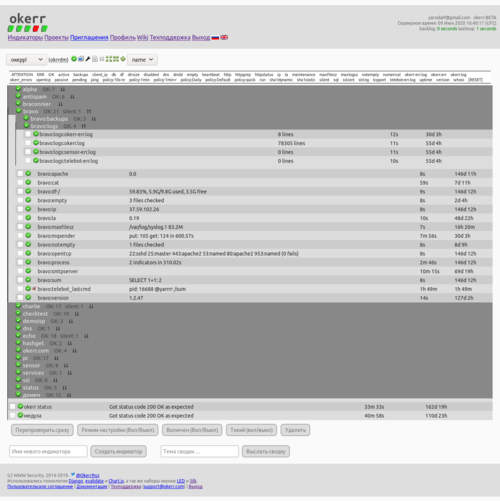
An indicator is a 'light'. It has two main states – green (OK) or red (ERR). In the project, there are numerous grouped indicators (for example, by servers). On the main project page, you can immediately see if everything is green (and can be closed) or if something is glowing red and needs to be fixed. When transitioning between these states, a notification is sent. Once a day, while you set it up, a summary of the project is sent.
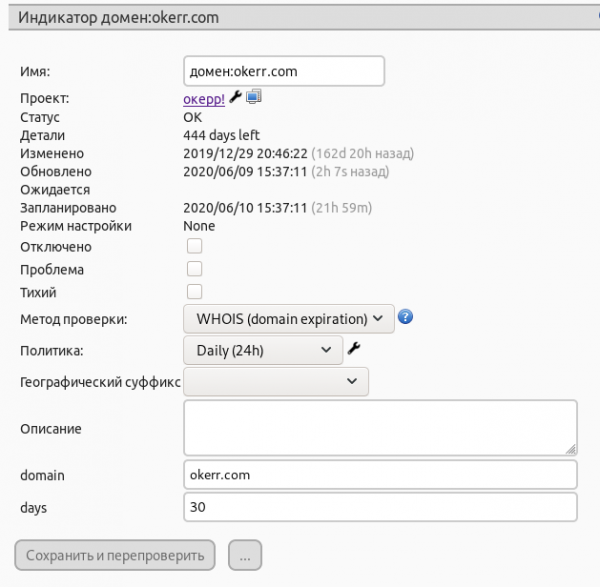
Each okerr indicator has built-in conditions under which it changes its state (in Zabbix, this is called a trigger). For example, the load average should not exceed 2 (of course, this is configurable). And for each internal check (load average, disk free, …) – there is a watchdog. If for some reason we do not receive successful confirmation in the designated time, an error is recorded and an alert is sent.
Our usual workflow involves a morning email check, during which we review the summary (we schedule it for the start of work). If everything is okay in it, we attend to other important matters (though we can quickly check the okerr dashboard for reassurance, ensuring everything is green at that moment). When an alert comes in, we respond.
Of course, it's possible to just keep 'informational' indicators (to see the network picture from monitoring), but everything is designed to easily, quickly, and conveniently create indicators specifically for automated monitoring and alert dispatch.
The purpose of setting up okerr lies in the alerts, allowing you to create an indicator in a minute. It may have been 'asleep' for a year, merely receiving updates, and when something breaks after a year, it lights up and sends an alert. The minute spent once on creating the indicator pays off; you learn about the problem immediately, before anyone else. Perhaps you even fixed it before anyone noticed. Quickly raised incidents do not count as having fallen!
Security
It would be unfortunate if you set up monitoring for increased reliability, but as a result, you get attacked through it, since there are quite a few network vulnerabilities in various monitoring tools., ).
Agent (okerrmod from the package ), operating on the system, is not a network server but a client. Therefore, there are no additional open ports on the monitored server; the client easily operates behind a firewall or NAT, making it very difficult (I would say 'impossible') to hack via the network, as it essentially doesn't listen on a network socket.
Full monitoring coverage
Currently, we have a rule: we learn about all technical problems from okerr. If the rule is violated (okerr does not warn us about its impending occurrence (if possible) or that it has already happened) — we add checks to okerr.
External checks
A fairly standard set:
- ping
- http status
- checking the validity and freshness of the SSL certificate (will warn if expiration is near)
- open TCP port and the banner on it
- http grep (a certain text should [not] be on the page)
- sha1 hash to detect page changes.
- DNS (DNS record must have a certain value)
- WHOIS (will warn if the domain is about to expire)
- Antispam DNSBL (check the host immediately against 50+ anti-spam blacklists)
Internal Checks
Also, quite a typical set (but easily expandable).
- df (disk space available)
- load average
- opentcp (open listening TCP sockets — will notify if something started or crashed)
- uptime — simply the uptime of the server. Will notify if it decreases (i.e., the server rebooted)
- client_ip
- dirsize — we use it to track when our virtual rootfs exceeds the allowed size without imposing strict limits, and for monitoring user home directories.
- empty and nonempty — monitor files that should be empty (or not empty). For example, the server's error log okerr — should be empty, and if there's even one line, I'll get a notification and check. Meanwhile, mail.log on the mail server must NOT be empty (after N minutes post-rotation). Sometimes it has been empty, especially after system updates when logrotate cannot correctly restart rsyslog.
- linecount — number of lines in a file (like wc -l). We use it as a softer replacement for empty when the error log might still grow, but only slowly (for example, our Googlebot keeps hitting some restricted pages). There’s a limit of 2 lines every 20 minutes. If it exceeds this, an alert will be triggered.
Interesting Internal Checks
If you’ve been skimming so far, it’s time to read a bit more closely — it will get more interesting.
backups
Monitors backups in the directory. Our backup files are named like "ServerName-20200530.tar.gz". For each server, an indicator ServerName-DATE.tar.gz is created in okerr (the actual date replaces the string "DATE"). It tracks both the presence of a fresh backup and its size (for instance, it can't be less than 90% of the previous backup).
What needs to be done for a new backup to start getting monitored after we begin creating and placing it in this directory? Nothing! This is a very convenient approach when you need to do "nothing" because:
- Doing "nothing" is quite quick, saving time.
- It's hard to forget to do "nothing".
- It's hard to do "nothing" incorrectly or erroneously. Nothing is the most reliable method.
However, if fresh backup files suddenly stop appearing — an alert will be triggered. If, for example, you’ve disabled one of the servers and there shouldn't be any more backups from it — you’ll need to delete the indicator (either via the web interface or from the shell through the API).
maxfilesz
Monitors the size of the largest files (usually: /var/log/*). This helps catch unpredictable issues, such as password guessing or spam being sent from the server.
runstatus/runline
These are two important proxy modules for running other programs on the server. Runstatus reports the exit code of the program. For example, okerr does not require a module to check if systemd services are running. This is done through runstatus (see below). Runline reports the line outputted by the program to the server. For example, temp_RUN="cat /sys/class/thermal/thermal_zone0/temp" in the Runline config on our server, it creates an indicator servername:temp with the CPU temperature.
sql
Executes a numerical query to MySQL and reports the result to the indicator. In a simple case, you can do, for example, 'SELECT 1' — this checks that the database management system is working in general.
But a much more interesting application is, for example, tracking the number of orders in an online store. If you know that you have 100 orders per hour, you can set a minimum threshold of 100 or 80. Then, if your sales suddenly drop, you will receive an alert and can investigate.
Note — it doesn't matter what unpredictable reason this happens:
- The server is simply unavailable (powered off or disconnected from the network), and the alert came from the indicator 'stale'.
- The server is overloaded, running slowly, or packets are being lost, making it inconvenient for users, and they leave without making purchases.
- The server has been blacklisted, and emails from it are not accepted; users cannot register.
- The advertising campaign budget has run out, and banners are not displayed.
There can be countless reasons, and you cannot foresee all of them in advance; technically, it can be difficult to track. But you can conveniently monitor the final parameter (orders) and determine based on it that the situation is suspicious and deserves investigation.
Logical indicators
Allows the use of logical expressions (Python syntax) through the module (). Project data and its indicators are available for the expression. For example, in the SQL check section above, you might have noticed a weak point — during the day we may have up to 100 sales per hour, but at night — 20, which is normal and not a problem. What to do? The indicator will panic constantly at night.
You can create two indicators, one for day and one for night. Both can be set to 'silent' (they will not send notifications). Additionally, you can create a logical indicator that requires the day indicator to be OK until 8:00 PM, and after 8:00 PM, it's enough for the night indicator to be OK.
Another example of using a logical indicator is escalation. For instance, a project manager unsubscribes from alerts (they don't need them; admins should respond to typical issues), but subscribes to a logical indicator that turns red if any indicator in the project is not resolved within the allocated time.
Additionally, there is an option to designate allowed working hours, for example, from 3 AM to 5 AM. We are not concerned if servers and websites 'crash' during this time. However, by 5 AM, they need to be operational. If they are down at any other time—alert. The logical indicator can also account for server redundancy. If you have 5 web servers, admins can turn off 1-2 servers at any time. But if fewer than 3 of the 5 servers are operational—an alert occurs.
The examples above are not features of okerr; they are not some settings that need to be activated and configured. None of these functions exist in okerr, but there is a logical module that allows for this functionality to be implemented (Much like in programming languages—if we have arithmetic operators, we don't need a special function in the language to calculate 20% VAT; it can always be created as needed).
The logical indicator is probably one of the few relatively complex topics in okerr, but the good news is that you do not need to master them until the need arises. However, they greatly expand the options while keeping the system itself quite simple.
Adding your own checks
I really want to convey the idea that okerr is not a collection of a thousand ready-made checks for every situation. Instead, it is primarily a simple engine with a straightforward capability to create your own checks. Creating your own checks in okerr is not a task for hackers, system co-developers, or even advanced okerr users; it is a manageable task for any admin who installed Linux for the first time a month ago.
Basic checks are done through the module :
This line in the config will notify you if suddenly /bin/true fails to execute or returns a non-zero status.
true_OK=/bin/trueJust one line — and here we are, having expanded a bit the functionality of okerr. Even such a check has its value: if your server crashes, the corresponding indicator on the okerr server won’t update in time, and after a while, an alert will be triggered.
This check will notify you that the apache2 server is down (just in case...):
apache_OK="systemctl is-active --quiet apache2"
So, if you know any programming language, at least you can write shell scripts — then you can already add your own checks.It's more complicated — you can write your own module for okerrmod in any language. In the simplest case, it looks like this:
Isn't it really simple? The module must perform the check itself and output the results to STDOUT. A more complex module might provide something like this:
#!/usr/bin/python3

print("STATUS: OK")
$ okerrmod --dump df NAME: pi:df-/ TAGS: df METHOD: numerical|maxlim=90 DETAILS: 49.52%, 13.9G/28.2G used, 13.0G free STATUS: 49.52NAME: pi:df-/boot TAGS: df METHOD: numerical|maxlim=90 DETAILS: 84.32%, 53.1M/62.9M used, 9.9M free STATUS: 84.32
It updates several indicators at once (separated by a blank line), creates them if necessary, specifies the details of the check, and the tag by which you can easily find the relevant indicators on the dashboard.There is a Telegram bot
Telegram
@OkerrBot Status pages
In our time, status pages are almost a must-have for any business with an IT presence, a responsible attitude towards reliability, and respect for its clients/users.
In today's world, status pages are almost a must-have for any business that has IT, a responsible attitude towards reliability, and respects its clients/users.
Imagine a situation where a user wants to do something, check information, or place an order, and something goes wrong. They don't know what's wrong, whose side the problem is on, or when it will be resolved. Is your company's website just down? Or has it been broken for six months and will be fixed in two years? But the refrigerator needs to be bought now, it's already in the cart... It's entirely different when a person sees that something is wrong with you (at least it's clear that the problem is not on their side), that the issue has been identified, that you are already working on it, and maybe even provided an approximate time for resolution. The user can subscribe and receive a notification by email when the problem is resolved and they can proceed with what they wanted (buy the refrigerator).
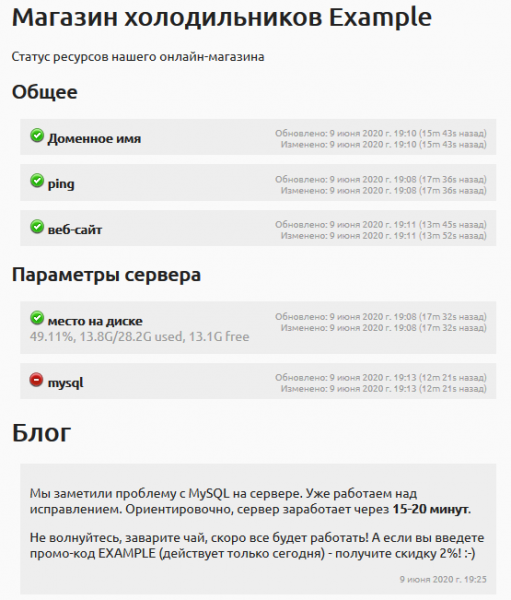
Problems and downtime happen to everyone. However, users and partners tend to trust those who are more transparent and responsible about it.
Here . Here are examples of what those pages look like for different projects. and . .
Failover
To avoid making this article even longer, I will refer again to my previous article — . If you can create a failover server, you will basically not experience long downtimes — as soon as the problem is detected, users will automatically be redirected to the functioning backup server. And I think this is a very interesting and standout feature that is rarely found.
Low system requirements
For okerr servers — we use machines with RAM starting from 2GB. For network sensors — even 512MB is sufficient. The client-side — is almost negligible. (The package weighs 26 KB, but requires Python3 and standard libraries). The client runs from a cron script, so it has zero constant memory consumption. Among the monitored machines, we have sensors (super-cheap VPS with 512MB RAM) and Raspberry Pi. You can even send updates via curl ! (see below)
Considering this — okerr is probably the most free A monitoring system from the available options, as even to use another free open-source system like Zabbix or Nagios, you need to allocate resources (a server), which costs money. Moreover, server maintenance is still required. With okerr, this part can be eliminated. However, you can also choose not to eliminate it and use your own server—it's up to your preference.
API and integration into your own software
A simple and open architecture. okerr has a fairly straightforward , making it easy to work with. Need to create 1,000 indicators? One shell script of 3-4 lines will do it. Need to reconfigure 1,000 indicators? It's also very simple. For example, we want to double-check all our HTTPS certificates specifically with a Russian sensor:
#!/bin/sh

for indicator in `okerrclient --api-filter sslcert`
do
    echo set location for $indicator
    okerrclient --api-set location=ru retest=1 --name $indicator
done
You can update indicators using our client module or even without it, just via curl.
# short and nice (using okerrupdate and config file)
$ okerrupdate MyIndicator OK

# only curl is enough!
$ curl -d 'textid=MyProject&name=MyIndicator&secret=MySecret&status=OK' https://bravo.okerr.com/
Indicators can be updated directly from your program. For instance, by sending heartbeat signals so that okerr knows it is running and raises an alert if it crashes or hangs. By the way, okerr components do exactly this—okerr monitors itself, and issues in almost any module will be detected and generate a notification about the problem. (And in case of that 'almost'—they are cross-checked from another server.)
Here's a simplified version of the code in our Telegram bot:
from okerrupdate import OkerrProject, OkerrExc

op = OkerrProject()
uptimei = op.indicator("{}:telebot_uptime".format(hostname))
...
uptimei.update('OK', 'pid: {} Uptime: {} cmds: {}'.format(
        os.getpid(), dhms(uptime), commands_cnt))
To update indicators from Python programs—there's a library available. , for any other language—there is no library, but you can either call the okerrupdate script or make an HTTP request to the okerr server.
How okerr helps us
Okerr has changed our lives. Really. Perhaps another monitoring system could have done the same, but with okerr, it's easy and straightforward, and it has all the features we needed (what was missing—we added). By the way, if a feature is missing—just ask, and I’ll add it (I can't promise, but I want okerr to be the best monitoring system for small to medium projects). Or, even better, add it yourself—it’s simple.
We have managed to live by the principle of "learning about problems from okerr." If a problem arises that we did not learn about from okerr, we add a check in okerr. (In this case, by "we," I mean us as system users, not co-developers). At first, this happened frequently, but now it has become very rare.
Monitoring
Through okerr, we monitor the sizes of logs on all servers. Reading every line of the log with attention is certainly impossible, but just tracking the growth rate already provides a lot of insights. Through this, we discovered spam sending, brute-force password attempts, and situations where some applications "go crazy," not functioning properly and repeating the same actions over and over (each time adding a few lines to the log).
SSL Certificates. Almost immediately after launch our client started providing free SSL certificates to their customers (around a thousand of them). And it turned out to be a real nightmare for administration! The thing is that the websites are "live," clients occasionally request changes, and programmers make adjustments. They may freely move the website to another DocumentRoot, for example. Or add an unconditional Rewrite to the virtual host config. Naturally, after such changes, the automatic renewal of certificates breaks. Now, all our SSL hosts are automatically added to okerr through another useful tool from our package . We simply run a2okerr.py — and if several new websites appear on the server — they will automatically show up in okerr. If for some reason the certificate does not renew, three weeks before it expires — we are informed, and we figure out why it is not renewing, that pesky thing. a2certbot.py from the same package — is very helpful in this (it immediately checks for the most likely issues — and reports what checked out well and where there is likely a problem).
We keep track of the expiration dates for all our domains. Additionally, all our mail servers that send email are checked against over 50 different blacklists. (And sometimes end up on them). By the way, did you know that Google mail servers are also on blacklists? Just for self-testing, we added mail-wr1-f54.google.com to the monitored servers, and indeed it is on the SORBS blacklist! (This raises a question about the value of "anti-spammers")
Backups — I mentioned earlier how easy it is to monitor them with okerr. But we also keep track of fresh backups on our server, and (using a separate utility that utilizes okerr) — of the backups we upload to Amazon Glacier. And yes — problems do occur periodically. It's not for nothing that we keep an eye on them.
We use an escalation indicator. It shows if a certain problem hasn't been fixed for a long time. And I sometimes forget about them when I'm tackling tasks myself. Escalation serves as a good reminder, even if I’m keeping tabs on everything.
Overall, I believe the quality of our work has improved significantly. Downtime is almost nonexistent (or the client doesn’t notice it in time. Just hush!), and the workload has decreased while the working conditions have become calmer. We’ve transitioned from frantic patchwork to a more measured approach, where many problems can be anticipated in advance, allowing time to prevent them. Even issues that do occur are easier to fix: firstly, we learn about them before clients panic, and secondly, it often turns out that the problem is related to recent work (while fixing one thing, another breaks) — thus, it’s simpler to resolve right away.
Here’s another case…
Did you know that in the popular Debian 9 (Stretch), a package as widely used as phpmyadmin has been in a vulnerable status for months now? (). When the vulnerability was discovered, we quickly patched it through various means. However, I set up okerr to monitor the security tracker page so I’d know when a 'clean' solution (via SHA1 content hash) became available. Several times, the indicator alerted me; the page changed, but as you can see — it still hasn’t indicated that the issue has been resolved since January 2019! Perhaps someone knows what the problem is that has kept this critical package vulnerable for over a year?
Another time in a similar situation: after a vulnerability in SSH, it was necessary to update all servers. And when you set a task — you need to monitor its execution. (Subordinates tend to misunderstand, forget, get confused, and make mistakes). Therefore, first we added a check for the SSH version on all servers in okerr, and through okerr we monitored that updates were applied to all servers. (Convenient! I selected this type of indicator, and it immediately shows which version is on which server). Once we confirmed that the task was completed on all servers — we removed the indicators.
There were a couple of times when some issue arose, and then it resolved itself. (Probably familiar to everyone?). By the time you notice it and check — there's nothing left to check — everything is already working fine. But then it breaks again. We experienced this, for example, with products we uploaded to Amazon Marketplace (MWS). At one point, the uploaded inventory was incorrect (wrong quantities and prices). We figured it out. But to get to the bottom of it — it was important to know about the problem immediately. Unfortunately, MWS, like all Amazon services, is a bit sluggish, so there was always a lag, but still — we managed to somewhat grasp the connection between the problem and the scripts that triggered it (we made a check, connected it to okerr, and monitored it right after receiving an alert).
A recent interesting case was added to the collection by a large and expensive European host used by our client. Suddenly, ALL of our servers disappeared from radar! At first, the client himself noticed (faster than Okerr!) that the site he was working on wasn't loading and created a ticket about it. But it turned out not just one site, but all of them! (Natasha, we dropped everything!). Then Okerr started sending long logs with all the indicators that lit up. Panic, panic, running in circles (what else can we do?). Then everything came back up. It turns out there were scheduled maintenance works at the data center (every few years), and they were supposed to warn us, of course. But something went wrong on their end, and they didn't notify us. Well, an infarction more or less. But after everything was restored, everything needed to be double-checked! I can't imagine how I would do that manually. Okerr tested everything in a matter of minutes. It turned out that most of the servers were just temporarily unavailable but still functional. Some had to reboot, but they came back up as needed. Among all the losses, we lost two backups that were supposed to be created and loaded during that complete debacle. I didn't even create them, and just after a day, alerts came that everything was OK, and the backups had appeared. I really like this example because Okerr proved to be very useful in a situation we hadn’t even anticipated, but that’s the task of monitoring — to withstand the unpredictable.
For Okerr sensors, we use the cheapest hosting available (where quality and reliability aren't critical, as they back each other up). So recently, we found a very lively hosting service at an incredibly low price, with amazing benchmarks. But… sometimes outgoing connections from the virtual machine are made from a different (neighboring) IP. Miracles. The client_ip module is receiving the wrong IP. And even from the server logs of the indicator, it’s clear that the update also came from this neighboring IP. We are currently sorting this out with support. It’s a good thing we noticed this during a calm period. However, it often happens that access is listed under a whitelist of IPs — and if the server flickers like this for a short time, it can take a long time to track down this problem.
And also — since we are talking about VPS hosting — we always use affordable options (hetzner, ovh, scaleway). In terms of benchmarks and stability — we really like them. We also use the much more expensive Amazon EC2 for other projects. So, thanks to okerr, we have our own informed opinion. Both types have downtimes. And I wouldn’t say that over our long observations, cheap hosts like hetzner have proven to be noticeably less stable than EC2. So if you’re not tied to other Amazon features — why pay more? 🙂
What's next?
If I haven’t scared you off from Okerr yet — give it a try! You can access the (Click right now!). But keep in mind — the demo account is shared, so if you do something, someone else in the same account may interfere with you at the same time. Or (better) sign up through the link to the — it’s all simple, without SMS. If you don’t want to use your real email — you can use a disposable one, like mailinator (I recommend ). Such accounts may be deleted over time — but they are fine for testing.
After registration, you will be prompted to undergo training (complete several not-so-difficult educational tasks). The initial limits are very low, but they are sufficient for training or one server. After completing the training — limits (for example, the maximum number of indicators) will be increased.
From the documentation — primarily on the server part and the client (). But if something is unclear — write to support (at) okerr.com or leave a ticket — we will try to resolve everything quickly.
If you use it seriously and these increased limits are not enough — just write to support, we will increase them (for free).
Want to install the okerr server on your server? Here’s the . We recommend installing on a clean virtual machine, as it makes it easy to set up using the installation script. On your own virtual machine — no restrictions :-). And again — if you need anything — we will always try to help.
We want this project to take off, making the world safer thanks to us. With free software and services, the world has become friendlier and is developing more dynamically. Source code can be stored on free GitHub, and for email, we use free Gmail. We utilize free for support. None of this requires paying for servers, no need to download or configure, or deal with various operational issues. Every new project, every team instantly has email, repositories, and CRM. And all of this is of very high quality, free, and available immediately. We want monitoring to be the same — small companies and projects should be able to use Okerr for free and even have the reliability of established serious projects during their inception and growth.
Source: habr.com
