

Hello everyone! As part of my coursework, I researched the capabilities of the domestic cloud platform, . The platform offers various services for solving practical tasks. However, there are times when it's necessary to configure your cloud application based on these services with a fairly complex infrastructure. In this article, I want to share my experience deploying such an application.

What do I want to achieve?
— a powerful tool for solving analytical tasks or monitoring certain systems. In its basic configuration, it's a virtual machine with a Grafana web server and a database (ClickHouse, InfluxDB, etc.) with a dataset from which analytics will be built.
After starting the virtual machine with the web server, you can access its host and get a beautiful UI, specify databases as sources for further work, and create dashboards and graphs.
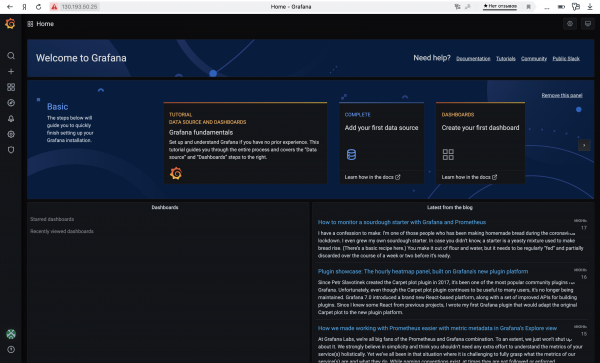
The basic version has one significant drawback — it is not fault-tolerant at all. That is, the application's functionality relies entirely on the viability of a single virtual machine. If it fails or if 10 people simultaneously open the UI, issues will arise.
They can be easily resolved: you just need to deploy several identical virtual machines with a web server and place them behind an L3 load balancer. However, it’s not that straightforward. Grafana stores user settings (paths to databases, dashboards, graphs, etc.) directly on the disk of its virtual machine. Thus, if you change some settings in the UI, those changes will only reflect on the specific virtual machine to which the balancer directed us. This will lead to inconsistent settings in our application, causing issues with its launch and usage.
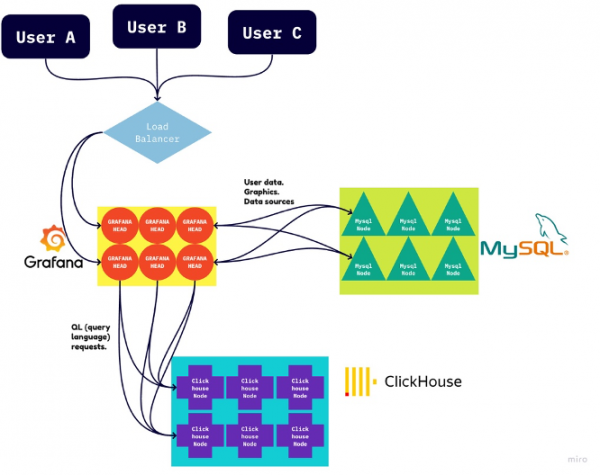
Here, another database will come to the rescue, such as MySQL or its equivalent. We tell Grafana that it should store user settings in this "backup" database. After that, it's enough to specify the path to this DB on each machine once, and all other user settings can be edited on any of the virtual machines; they will sync with the others.
Here’s a diagram of the final application infrastructure:
Let's learn to manually set up
MySQL and ClickHouse
Before deploying such an application with a single button click, one needed to learn how to manually set up each component and integrate them with one another.
Here, Yandex.Cloud comes to our aid, providing L3 balancers, ClickHouse, and MySQL as managed services. The user just needs to specify the parameters and wait for the platform to get everything up and running.
I registered, created a cloud and payment account. After that, I logged into the cloud and set up MySQL and ClickHouse clusters with minimal configurations. I waited until they became active.
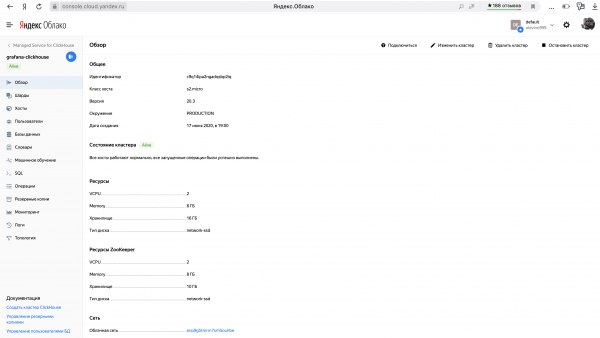
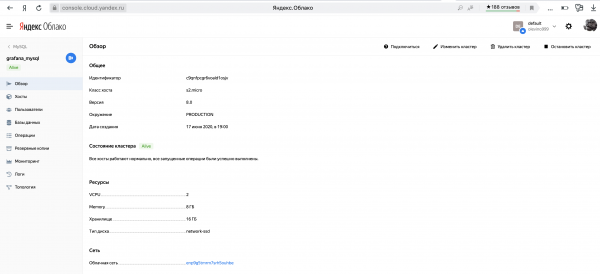
Also, don’t forget to create a database in each cluster and set up access with a username and password. I won’t go into details here — everything is quite straightforward in the interface.
An important detail was that these databases have many hosts ensuring their fault tolerance. However, Grafana requires exactly one host for each database it works with. The cloud led me to the solution. It turns out, a host of the type c-.rw.mdb.yandexcloud.net maps to the current active master host of the cluster with the corresponding identifier. This is what we will hand over to Grafana.
Web server
Now it’s the web server’s turn. Let’s set up a standard virtual machine with Linux and configure Grafana on it manually.
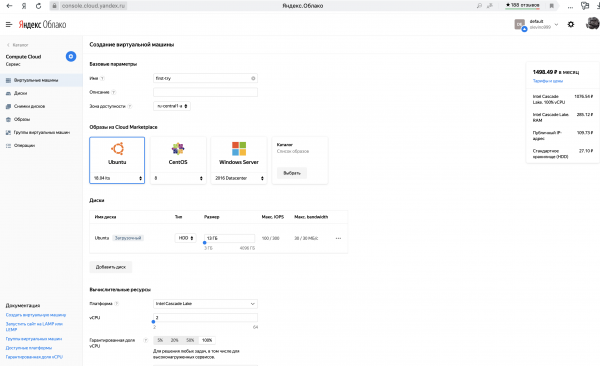

We’ll connect via SSH and install the necessary packages.
sudo apt-get install -y apt-transport-https software-properties-common wget
wget -q -O - https://packages.grafana.com/gpg.key | sudo apt-key add -
sudo add-apt-repository "deb https://packages.grafana.com/enterprise/deb stable main"
sudo apt-get update
sudo apt-get install -y grafana-enterprise
After that, we’ll start Grafana under systemctl and install the plugin for working with ClickHouse (yes, it doesn’t come in the basic package).
sudo systemctl start grafana-server
sudo systemctl enable grafana-server
sudo grafana-cli plugins install vertamedia-clickhouse-datasource
That’s it, after this simple command,
sudo service grafana-server startwe will launch the web server. Now we can enter the external IP address of the virtual machine in the browser, specify port 3000, and see a beautiful Grafana UI.
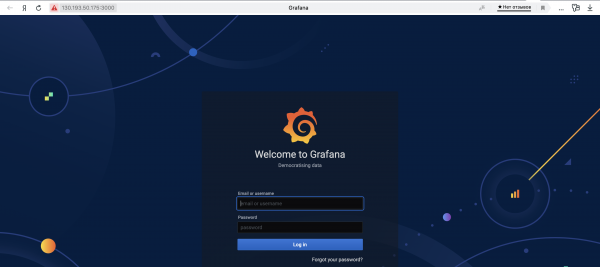
But don't rush; before configuring Grafana, don’t forget to specify the path to MySQL to store the settings there.
All Grafana web server configurations lie in the file /etc/grafana/grafana.ini. The required line looks like this:
;url =We set up the host for the MySQL cluster. In this same file, you can find the username and password for accessing Grafana as shown in the image above, both of which are set to default values. admin.
You can use sed commands:
sudo sed -i "s#.*;url =.*#url = mysql://${MYSQL_USERNAME}:${MYSQL_PASSWORD}@${MYSQL_CLUSTER_URI}#" /etc/grafana/grafana.ini
sudo sed -i "s#.*;admin_user =.*#admin_user = ${GRAFANA_USERNAME}#" /etc/grafana/grafana.ini
sudo sed -i "s#.*;admin_password =.*#admin_password = ${GRAFANA_PASSWORD}#" /etc/grafana/grafana.ini
Now is the perfect time to restart the web server!
sudo service grafana-server restartNow let's specify ClickHouse as the DataSource in the Grafana UI.
I managed to achieve a working configuration with the following settings:
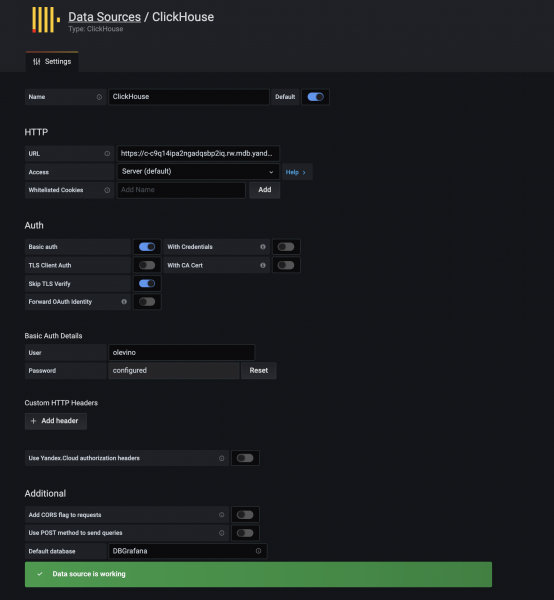
For the URL, I specified https://c-.rw.mdb.yandexcloud.net:8443
That's it! We have one operational virtual machine with a web server connected to CH and MySQL. We can now upload the dataset to ClickHouse and build dashboards. However, we have not yet reached our goal and have not deployed a full infrastructure.
Packer
Yandex.Cloud allows you to create a disk image of an existing virtual machine, and based on that, you can create as many identical machines as you want. This is what we will utilize. To conveniently assemble the image, we will take the tool from HashiCorp. It takes a JSON file as input with instructions for building the image.
Our JSON file will consist of two blocks: builders and provisioners. The first block describes the parameters of the image as an entity, while the second contains instructions to fill it with the necessary content.
Builders
{
"builders": [
    {
      "type": "yandex",
      "endpoint": "{{user `endpoint`}}",
      "folder_id": "",
      "subnet_id": "{{user `subnet_id`}}",
      "zone": "{{user `zone`}}",
      "labels": {},
      "use_ipv4_nat": true,
      "use_internal_ip": false,
      "service_account_key_file": "",
      "image_name": "grafana-{{timestamp}}",
      "image_family": "grafana",
      "image_labels": {},
      "image_description": "GRAFANA",
      "source_image_family": "ubuntu-1804-lts",
      "disk_size_gb": 3,
      "disk_type": "network-hdd",
      "ssh_username": "ubuntu"
    }
  ],
...
}
In this template, you need to specify the section ID in the cloud where you want to create the image, as well as the path to the file with keys from the service account, which should be previously created in that section. You can read more about creating service accounts and keys in file format in the relevant section. .
This configuration indicates that the disk image will be assembled based on the platform ubuntu-1804-lts, placed in the relevant section of the user in the image family GRAFANA under the name grafana-{{timestamp}}.
Provisioners
Now for the more interesting part of the configuration. It will describe the sequence of actions that need to be taken on the virtual machine before freezing its state into a disk image.
{
...,
"provisioners": [
    {
            "type": "shell",
            "pause_before": "5s",
            "scripts": [
                "prepare-ctg.sh"
            ]
        },
    {
            "type": "file",
            "source": "setup.sh",
            "destination": "\/opt\/grafana\/setup.sh"
        },
        {
            "type": "shell",
        "execute_command": "sudo {{ .Vars }} bash '{{ .Path }}'",
            "pause_before": "5s",
            "scripts": [
                "install-packages.sh",
                "grafana-setup.sh",
                "run-setup-at-reboot.sh"
        ]
        }
  ]
}
All actions are divided into 3 stages. The first stage involves a simple script that creates an auxiliary directory.
prepare-ctg.sh:
#!/bin/bash
sudo mkdir -p /opt/grafana
sudo chown -R ubuntu:ubuntu /opt/grafana
At the next stage, we place a script in this directory that will need to be run immediately after the virtual machine starts. This script will add the necessary user variables to Grafana's config and restart the web server.
setup.sh:
#!/bin/bash
CLUSTER_ID="<cluster_id>"
USERNAME="<username>"
PASSWORD="<password>"
sudo sed -i "s#.*;url =.*#url = mysql://${USERNAME}:${PASSWORD}@c-${CLUSTER_ID}.rw.mdb.yandexcloud.net#" /etc/grafana/grafana.ini
sudo sed -i "s#.*;admin_user =.*#admin_user = ${USERNAME}#" /etc/grafana/grafana.ini
sudo sed -i "s#.*;admin_password =.*#admin_password = ${PASSWORD}#" /etc/grafana/grafana.ini
sudo service grafana-server restart
After that, there are 3 things left to do:
1) install the packages
2) run Grafana under systemctl and install the ClickHouse plugin
3) queue the setup.sh script to run immediately after the virtual machine is powered on.
install-packages.sh:
#!/bin/bash
sudo systemd-run --property='After=apt-daily.service apt-daily-upgrade.service' --wait /bin/true
sudo apt-get install -y apt-transport-https
sudo apt-get install -y software-properties-common wget
wget -q -O - https://packages.grafana.com/gpg.key | sudo apt-key add -
sudo add-apt-repository "deb https://packages.grafana.com/enterprise/deb stable main"
sudo apt-get update
sudo apt-get install -y grafana-enterprise
grafana-setup.sh:
#!/bin/bash
sudo systemctl start grafana-server
sudo systemctl enable grafana-server
sudo grafana-cli plugins install vertamedia-clickhouse-datasource
run-setup-at-reboot.sh:
#!/bin/bash
chmod +x /opt/grafana/setup.sh
cat > /etc/cron.d/first-boot <<EOF
PATH=/usr/local/sbin:/usr/local/bin:/usr/sbin:/usr/bin:/sbin:/bin:/usr/games:/usr/local/games
@reboot root /bin/bash /opt/grafana/setup.sh > /var/log/yc-setup.log 2>&1
EOF
chmod +x /etc/cron.d/first-boot;
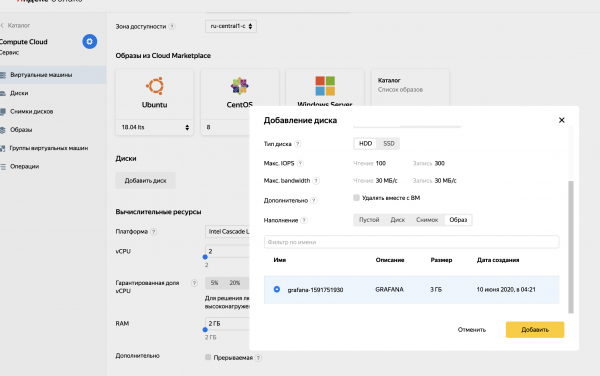
Now we just need to run Packer and receive the image placed in the specified section. When creating the virtual machine, you can choose it as the boot disk and have a ready-to-use Grafana web server after startup.
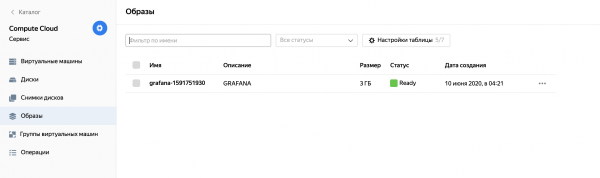
Instance Group and Load Balancer
Once the disk image has been created, allowing for the creation of multiple identical Grafana web servers, we can create an instance group. On the Yandex.Cloud platform, this term refers to a combination of virtual machines with identical characteristics. When creating an instance group, the prototype of all machines in the group is configured, followed by the characteristics of the group itself (for example, minimum and maximum number of active machines). If the current number does not meet these criteria, the instance group will automatically remove unnecessary machines or create new ones based on the existing model.
For our task, we will create an instance group of web servers that will be spawned from the previously created disk image.
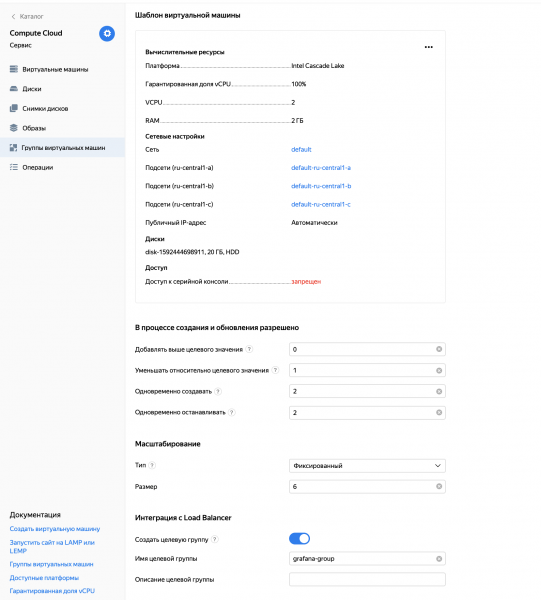
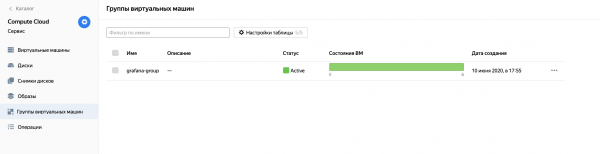
The latest configuration of the instance group is truly remarkable. The target group, integrated with the Load Balancer, allows you to set up an L3 balancer over the virtual machines in this group with just a couple of button clicks.
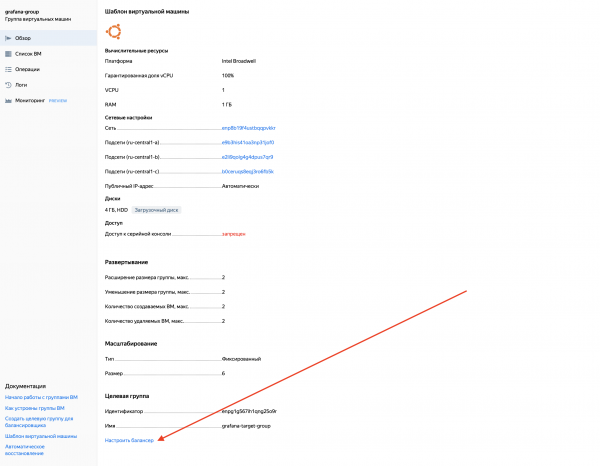
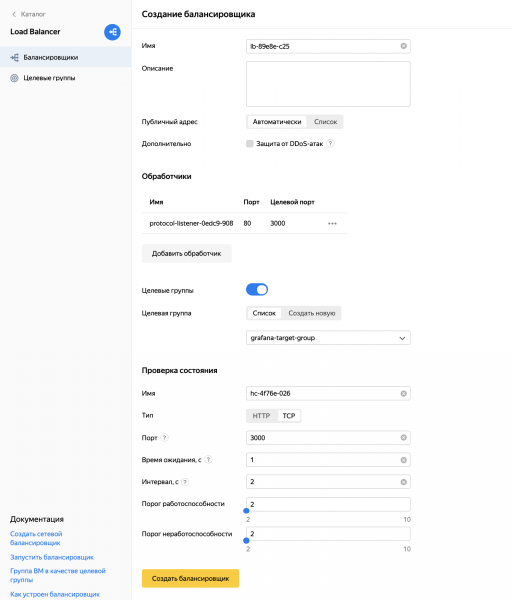
During the balancer setup, I implemented two important aspects:
- I configured the balancer to accept user traffic on port 80 and redirect it to port 3000 of the virtual machines, precisely where Grafana resides.
- I set up health checks for the machines by pinging them on port 3000.
Mini-summary
Finally, we were able to deploy the desired application infrastructure manually, and now we have a highly available Grafana service. All that is needed is to know the IP address of the balancer as the entry point to the application and the host of the ClickHouse cluster to upload the dataset.
One might think this is a victory? Yes, it is a victory. But something still feels off. The entire process above requires a lot of manual actions and is not scalable at all; I would like to automate it as much as possible. This will be the focus of the next section.
Integration with Terraform
We will again use the tool from HashiCorp called . It will help deploy the entire application infrastructure at the click of a button, based on several variables provided by the user. Let’s write a recipe that can be executed repeatedly in different environments of different users.
All work with Terraform comes down to writing a configuration file (*.tf) and creating infrastructure based on it.
Variables
At the very beginning of the file, we will define the variables that determine where and how the future infrastructure will be deployed.
variable "oauth_token" {
    type = string
    default = ""
}
variable "cloud_id" {
    type = string
    default = ""
}
variable "folder_id" {
    type = string
    default = ""
}
variable "service_account_id" {
    type = string
    default = ""
}
variable "image_id" {
    type = string
    default = ""
}
variable "username" {
    type = string
    default = ""
}
variable "password" {
    type = string
    default = ""
}
variable "dbname" {
    type = string
    default = ""
}
variable "public_key_path" {
    type = string
    default = ""
}
The entire process of deploying the application will come down to assembling the disk image and setting these variables. Let me explain what they are responsible for:
oauth_token — the token for accessing the cloud. It can be obtained from .
cloud_id — the identifier of the cloud where we will deploy the application
folder_id — the identifier of the section where we will deploy the application
service_account_id — the identifier of the service account in the corresponding cloud section.
image_id — the identifier of the disk image obtained using Packer
username and password — the username and password for accessing both databases and the Grafana web server
dbname — the name of the database within the CH and MySQL clusters
public_key_path — the path to the file containing your public ssh key, which can be used to connect under the name ubuntu to the virtual machines with web servers
Provider Configuration
Now we need to configure the Terraform provider — in our case, Yandex:
provider "yandex" {
  token     = var.oauth_token
  cloud_id  = var.cloud_id
  folder_id = var.folder_id
  zone      = "ru-central1-a"
}
You may notice that we are using the variables defined above.
Network and Clusters
Now let's create a network in which the elements of our infrastructure will communicate, three subnets (one in each region), and raise the CH and MySQL clusters.
resource "yandex_vpc_network" "grafana_network" {}

resource "yandex_vpc_subnet" "subnet_a" {
  zone           = "ru-central1-a"
  network_id     = yandex_vpc_network.grafana_network.id
  v4_cidr_blocks = ["10.1.0.0/24"]
}

resource "yandex_vpc_subnet" "subnet_b" {
  zone           = "ru-central1-b"
  network_id     = yandex_vpc_network.grafana_network.id
  v4_cidr_blocks = ["10.2.0.0/24"]
}

resource "yandex_vpc_subnet" "subnet_c" {
  zone           = "ru-central1-c"
  network_id     = yandex_vpc_network.grafana_network.id
  v4_cidr_blocks = ["10.3.0.0/24"]
}

resource "yandex_mdb_clickhouse_cluster" "ch_cluster" {
  name        = "grafana-clickhouse"
  environment = "PRODUCTION"
  network_id  = yandex_vpc_network.grafana_network.id

  clickhouse {
    resources {
      resource_preset_id = "s2.micro"
      disk_type_id       = "network-ssd"
      disk_size          = 16
    }
  }

  zookeeper {
    resources {
      resource_preset_id = "s2.micro"
      disk_type_id       = "network-ssd"
      disk_size          = 10
    }
  }

  database {
    name = var.dbname
  }

  user {
    name     = var.username
    password = var.password
    permission {
      database_name = var.dbname
    }
  }

  host {
    type      = "CLICKHOUSE"
    zone      = "ru-central1-a"
    subnet_id = yandex_vpc_subnet.subnet_a.id
  }

  host {
    type      = "CLICKHOUSE"
    zone      = "ru-central1-b"
    subnet_id = yandex_vpc_subnet.subnet_b.id
  }

  host {
    type      = "CLICKHOUSE"
    zone      = "ru-central1-c"
    subnet_id = yandex_vpc_subnet.subnet_c.id
  }

  host {
    type      = "ZOOKEEPER"
    zone      = "ru-central1-a"
    subnet_id = yandex_vpc_subnet.subnet_a.id
  }

  host {
    type      = "ZOOKEEPER"
    zone      = "ru-central1-b"
    subnet_id = yandex_vpc_subnet.subnet_b.id
  }

  host {
    type      = "ZOOKEEPER"
    zone      = "ru-central1-c"
    subnet_id = yandex_vpc_subnet.subnet_c.id
  }
}

resource "yandex_mdb_mysql_cluster" "mysql_cluster" {
  name        = "grafana_mysql"
  environment = "PRODUCTION"
  network_id  = yandex_vpc_network.grafana_network.id
  version     = "8.0"

  resources {
    resource_preset_id = "s2.micro"
    disk_type_id       = "network-ssd"
    disk_size          = 16
  }

  database {
    name = var.dbname
  }

  user {
    name     = var.username
    password = var.password
    permission {
      database_name = var.dbname
      roles         = ["ALL"]
    }
  }

  host {
    zone      = "ru-central1-a"
    subnet_id = yandex_vpc_subnet.subnet_a.id
  }
  host {
    zone      = "ru-central1-b"
    subnet_id = yandex_vpc_subnet.subnet_b.id
  }
  host {
    zone      = "ru-central1-c"
    subnet_id = yandex_vpc_subnet.subnet_c.id
  }
}
As you can see, each of the two clusters is designed to be quite fault-tolerant by being placed in three availability zones.
Web Servers
It might seem like I could continue in the same vein, but I encountered a challenge. Previously, I first stood up the MySQL cluster and only after that, knowing its ID, assembled a disk image with the necessary configuration, where I specified the host for the cluster. But now we don’t know the cluster ID until Terraform runs, including at the time of building the image. So I had to resort to the following .
Using Amazon's metadata service, we will pass some parameters to the virtual machine that it will accept and process. We need the machine to query the metadata for the MySQL cluster host and the username-password that the user specified in the Terraform file after starting up. We will slightly modify the contents of the file. setup.sh, which runs when the virtual machine is powered on.
setup.sh:
#!/bin/bash
CLUSTER_URI="$(curl -H 'Metadata-Flavor:Google' http://169.254.169.254/computeMetadata/v1/instance/attributes/mysql_cluster_uri)"
USERNAME="$(curl -H 'Metadata-Flavor:Google' http://169.254.169.254/computeMetadata/v1/instance/attributes/username)"
PASSWORD="$(curl -H 'Metadata-Flavor:Google' http://169.254.169.254/computeMetadata/v1/instance/attributes/password)"
sudo sed -i "s#.*;url =.*#url = mysql://${USERNAME}:${PASSWORD}@${CLUSTER_URI}#" /etc/grafana/grafana.ini
sudo sed -i "s#.*;admin_user =.*#admin_user = ${USERNAME}#" /etc/grafana/grafana.ini
sudo sed -i "s#.*;admin_password =.*#admin_password = ${PASSWORD}#" /etc/grafana/grafana.ini
sudo service grafana-server restart
Instance group and load balancer
After rebuilding the new disk image, we can finally append our file for Terraform.
Let's specify that we want to use an existing disk image:
data "yandex_compute_image" "grafana_image" {
  image_id = var.image_id
}
Now let's create the instance group:
resource "yandex_compute_instance_group" "grafana_group" {
  name               = "grafana-group"
  folder_id          = var.folder_id
  service_account_id = var.service_account_id
  instance_template {
    platform_id = "standard-v1"
    resources {
      memory = 1
      cores  = 1
    }
    boot_disk {
      mode = "READ_WRITE"
      initialize_params {
        image_id = data.yandex_compute_image.grafana_image.id
        size     = 4
      }
    }
    network_interface {
      network_id = yandex_vpc_network.grafana_network.id
      subnet_ids = [yandex_vpc_subnet.subnet_a.id, yandex_vpc_subnet.subnet_b.id, yandex_vpc_subnet.subnet_c.id]
      nat = "true"
    }
    metadata = {
      mysql_cluster_uri = "c-${yandex_mdb_mysql_cluster.mysql_cluster.id}.rw.mdb.yandexcloud.net:3306/${var.dbname}"
      username = var.username
      password = var.password
      ssh-keys = "ubuntu:${file("${var.public_key_path}")}"
    }
    network_settings {
      type = "STANDARD"
    }
  }

  scale_policy {
    fixed_scale {
      size = 6
    }
  }

  allocation_policy {
    zones = ["ru-central1-a", "ru-central1-b", "ru-central1-c"]
  }

  deploy_policy {
    max_unavailable = 2
    max_creating    = 2
    max_expansion   = 2
    max_deleting    = 2
  }

  load_balancer {
    target_group_name = "grafana-target-group"
  }
}
It is worth noting how we passed to the metadata cluster_uri, username and password. The virtual machine will retrieve these upon startup and store them in the Grafana configuration.
Now it's the load balancer's turn.
resource "yandex_lb_network_load_balancer" "grafana_balancer" {
  name = "grafana-balancer"

  listener {
    name = "grafana-listener"
    port = 80
    target_port = 3000
    external_address_spec {
      ip_version = "ipv4"
    }
  }

  attached_target_group {
    target_group_id = yandex_compute_instance_group.grafana_group.load_balancer.0.target_group_id

    healthcheck {
      name = "healthcheck"
      tcp_options {
        port = 3000
      }
    }
  }
}
A little bit of sugar
The last step is left. After the infrastructure is deployed, you will need to go into the Grafana UI and manually add the CH cluster (whose ID still needs to be obtained) as a Data Source. But Terraform knows the cluster ID. Let's have it finish the job.
Let's add a new provider — Grafana, and we'll use the load balancer's IP address as the host. All changes made by Terraform on the machine designated by its load balancer will be reflected in MySQL, and hence on all other machines.
provider "grafana" {
  url  = "http://${[for s in yandex_lb_network_load_balancer.grafana_balancer.listener: s.external_address_spec.0.address].0}"
  auth = "${var.username}:${var.password}"
}

resource "grafana_data_source" "ch_data_source" {
  type          = "vertamedia-clickhouse-datasource"
  name          = "grafana"
  url           = "https://c-${yandex_mdb_clickhouse_cluster.ch_cluster.id}.rw.mdb.yandexcloud.net:8443"
  basic_auth_enabled = "true"
  basic_auth_username = var.username
  basic_auth_password = var.password
  is_default = "true"
  access_mode = "proxy"
}
We will comb it.
We will output the load balancer's IP address and the ClickHouse cluster host.
output "grafana_balancer_ip_address" {
  value = [for s in yandex_lb_network_load_balancer.grafana_balancer.listener: s.external_address_spec.0.address].0
}

output "clickhouse_cluster_host" {
  value = "https://c-${yandex_mdb_clickhouse_cluster.ch_cluster.id}.rw.mdb.yandexcloud.net:8443"
}
Ready to launch.
That's it! Our configuration file is ready, and we can set the variables and instruct Terraform to bring up everything we described above. The entire process took me about 15 minutes.
At the end, you will see a nice message:
Apply complete! Resources: 9 added, 0 changed, 0 destroyed.
Outputs:

clickhouse_cluster_host = https://c-c9q14ipa2ngadqsbp2iq.rw.mdb.yandexcloud.net:8443
grafana_balancer_ip_address = 130.193.50.25
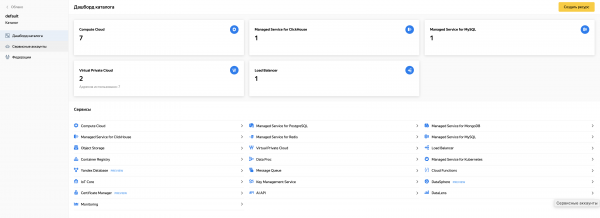
The elements of the deployed infrastructure will be visible in the cloud:
In conclusion
Now, using Grafana as an example, each of you can deploy applications with a complex cloud architecture on the Yandex.Cloud platform. Useful tools from HashiCorp, such as Packer and Terraform, can assist you with this. I hope this article proves helpful to someone 🙂
P.S. Below, I will attach a link to the repository where you can find ready-made recipes for Packer and Terraform, some of which I referenced in this article.
Source: habr.com
