

Hello, Habr! At the beginning of July, Solarwinds announced the release — 2020.2. One of the new features in the Network Traffic Analyzer (NTA) module is support for recognizing IPFIX traffic from VMware VDS.
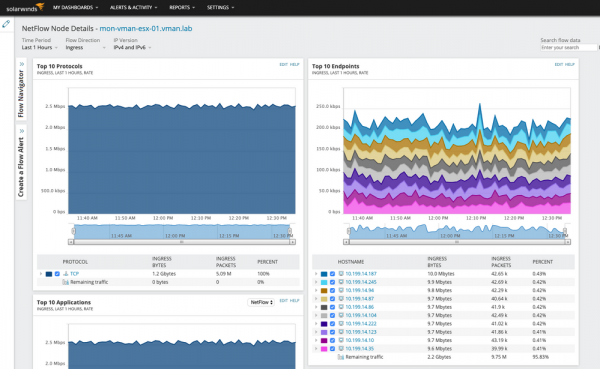
Traffic analysis in a virtual switch environment is crucial for understanding the load distribution across the virtual infrastructure. By analyzing traffic, one can also detect the migration of virtual machines. In this article, we will discuss the IPFIX export settings on the VMware virtual switch and the capabilities of Solarwinds to work with it. At the end of the article, there will be a link to the Solarwinds online demo (accessible without registration, and this is not a figure of speech). Details below.
To correctly recognize traffic from the VDS, you first need to configure the connection through the vCenter interface, and only then analyze the traffic and display traffic exchange points received from hypervisors. If desired, the switch can be configured to receive all IPFIX records from a single IP address associated with the VDS, but in most cases, it is more informative to view data extracted from traffic received from each hypervisor. The incoming traffic will represent connections to or from virtual machines located on the hypervisors.
Another possible configuration option is to export only internal data streams. This option excludes streams that are processed on an external physical switch and prevents the duplication of traffic records for connections to and from the VDS. However, it is more useful to disable this option and observe all streams visible on the VDS.
Configuring traffic from VDS
Let's start by adding the vCenter instance to Solarwinds. After that, the NTA will have information about the virtualization platform's configuration.
Go to the 'Manage Nodes' menu, then 'Settings,' and select 'Add Node.' After that, enter the IP address or fully qualified domain name of the vCenter instance and choose 'VMware, Hyper-V, or Nutanix entities' as the polling method.
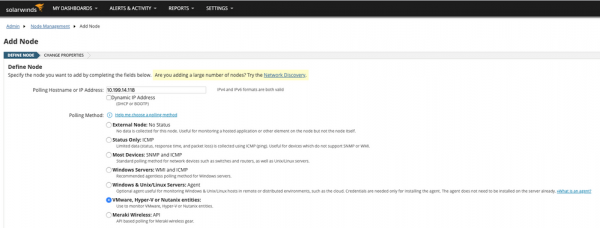
In the node addition dialog, add the credentials for the vCenter instance and test them to complete the setup.
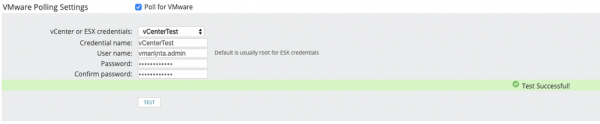
The initial polling of the vCenter instance will take some time, usually 10-20 minutes. You need to wait for it to complete before enabling IPFIX export on the VDS.
After setting up vCenter monitoring and obtaining inventory data for the virtualization platform configuration, we will enable IPFIX record export on the switch. The quickest way to do this is through the vSphere client. Navigate to the 'Networking' tab, select the VDS, and on the 'Configure' tab, find the current settings for NetFlow. VMware uses the term 'NetFlow' to refer to stream export, but the actual protocol used is IPFIX.
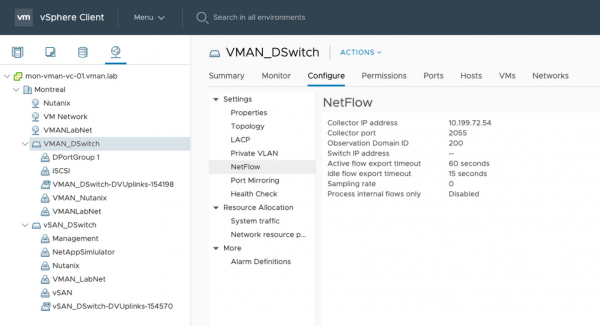
To enable flow export, select 'Settings' from the 'Actions' menu at the top and go to 'Edit NetFlow'.
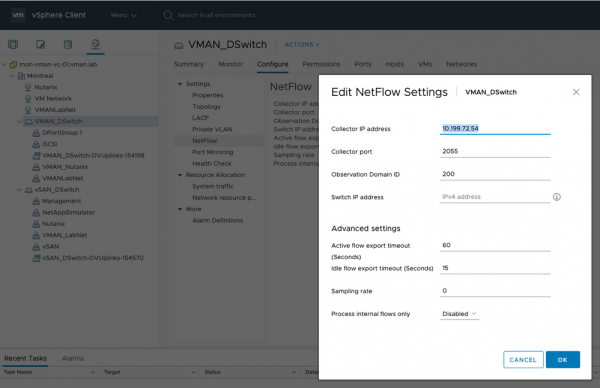
In this dialog box, enter the collector's IP address, which is also the Orion instance. The default port is typically 2055. It is recommended to leave the 'Switch IP Address' field empty, which will result in receiving stream records specifically from the hypervisors. This will provide flexibility for further filtering the data stream from the hypervisors.
Keep the 'Process internal flows only' field unchecked to see all communications: both internal and external.
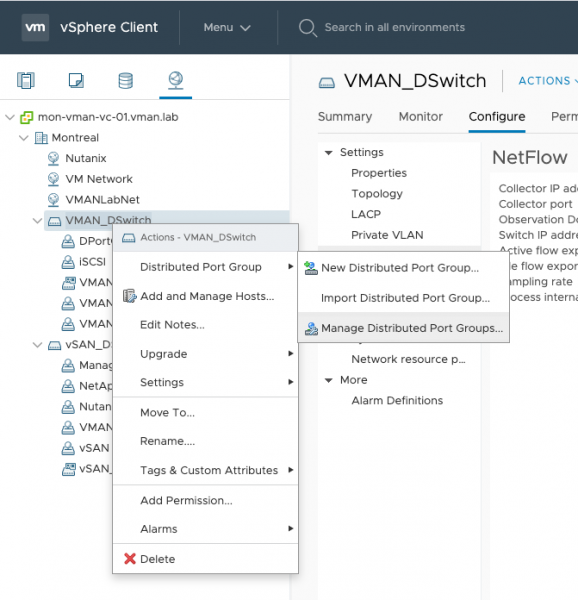
Once you enable flow export for the VDS, you will also need to enable it for the distributed port groups from which you want to receive data. The easiest way to do this is by right-clicking on the VDS navigation pane and selecting 'Distributed Port Group', then 'Manage Distributed Port Groups'.
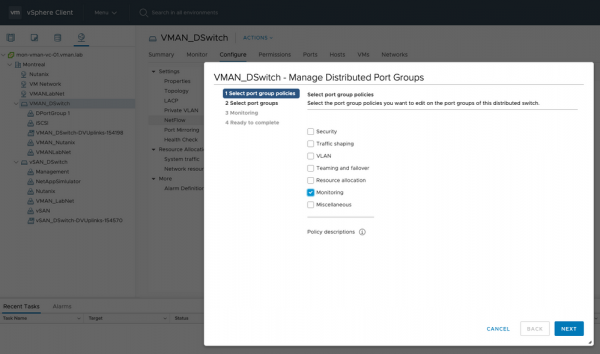
A dialog box will open where you need to check the 'Monitoring' box and click 'Next'.
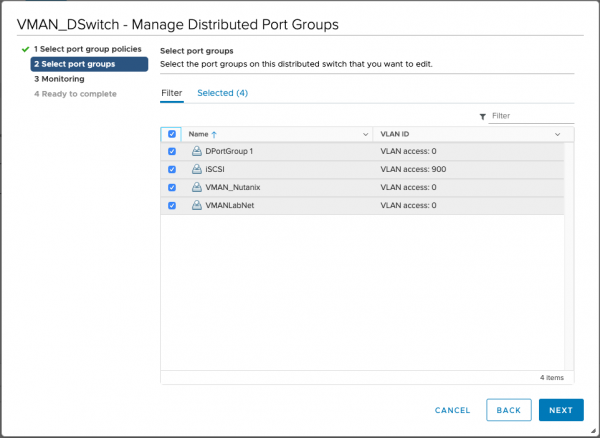
On the next step, you can select specific or all port groups.
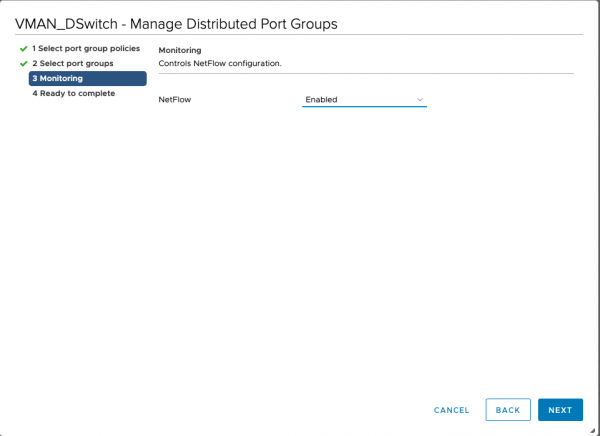
On the next step, switch NetFlow to 'Enabled'.
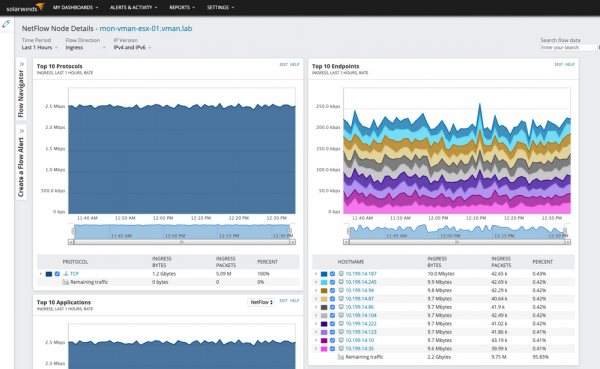
When flow export is enabled on the VDS and distributed port groups, you will see that flow records for the hypervisors start arriving in the NTA instance.
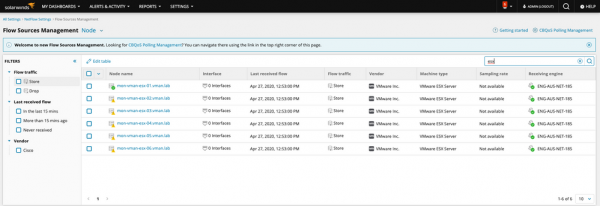
You can view the hypervisors in the list of flow data sources on the 'Manage Flow Sources' page in NTA. Switch to 'Nodes'.
You can see the results of the setup . Note the ability to drill down to the node level, interaction protocol, etc.
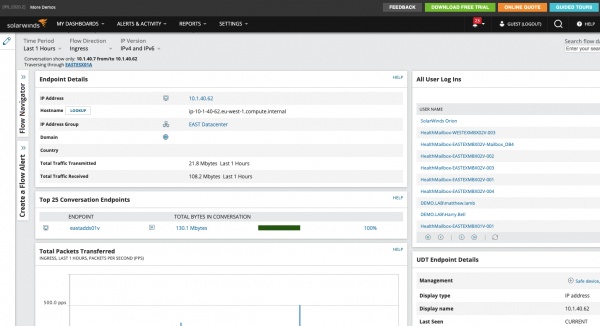
Integration with other Solarwinds modules in one interface allows for investigations across various dimensions: to see which users accessed the virtual machine, server performance , and applications on it, view related network devices and much more. For instance, if your network infrastructure employs the NBAR2 protocol, Solarwinds NTA can successfully recognize traffic from , or .
The main goal of this article is to demonstrate the simplicity of monitoring setup in Solarwinds and the completeness of the collected data. In Solarwinds, you have the chance to see the full picture of what is happening. If you would like a solution presentation or want to check everything for yourself, please leave a request at or call us.
On Habr, we also have an article about .
Subscribe to our .
Source: habr.com
