

Hello, Habr! Right now, OTUS is accepting applications for a new batch of the course . In anticipation of the course launch, we traditionally prepared an interesting translation for you.
Every day, over a hundred million people visit Twitter to find out what's happening in the world and discuss it. Every tweet and any other user actions generate events that are available for internal data analysis at Twitter. Hundreds of employees analyze and visualize this data, and enhancing their experience is a top priority for the Twitter Data Platform team.
We believe that users with a wide range of technical skills should be able to find data and have access to well-functioning analysis and visualization tools based on SQL. This would enable a whole new group of users with less technical inclination, including data analysts and product managers, to extract insights from the data, allowing them to better understand and utilize Twitter's capabilities. This is how we democratize data analysis at Twitter.
As we improve our tools and capabilities for internal data analysis, we have witnessed enhancements in Twitter's service. However, there is still room for growth. Current tools, such as Scalding, require programming expertise. SQL-based analysis tools like Presto and Vertica face performance challenges at scale. We also have the issue of distributing data across multiple systems without constant access to it.
Last year, we announced a , through which we are migrating parts of our to Google Cloud Platform (GCP). We concluded that Google Cloud tools could assist us in our initiatives to democratize analysis, visualization, and machine learning at Twitter:
- : an enterprise data warehouse with an SQL engine based on , renowned for its speed and simplicity, and capable of handling .
- a tool for visualizing big data with collaborative features similar to Google Docs.
In this article, you will learn about our experience with these tools: what we have done, what we have learned, and what we will do next. We will now focus on batch and interactive analytics. We will discuss real-time analytics in the next article.
The History of Data Warehousing at Twitter
Before diving into BigQuery, it's worth briefly recounting the history of data warehousing at Twitter. In 2011, data analysis at Twitter was conducted using Vertica and Hadoop. We used Pig for creating MapReduce jobs in Hadoop. In 2012, we replaced Pig with Scalding, which had a Scala API with advantages such as the ability to create complex pipelines and ease of testing. However, for many data analysts and product managers who were more comfortable working with SQL, this represented a steep learning curve. Around 2016, we began using Presto as a SQL interface for Hadoop data. Spark offered a Python interface, making it a good choice for ad hoc data research and machine learning.
Starting from 2018, we used the following tools for data analysis and visualization:
- Scalding for production pipelines
- Scalding and Spark for ad hoc data analysis and machine learning
- Vertica and Presto for ad hoc and interactive SQL analysis
- Druid for small interactive, exploratory, and low-latency access to time-series metrics
- Tableau, Zeppelin, and Pivot for data visualization
We found that while these tools offer very powerful capabilities, we faced challenges in making these capabilities accessible to a wider audience at Twitter. As we expand our platform with Google Cloud, we focus on simplifying our analytics tools for all of Twitter.
Google's BigQuery Data Warehouse
Several teams at Twitter have already integrated BigQuery into some of their production pipelines. Leveraging their experience, we began evaluating the capabilities of BigQuery for all of Twitter's use cases. Our goal was to offer BigQuery company-wide, as well as to standardize and maintain it within the Data Platform toolkit. This proved challenging for many reasons. We needed to develop infrastructure for reliably ingesting large volumes of data, managing data governance across the company, ensuring proper access controls, and safeguarding customer privacy. We also had to create systems for resource allocation, monitoring, and cost recovery, enabling teams to effectively utilize BigQuery.
In November 2018, we launched the alpha release of BigQuery and Data Studio for the entire company. We provided Twitter employees with some of our most frequently used tables containing cleansed personal data. Over 250 users from various teams, including engineering, finance, and marketing, utilized BigQuery. Recently, they executed around 8,000 queries, processing about 100 PB per month, excluding scheduled queries. After receiving highly positive feedback, we decided to move forward and present BigQuery as a primary resource for data interaction at Twitter.
Here’s a high-level architecture diagram of our Google BigQuery data warehouse.
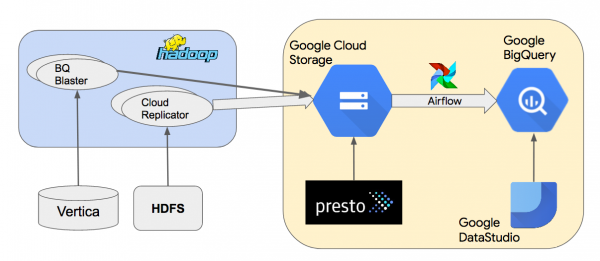
We copy data from local Hadoop clusters to Google Cloud Storage (GCS) using an internal tool called Cloud Replicator. Then, we use Apache Airflow to create pipelines that utilize “” to load data from GCS into BigQuery. We employ Presto to query Parquet or Thrift-LZO datasets in GCS. BQ Blaster is an internal Scalding tool for loading HDFS, Vertica, and Thrift-LZO datasets into BigQuery.
In the following sections, we will discuss our approach and insights regarding usability, performance, data management, system reliability, and cost.
Ease of use
We found that users could easily get started with BigQuery, as it required no software installation and could be accessed through an intuitive web interface. However, users needed to familiarize themselves with some of GCP's features and concepts, including resources like projects, datasets, and tables. We developed training materials and tutorials to help users get started. With a basic understanding, users found it easy to navigate datasets, view schema and table data, execute simple queries, and visualize results in Data Studio.
Our goal regarding data input into BigQuery was to enable seamless loading of HDFS or GCS datasets with a single click. We considered (managed Airflow), but could not use it due to our Domain Restricted Sharing security model (more on this in the 'Data Management' section below). We experimented with using Google Data Transfer Service (DTS) to orchestrate load tasks in BigQuery. While DTS was quick to set up, it lacked flexibility for building pipelines with dependencies. For our alpha version, we created our own Apache Airflow environment in GCE and are preparing it for production while supporting more data sources such as Vertica.
To transform data in BigQuery, users create simple SQL data pipelines using scheduled queries. For complex multi-step pipelines with dependencies, we plan to use either our own Airflow infrastructure or Cloud Composer along with .
Performance
BigQuery is designed for general-purpose SQL queries that handle large volumes of data. It is not intended for low-latency, high-throughput queries required for transactional databases or for low-latency time series analysis, implemented by . For interactive analytical queries, our users expect a response time of less than one minute. We needed to design the use of BigQuery to meet these expectations. To ensure predictable performance for our users, we utilized BigQuery features available to flat-rate clients, allowing project owners to reserve minimum slots for their queries. BigQuery is a unit of computational power necessary to execute SQL queries.
We analyzed over 800 queries processing about 1 TB of data each and found that the average execution time was 30 seconds. We also learned that performance highly depends on the use of our slots across various projects and tasks. We had to clearly differentiate our production and ad hoc slot reserves to maintain performance for production use cases and interactive analysis. This significantly impacted our design for slot reservation and project hierarchy.
We will talk about data management, functionality, and system costs in the upcoming days in the second part of the translation, but for now, we invite everyone interested to a , where you can learn more about the course and ask questions to our expert — Yegor Mateshchuk (Senior Data Engineer, MaximaTelecom).
Read more:
Source: habr.com
