

Tired of endless code reviews or debugging, you sometimes wonder how to simplify your life. A little searching or stumbling upon something might reveal the magical phrase: "Static Analysis." Let’s take a look at what this is and how it can interact with your project.

Actually, if you're programming in any modern language, you've unknowingly been passing your code through a static analyzer. The thing is, every modern compiler provides at least a few warnings about potential issues in the code. For example, when compiling C++ code in Visual Studio, you might see the following:

In this output, we can see that the variable var was never used anywhere in the function. So in fact, you’ve almost always been using a simple static code analyzer. However, unlike professional analyzers like Coverity, Klocwork, or PVS-Studio, the warnings provided by the compiler can only indicate a small range of problems.
If you're not sure what static analysis is and how to implement it, , to get a more detailed understanding of this methodology.
Why is static analysis needed?
In short: to speed things up and simplify them.
Static analysis can uncover a variety of problems in the code, from incorrect use of language constructs to typographical errors. For example, instead of
auto x = obj.x;
auto y = obj.y;
auto z = obj.z;
you wrote the following code:
auto x = obj.x;
auto y = obj.y;
auto z = obj.x;
As you can see, there’s a typo in the last line. For example, PVS-Studio gives the following warning:
Consider reviewing the correctness of 'y' item's usage.
If you want to poke at this error hands-on, try the ready-made example on Compiler Explorer: **.
As you can imagine, it’s not always possible to pay attention to such snippets of code right away, which can lead to spending a good hour debugging, wondering why everything works so strangely.
However, this is a clear error. And what if a developer wrote suboptimal code because they forgot some nuance of the language? Or even introduced ? К сожалению, подобные случаи совершенно обыденны и львиная часть времени тратится на то, чтобы отладить специфично работающий код, который содержит опечатки, типичные ошибки или undefined behavior.
Static analysis has emerged specifically for these situations. It serves as a developer's assistant, pointing out various issues in the code and explaining in the documentation why certain coding practices should be avoided, what consequences they may lead to, and how to fix them. Here's an example of what it may look like: **.
You can find more interesting errors that the analyzer can detect in the following articles:
Now that you've read this material and understood the benefits of static analysis, you might want to try it out. But where to start? How to integrate a new tool into your current project? And how to introduce it to the team? You'll find answers to these questions below.
Note. Static analysis does not replace or negate the usefulness of code reviews. It complements this process by helping to catch and correct typos, inaccuracies, and risky constructs early on. It's much more productive to focus code reviews on algorithms and code clarity rather than on spotting misplaced brackets or .
0. Getting Familiar with the Tool
It all starts with a trial version. Indeed, it's difficult to commit to implementing anything in the development process if you've never seen the tool in action. Therefore, the first step is to download the .
What you'll learn at this stage:
- What interaction methods are available with the analyzer;
- Whether the analyzer is compatible with your development environment;
- What problems currently exist in your projects.
Once you've installed everything necessary, the first thing to do is run an analysis of the entire project (, , ). In the case of PVS-Studio in Visual Studio, you'll see something like this (clickable):

The thing is that static analyzers usually generate a massive number of warnings for large codebase projects. There's no need to fix them all since your project is already working, meaning these issues are not critical. However, you and correct them as necessary. This requires filtering the output and retaining only the most reliable messages. In the PVS-Studio plugin for Visual Studio, this is done by filtering based on error levels and categories. For the most accurate output, keep only those enabled. High and General (also clickable):

Indeed, reviewing 178 warnings is significantly easier than sifting through a few thousand...
In the tabs Medium and Low there are often good warnings, however, these categories include diagnostics that have lower accuracy (reliability). You can find more about warning levels and options for Windows operation here: **.
After successfully reviewing the most interesting errors (and fixing them successfully), it's worth . This is necessary so that new warnings do not get lost among the old ones. Additionally, the static analyzer is a helper for the programmer, not a bug list. 🙂
1. Automation
Once familiarization is complete, it's time to configure plugins and integration into CI. This needs to be done before programmers begin using the static analyzer. The reason is that programmers might forget to enable the analysis or may not wish to use it at all. Therefore, a final check of everything must be done to ensure that unverified code cannot enter the main development branch.
What you will learn at this stage:
- What automation options the tool provides;
- Whether the analyzer is compatible with your build system.
Since ideal documentation doesn't exist, sometimes you have to write to . This is normal, and we're happy to help you. 🙂
Now, let's move on to continuous integration (CI) services. Any analyzer can be integrated into them without any serious issues. This requires creating a separate stage in the pipeline, usually following the build and unit tests. This is done using various console utilities. For example, PVS-Studio provides the following utilities:
- (solution analysis for C#, C++ projects on Windows)
- (compilation monitoring)
- (C++ project analysis on Linux / macOS)
- (solution analysis for C# projects on Linux / macOS)
- (Java project analysis)
- (report file converter)
To integrate analysis into CI, you need to do three things:
- Install the analyzer;
- Run the analysis;
- Deliver the results.
For example, to install PVS-Studio on Linux (Debian-based), you need to execute the following commands:
wget -q -O - https://files.viva64.com/etc/pubkey.txt
    | sudo apt-key add -
sudo wget -O /etc/apt/sources.list.d/viva64.list
  https://files.viva64.com/etc/viva64.list

sudo apt-get update -qq
sudo apt-get install -qq pvs-studio
On Windows systems, there is no way to install the analyzer from a package manager; however, it is possible to launch the analyzer from the command line:
PVS-Studio_setup.exe /verysilent /suppressmsgboxes
/norestart /nocloseapplications
Read more about deploying PVS-Studio on Windows systems **.
After installation, you need to start the analysis itself. However, it is recommended to do this only after the compilation and tests are complete. This is because static analysis typically requires twice as much time as compilation.
Since the way of launching depends on the platform and project specifics, I will show an option for C++ (Linux) as an example:
pvs-studio-analyzer analyze -j8
                            -o PVS-Studio.log
plog-converter -t errorfile PVS-Studio.log --cerr -w
The first command will perform the analysis, and the second the report to text format, outputs it to the screen, and returns a non-zero exit code in case of warnings. This mechanism is convenient for blocking the build in case of error messages. However, you can always remove the flag -w and not block the build containing warnings.
Note. Text format is inconvenient. It is provided just as an example. Note the more interesting report format — FullHtml. It allows for navigation through the code.
Read more about setting up analysis on CI in the article "" (Windows) or "" (Linux).
Well, you have set up the analyzer to work on the build server. Now, if someone pushes unverified code, the verification stage will fail, and you will be able to detect the problem. However, this is not very convenient because it is more effective to check the project not after merging branches, but before, at the pull request stage.
Overall, setting up pull request analysis is not significantly different from running analysis on CI, except for the need to obtain a list of changed files. Usually, this can be done by requesting the difference between branches using git:
git diff --name-only HEAD origin/$MERGE_BASE > .pvs-pr.listNow, you need to pass this list of files to the analyzer. For example, in PVS-Studio, this is implemented using a flag. -S:
pvs-studio-analyzer analyze -j8
                            -o PVS-Studio.log
                            -S .pvs-pr.list
You can learn more about pull request analysis **. Even if your CI isn't on the list of services mentioned in the article, you will find the general section dedicated to the theory of this type of analysis useful.
By setting up pull request analysis, you can block commits that contain warnings, thus creating a boundary that unverified code cannot cross.
This is certainly good, but it would be nice to have the ability to see all warnings in one place. Not only from the static analyzer but also from unit tests or the dynamic analyzer. For this, there are various services and plugins. For example, PVS-Studio has .
2. Integration on developers' machines
Now it’s time to install and configure the analyzer for everyday use during development. By this point, you should be familiar with most of the ways to work, so this can be considered the easiest part.
As the simplest option, developers can install the required analyzer themselves. However, this will take a lot of time and distract them from development, so you can automate this process using installers and necessary flags. For PVS-Studio, there are various . However, there are always package managers, such as Chocolatey (Windows), Homebrew (macOS), or dozens of options for Linux.
Then, you'll need to install the required plugins, for instance, for , , etc.
3. Daily use
At this stage, it's time to say a few words about ways to speed up the analyzer's work during daily use. A full analysis of the entire project takes a lot of time, but how often do we change the code all at once across the entire project? It's unlikely there exists a large-scale refactor that affects the whole codebase at once. The number of files changed at once rarely exceeds ten, so it makes sense to analyze them. For such a situation, there is Just don't be alarmed, this isn't just another tool. It's a special mode that allows you to analyze only the modified files and their dependencies, and this happens automatically after a build when you're working in an IDE with the installed plugin.
If the analyzer detects issues in the recently modified code, it will notify you on its own. For instance, PVS-Studio will alert you using a notification:
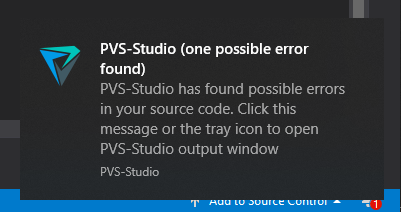
It's not enough to just tell developers to use the tool. You need to explain what it is and how it works. For example, here are articles about getting started quickly with PVS-Studio, but similar tutorials can be found for any tool you prefer:
Such articles provide all the necessary information for everyday use and do not take much time. 🙂
During the initial familiarization with the tool, we suppressed many warnings during one of the first runs. Unfortunately, static analyzers are not perfect and sometimes trigger false positives. It's usually easy to suppress them; for example, in the PVS-Studio plugin for Visual Studio, you just need to press one button:

However, you can do more than just suppress them. For example, you can report the issue to support. If a false positive can be fixed, then in future updates you may notice that the number of issues specific to your codebase decreases with every iteration.
After integration
We've now gone through all the stages of integrating static analysis into the development process. Despite the importance of configuring such tools in CI, the most crucial place to run them is actually the developer's computer. After all, a static analyzer isn't a judge, who far removed from you says that the code is not good enough. On the contrary, it’s an assistant that reminds you if you're fatigued and prompts you if you've forgotten something.
The truth is that without regular use, static analysis is unlikely to significantly simplify development. After all, its main benefit for developers lies not so much in finding complex and controversial areas of code, but in detecting them early. It’s frustrating to discover a problem when the changes have already gone for testing; not only is it unpleasant, but it's also very time-consuming. Regular static analysis reviews every change right on your computer and notifies you of suspicious areas while you work on the code.
If you or your colleagues are still unsure whether to implement a static analyzer, I suggest you now proceed to read the article "". It addresses typical concerns developers have about static analysis consuming their time and so on.
If you want to share this article with an English-speaking audience, please use the link to the translation: Maxim Zvyagintsev. .
Source: habr.com
