

Are you using Kubernetes? Ready to move your Camunda BPM instances from virtual machines, or perhaps just try running them on Kubernetes? Let's explore some common configurations and individual elements that can be tailored to your specific needs.
It is assumed that you have used Kubernetes before. If not, why not check out and run your first cluster?
Authors
- (Alastair Firth) is a Site Reliability Engineer on the Camunda Cloud team;
- (Lars Lange) is a DevOps engineer at Camunda.
In short:
 git clone https://github.com/camunda-cloud/camunda-examples.git
 cd camunda-examples/camunda-bpm-demo
 make skaffold
Alright, it probably didn't work because you don't have skaffold and kustomize installed. Well, read on!
What is Camunda BPM
Camunda BPM is an open-source platform for business process management and decision automation that unites business users and software developers. It is ideal for coordinating and bringing together people, (micro)services, or even bots! You can read more about various use cases at .
Why use Kubernetes
Kubernetes has become the de facto standard for running modern applications on Linux. By using system calls instead of simulating hardware and leveraging the kernel's capabilities for memory management and task switching, boot time and startup time are minimized. However, the greatest advantage may come from the standard API interface that Kubernetes provides for configuring the infrastructure needed for all applications: storage, networking, and monitoring. As of June 2020, it turned 6 years old, and it is arguably the second largest open-source project (after Linux). Recently, it has been actively stabilizing its features after a rapid iteration in the past few years, as this becomes critically important for production workloads around the globe.
The Camunda BPM Engine can easily connect to other applications running on the same cluster, and Kubernetes provides excellent scalability, allowing you to increase infrastructure costs only when absolutely necessary (and easily decrease them as needed).
The quality of monitoring is significantly enhanced using tools such as Prometheus, Grafana, Loki, Fluentd, and Elasticsearch, which allow for centralized viewing of all cluster workloads. Today, we will discuss how to implement the Prometheus exporter in a Java Virtual Machine (JVM).
Objectives
Let’s explore several areas where we can configure the Camunda BPM Docker image () to interact well with Kubernetes.
- Logs and metrics;
- Database connections;
- Authentication;
- Session management.
We will examine several ways to achieve these objectives and visually demonstrate the entire process.
Note: Are you using the Enterprise version? Check out and update the links to images as needed.
Workflow Development
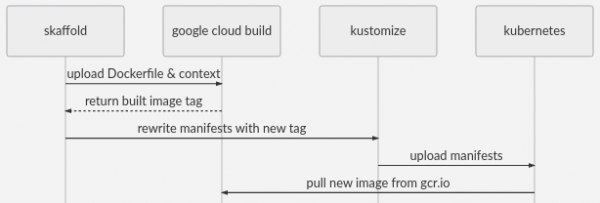
In this demonstration, we will use Skaffold to build Docker images using Google Cloud Build. It has solid support for various tools (such as Kustomize and Helm), CI tools and build tools, as well as providers of infrastructure. The file skaffold.yaml.tmpl includes configurations for Google Cloud Build and GKE, providing a very straightforward way to launch industrial-grade infrastructure.
make skaffold will upload the Dockerfile context to Cloud Build, create the image, and store it in GCR, then apply the manifests to your cluster. This is what make skaffolddoes, but Skaffold has many other capabilities.
For yaml templates in Kubernetes, we use kustomize to manage yaml overlays without branching the entire manifest, allowing you to use git pull --rebase for further improvements. It is now in kubectl and works well for such tasks.
We also use envsubst to fill in the hostname and GCP project ID in *.yaml.tmpl files. You can see how it works in makefile or just continue on.
Prerequisites
- Working cluster
- — to create custom docker images and easily deploy to GKE
- A copy of this code
- Envsubst
Workflow with manifests
If you do not wish to use kustomize or skaffold, you can refer to the manifests in generated-manifest.yaml and adapt them to a workflow of your choice.
Logs and metrics
Prometheus has become the standard for collecting metrics in Kubernetes. It occupies the same niche as AWS CloudWatch Metrics, CloudWatch Alerts, Stackdriver Metrics, StatsD, Datadog, Nagios, vSphere Metrics, and others. It has an open-source codebase and a powerful query language. Visualization will be handled by Grafana, which comes with a large number of dashboards available out of the box. These are interconnected and relatively easy to set up with .
By default, Prometheus uses a pull model /metrics, and adding sidecar containers for this is common. Unfortunately, JMX metrics are best registered within the JVM, so sidecar containers are not as effective. Let's connect the open-source JMX exporter from Prometheus to the JVM by adding it to the container image, which will provide a path /metrics on a different port.
Add the Prometheus jmx_exporter to the container
 -- images/camunda-bpm/Dockerfile
 FROM camunda/camunda-bpm-platform:tomcat-7.11.0
## Add prometheus exporter
RUN wget https://repo1.maven.org/maven2/io/prometheus/jmx/
jmx_prometheus_javaagent/0.11.0/jmx_prometheus_javaagent-0.11.0.jar -P lib/
#9404 is the reserved prometheus-jmx port
ENV CATALINA_OPTS -javaagent:lib/
jmx_prometheus_javaagent-0.11.0.jar=9404:/etc/config/prometheus-jmx.yaml
Well, that was easy. The exporter will monitor Tomcat and expose its metrics in Prometheus format at :9404/metrics
Configuring the exporter
The observant reader may wonder where the prometheus-jmx.yaml? Существует много разных вещей, которые могут работать в JVM, и tomcat — это только одна из них, поэтому экспортер нуждается в некоторой дополнительной настройке. Стандартные конфигурации для tomcat, wildfly, kafka и так далее доступны came from. We will add Tomcat as in Kubernetes, and then mount it as a volume.
First, we add the exporter configuration file to our directory platform/config/
 platform/config
 └── prometheus-jmx.yaml
Then we add downward API support (simultaneously with this in kustomization.yaml.tmpl:
 -- platform/kustomization.yaml.tmpl
 apiVersion: kustomize.config.k8s.io/v1beta1
 kind: Kustomization
 [...]
 configMapGenerator:
 - name: config
 files:
 - config/prometheus-jmx.yaml
This will add each item files[] as a configuration item in the ConfigMap. ConfigMapGenerators are great because they hash configuration data and trigger a pod restart if it changes. They also reduce the overall configuration size in the Deployment since you can mount the entire 'folder' of configuration files in one VolumeMount.
Finally, we need to mount the ConfigMap as a volume to the pod:
 -- platform/deployment.yaml
 apiVersion: apps/v1
 kind: Deployment
 [...]
 spec:
 template:
 spec:
 [...]
 volumes:
 - name: config
 configMap:
 name: config
 defaultMode: 0744
 containers:
 - name: camunda-bpm
 volumeMounts:
 - mountPath: /etc/config/
 name: config
 [...]
Great. If Prometheus is not configured for complete cleanup, you may need to tell it to clean up the pods. Prometheus Operator users can use service-monitor.yaml to get started. Explore the Service-monitor.yaml, and before proceeding.
Distributing this template to other use cases
All files we add to the ConfigMapGenerator will be available in the new directory /etc/configYou can expand this template to mount any other configuration files you need. You can even mount a new startup script. You can use to mount individual files. To update XML files, consider using instead of sed. It's already included in the image.
Logs
Great news! Application logs are already available on stdout, for example, through kubectl logs. Fluentd (it is installed by default in GKE) will redirect your logs to Elasticsearch, Loki, or your corporate logging platform. If you want to use jsonify for logs, you can follow the template above to set up .
Database
By default, the image will have an H2 database. This is not suitable for us, and we will use Google Cloud SQL with Cloud SQL Proxy—this will be needed later for internal tasks. This is a simple and reliable option if you don't have your own database setup preferences. AWS RDS offers a similar service.
Regardless of the database you choose, provided it's not H2, you will need to set the appropriate environment variables in platform/deploy.yaml. It looks something like this:
 -- platform/deployment.yaml
 apiVersion: apps/v1
 kind: Deployment
 [...]
 spec:
 template:
 spec:
 [...]
 containers:
 - name: camunda-bpm
 env:
 - name: DB_DRIVER
 value: org.postgresql.Driver
 - name: DB_URL
 value: jdbc:postgresql://postgres-proxy.db:5432/process-engine
 - name: DB_USERNAME
 valueFrom:
 secretKeyRef:
 name: cambpm-db-credentials
 key: db_username
 - name: DB_PASSWORD
 valueFrom:
 secretKeyRef:
 name: cambpm-db-credentials
 key: db_password
 [...]
Note: You can use Kustomize for deployment in various environments using overlays: .
Note: using valueFrom: secretKeyRef. Please use even during development to keep your secrets secure.
It's likely that you already have a preferred Kubernetes secrets management system. If not, here are some options: encrypt them with your cloud provider's KMS, then inject them into K8S as secrets through the CD pipeline— —works very well with Kustomize secrets. There are also other tools, such as dotGPG—they perform similar functions: , .
Ingress
Unless you decide to use local port forwarding, you will need a configured Ingress Controller. If you are not using () then you probably already know that you need to install the required annotations in ingress-patch.yaml.tmpl or platform/ingress.yamlIf you are using ingress-nginx and see the nginx ingress class with a load balancer pointing to it and an external DNS or wildcard DNS record, everything is set up. Otherwise, configure the Ingress Controller and DNS or skip these steps and leave a direct connection to the pod.
TLS
If you use or kube-lego and letsencrypt, certificates for the new ingress will be obtained automatically. Otherwise, open ingress-patch.yaml.tmpl and configure it according to your needs.
Launch!
If you followed everything written above, then the command make skaffold HOSTNAME= should launch an accessible instance at /camunda
If you haven’t exposed the ingress via a public URL, you can forward it from localhost: kubectl port-forward -n camunda-bpm-demo svc/camunda-bpm 8080:8080 to localhost:8080/camunda
Wait a few minutes until Tomcat is fully ready. Cert-manager will take some time to verify the domain name. After that, you can monitor the logs using available tools — for example, a tool like kubetail, or simply with kubectl:
kubectl logs -n camunda-bpm-demo $(kubectl get pods -o=name -n camunda-bpm-demo) -f
Next Steps
Authorization
This is more related to configuring Camunda BPM than Kubernetes, but it’s important to note that by default, authentication in the REST API is disabled. You can or use another method, such as . You can use configmaps and volumes to load xml, or xmlstarlet (see above) to edit existing files in the image, as well as either use wget or upload them via an init container and a shared volume.
Session Management
Like many other applications, Camunda BPM handles sessions in the JVM, so if you want to run multiple replicas, you can enable sticky sessions (), which will exist until the replica is gone, or set the Max-Age attribute for cookies. A more reliable solution is to deploy a Session Manager in Tomcat. Lars has on this topic, but something like:
 wget http://repo1.maven.org/maven2/de/javakaffee/msm/memcached-session-manager/
 2.3.2/memcached-session-manager-2.3.2.jar -P lib/ &&
 wget http://repo1.maven.org/maven2/de/javakaffee/msm/memcached-session-manager-tc9/
 2.3.2/memcached-session-manager-tc9-2.3.2.jar -P lib/ &&
sed -i '/^/i
<Manager className="de.javakaffee.web.msm.MemcachedBackupSessionManager"
memcachedNodes="redis://redis-proxy.db:22121"
sticky="false"
sessionBackupAsync="false"
storageKeyPrefix="context"
lockingMode="auto"
/>' conf/context.xml
Note: you can use xmlstarlet instead of sed
We used before Google Cloud Memorystore, with (supports Redis) to run it.
Scaling
If you've already figured out sessions, the first (and often the last) limitation for scaling Camunda BPM may be the connection to the database. Partial setup is available right out of the box.. We will also disable initialSize in the settings.xml file. Add and you'll be able to easily auto-scale the number of pods.
Requests and limits
In platform/deployment.yaml you'll notice that we hard-coded the resources field. This works well with HPA but may require additional configuration. A kustomize patch will suffice. See ingress-patch.yaml.tmpl and ./kustomization.yaml.tmpl
Output
We have successfully installed Camunda BPM on Kubernetes with Prometheus metrics, logs, an H2 database, TLS, and Ingress. We added jar files and configuration files using ConfigMaps and Dockerfile. We discussed data exchange with volumes and directly into environment variables from secrets. Additionally, we provided an overview of configuring Camunda for multiple replicas and an authenticated API.
Links
 github.com/camunda-cloud/camunda-examples/camunda-bpm-kubernetes
 │
 ├── generated-manifest.yaml <- manifest for use without kustomize
 ├── images
 │ └── camunda-bpm
 │ └── Dockerfile <- overlay docker image
 ├── ingress-patch.yaml.tmpl <- site-specific ingress configuration
 ├── kustomization.yaml.tmpl <- main Kustomization
 ├── Makefile <- make targets
 ├── namespace.yaml
 ├── platform
 │ ├── config
 │ │ └── prometheus-jmx.yaml <- prometheus exporter config file
 │ ├── deployment.yaml <- main deployment
 │ ├── ingress.yaml
 │ ├── kustomization.yaml <- "base" kustomization
 │ ├── service-monitor.yaml <- example prometheus-operator config
 │ └── service.yaml
 └── skaffold.yaml.tmpl <- skaffold directives
August 5, 2020, translation Alastair Firth, Lars Lange
Source: habr.com
