


Recently, a well-known company announced that it was transitioning its lineup of laptops to ARM architecture. Hearing this news, I remembered that while browsing EC2 prices on AWS, I noticed the Gravitons at very appealing prices. The catch, of course, was that they were ARM. At that time, I didn't realize that ARM was quite significant...
For me, this architecture has always been associated with mobile devices and other IoT gadgets. 'Real' servers on ARM seemed unusual, even a bit wild... However, a new thought stuck in my mind, so one weekend I decided to check what could actually be run on ARM today. I decided to start with something familiar — a Kubernetes cluster. And not just some conditional 'cluster,' but a fully-fledged one, so that it resembled what I'm used to seeing in production.
My idea was that the cluster should be accessible from the internet, run a web application, and at least have monitoring. To implement this idea, a couple (or more) of Raspberry Pi no less than model 3B+ would be needed. AWS could have been a suitable platform for the experiment, but I was specifically interested in the 'Raspberries' (which were just sitting idly). So, we will deploy a Kubernetes cluster with Ingress, Prometheus, and Grafana on them.
Preparing the 'Raspberries'
Installing the OS and SSH
I didn't put much thought into choosing the OS for installation: I simply took the latest Raspberry Pi OS Lite from . Documentation on installation is also available there, and all actions must be carried out on all nodes of the future cluster. Next, the following manipulations will be required (also on all nodes). For the cluster to function, the master must have a static IP address, while the worker nodes can have them as needed. I preferred static addresses everywhere for the sake of configuration ease.
A static address can be configured in the OS (in the file
- there is a suitable example) or by fixing the lease in the DHCP server of the router used (in my case — home router).
- The ssh-server can simply be enabled in raspi-config (
/etc/dhcpcd.confinterfacing options → ssh - After that, you can log in via SSH (the default login ispi).
, and the password is raspberry, and the password — raspberry or the one that was changed) and continue with the configurations.
Other settings
- Let's set the hostname. In my example, I will use
pi-controlandpi-worker. - Let's check that the filesystem is expanded to the entire disk (
df -h /). If necessary, it can be expanded using raspi-config. - Let's change the default user password in raspi-config.
- We will disable the swap file (this is a requirement of Kubernetes; if you're interested in details on this topic, see ):
dphys-swapfile swapoff systemctl disable dphys-swapfile - We will update the packages to the latest versions:
apt-get update && apt-get dist-upgrade -y - We will install Docker and additional packages:
apt-get install -y docker docker.io apt-transport-https curl bridge-utils iptables-persistentDuring the installation
iptables-persistentit will be necessary to save the iptables settings for ipv4, and in the file/etc/iptables/rules.v4— add rules to the chainFORWARD, like this:# Generated by xtables-save v1.8.2 on Sun Jul 19 00:27:43 2020 *filter :INPUT ACCEPT [0:0] :FORWARD ACCEPT [0:0] :OUTPUT ACCEPT [0:0] -A FORWARD -s 10.1.0.0/16 -j ACCEPT -A FORWARD -d 10.1.0.0/16 -j ACCEPT COMMIT - All that's left is to reboot.
Now everything is ready for the Kubernetes cluster installation.
Kubernetes Installation
At this stage, I purposely postponed all my and our company’s automation efforts for the K8s installation and configuration. Instead, we will use the official documentation along with (slightly supplemented with comments and abbreviations).
Let's add the Kubernetes repository:
curl -s https://packages.cloud.google.com/apt/doc/apt-key.gpg | sudo apt-key add -
cat <<EOF | sudo tee /etc/apt/sources.list.d/kubernetes.list
deb https://apt.kubernetes.io/ kubernetes-xenial main
EOF
sudo apt-get update
Next, the documentation suggests installing CRI (container runtime interface). Since Docker is already installed, we move forward and install the main components:
sudo apt-get install -y kubelet kubeadm kubectl kubernetes-cni At the stage of installing the main components, I immediately added kubernetes-cni, which is necessary for the cluster to function. And there is an important point: the package kubernetes-cni for some reason does not create the default directory for the CNI interface settings, so I had to create it manually:
mkdir -p /etc/cni/net.dTo operate the network backend, which I will discuss below, it is necessary to install the CNI plugin. I chose the familiar and understandable portmap plugin (see the full list in ):
curl -sL https://github.com/containernetworking/plugins/releases/download/v0.7.5/cni-plugins-arm-v0.7.5.tgz | tar zxvf - -C /opt/cni/bin/ ./portmapKubernetes Configuration
Node with control plane
Installing the cluster itself is quite simple. To speed up this process and check that the Kubernetes images are available, you can perform the following beforehand:
kubeadm config images pullNow we proceed to the actual installation — initializing the cluster's control plane:
kubeadm init --pod-network-cidr=10.1.0.0/16 --service-cidr=10.2.0.0/16 --upload-certsPlease note that the subnets for services and pods must not overlap with each other or with existing networks.
At the end, we will see a message indicating that everything is fine, along with instructions on how to join worker nodes to the control plane:
Your Kubernetes control-plane has initialized successfully!
To start using your cluster, you need to run the following as a regular user:
 mkdir -p $HOME/.kube
 sudo cp -i /etc/kubernetes/admin.conf $HOME/.kube/config
 sudo chown $(id -u):$(id -g) $HOME/.kube/config
You should now deploy a pod network to the cluster.
Run "kubectl apply -f [podnetwork].yaml" with one of the options listed at:
 https://kubernetes.io/docs/concepts/cluster-administration/addons/
You can now join any number of the control-plane nodes by running the following command on each as root:
 kubeadm join 192.168.88.30:6443 --token a485vl.xjgvzzr2g0xbtbs4
   --discovery-token-ca-cert-hash sha256:9da6b05aaa5364a9ec59adcc67b3988b9c1b94c15e81300560220acb1779b050
   --control-plane --certificate-key 72a3c0a14c627d6d7fdade1f4c8d7a41b0fac31b1faf0d8fdf9678d74d7d2403
Please note that the certificate-key gives access to cluster sensitive data, keep it secret!
As a safeguard, uploaded certs will be deleted in two hours; if necessary, you can use
"kubeadm init phase upload-certs --upload-certs" to reload certs afterward.
Then you can join any number of worker nodes by running the following on each as root:
kubeadm join 192.168.88.30:6443 --token a485vl.xjgvzzr2g0xbtbs4
   --discovery-token-ca-cert-hash sha256:9da6b05aaa5364a9ec59adcc67b3988b9c1b94c15e81300560220acb1779b050
Let's follow the recommendations to add the config for the user. I also recommend adding autocompletion for kubectl right away:
 kubectl completion bash > ~/.kube/completion.bash.inc
 printf "
 # Kubectl shell completion
 source '$HOME/.kube/completion.bash.inc'
 " >> $HOME/.bash_profile
 source $HOME/.bash_profile
At this stage, you can already see the first node in the cluster (though it is not ready yet):
root@pi-control:~# kubectl get no
NAME         STATUS     ROLES    AGE   VERSION
pi-control   NotReady   master   29s   v1.18.6
Network configuration
Next, as mentioned in the message after installation, you will need to install network in the cluster. The documentation offers a choice of Calico, Cilium, contiv-vpp, Kube-router, and Weave Net… Here I deviated from the official instructions and chose a variant that is more familiar and understandable to me: in host-gw mode (for more on available backends, see ).
Installing it in the cluster is quite simple. First — download the manifests:
wget https://raw.githubusercontent.com/coreos/flannel/master/Documentation/kube-flannel.yml Then change the type setting from vxlan to host-gw:
sed -i 's/vxlan/host-gw/' kube-flannel.yml… and the pod subnet — from the default value to the one specified during cluster initialization:
sed -i 's#10.244.0.0/16#10.1.0.0/16#' kube-flannel.ymlAfter that, create the resources:
kubectl create -f kube-flannel.yml Done! After a while, the first K8s node will transition to the status Ready:
NAME         STATUS   ROLES    AGE   VERSION
pi-control   Ready    master   2m    v1.18.6
Adding a worker node
You can now add a worker. To do this, on the worker node — after installing Kubernetes as described earlier — simply execute the command you received earlier:
kubeadm join 192.168.88.30:6443 --token a485vl.xjgvzzr2g0xbtbs4
    --discovery-token-ca-cert-hash sha256:9da6b05aaa5364a9ec59adcc67b3988b9c1b94c15e81300560220acb1779b050
At this point, we can consider the cluster ready:
root@pi-control:~# kubectl get no
NAME         STATUS   ROLES    AGE    VERSION
pi-control   Ready    master   28m    v1.18.6
pi-worker    Ready       2m8s   v1.18.6
I only had two Raspberry Pis on hand, so I didn't want to assign one of them only to the control plane. Therefore, I removed the automatically assigned taint from the pi-control node by running:
root@pi-control:~# kubectl edit node pi-control… and deleted the lines:
 - effect: NoSchedule
   key: node-role.kubernetes.io/master
Filling the cluster with the necessary minimum
First of all, we will need Helm. Of course, everything can be done without it, but Helm allows you to configure some components without modifying files. And in fact, it is just a binary file that "doesn't ask for much".
So, let's visit in the docs/installation section and execute the command from there:
curl -s https://raw.githubusercontent.com/helm/helm/master/scripts/get-helm-3 | bashAfter that, we add the chart repository:
helm repo add stable https://kubernetes-charts.storage.googleapis.com/Now we will install the infrastructure components according to the plan:
- Ingress controller;
- Prometheus;
- Grafana;
- cert-manager.
Ingress controller
The first component — Ingress controller — is quite easy to install and ready for use "out of the box". To do this, just go to and execute the installation command from there:
kubectl apply -f https://raw.githubusercontent.com/kubernetes/ingress-nginx/controller-v0.34.1/deploy/static/provider/baremetal/deploy.yamlHowever, at this point the Raspberry Pi started to struggle and hit disk IOPS limits. The issue is that a large number of resources are installed along with the Ingress controller, many requests are made to the API, and consequently, a lot of data gets written to etcd. In general, either the class 10 memory card is not very performant, or the SD cards simply cannot handle such load. Nevertheless, after about 5 minutes, everything started up.
A namespace was created and the controller, along with everything it needed, appeared in it:
root@pi-control:~# kubectl -n ingress-nginx get pod
NAME                                        READY   STATUS      RESTARTS   AGE
ingress-nginx-admission-create-2hwdx        0/1     Completed   0          31s
ingress-nginx-admission-patch-cp55c         0/1     Completed   0          31s
ingress-nginx-controller-7fd7d8df56-68qp5   1/1     Running     0          48s
Prometheus
The following two components are quite simple to install via Helm from the chart repo.
Let's find Prometheus, create a namespace, and install it in:
helm search repo stable | grep prometheus
kubectl create ns monitoring
helm install prometheus --namespace monitoring stable/prometheus --set server.ingress.enabled=True --set server.ingress.hosts={"prometheus.home.pi"}
By default, Prometheus requests 2 disks: one for Prometheus data and one for AlertManager data. Since the storage class is not created in the cluster, the disks will not be requested and the pods will not start. For bare metal Kubernetes installations, we usually use Ceph rbd; however, in the case of Raspberry Pi, this is a clear overkill.
Therefore, we will create a simple local storage on hostPath. The PV (persistent volume) manifests for prometheus-server and prometheus-alertmanager are combined in the file prometheus-pv.yaml downward API support (simultaneously with this in . The directory for the PV must be pre-created on the disk of the node to which we want to bind Prometheus: in the example, it is specified nodeAffinity by hostname pi-worker and directories have been created on it. /data/localstorage/prometheus-server and /data/localstorage/prometheus-alertmanager.
We download (clone) the manifest and add it to Kubernetes:
kubectl create -f prometheus-pv.yamlAt this stage, I encountered the problem of ARM architecture for the first time. Kube-state-metrics, which is installed by default in the Prometheus chart, refused to start. It displayed the error:
root@pi-control:~# kubectl -n monitoring logs prometheus-kube-state-metrics-c65b87574-l66d8
standard_init_linux.go:207: exec user process caused "exec format error"
The issue is that the CoreOS image is used for kube-state-metrics, which is not built for ARM:
kubectl -n monitoring get deployments.apps prometheus-kube-state-metrics -o=jsonpath={.spec.template.spec.containers[].image}
quay.io/coreos/kube-state-metrics:v1.9.7
I had to do a bit of Googling and find, for example, . To use it, we will update the release, specifying which image to use for kube-state-metrics:
helm upgrade prometheus --namespace monitoring stable/prometheus --set server.ingress.enabled=True --set server.ingress.hosts={"prometheus.home.pi"} --set kube-state-metrics.image.repository=carlosedp/kube-state-metrics --set kube-state-metrics.image.tag=v1.9.6We check that everything has started:
root@pi-control:~# kubectl -n monitoring get po
NAME                                             READY   STATUS              RESTARTS   AGE
prometheus-alertmanager-df65d99d4-6d27g          2/2     Running             0          5m56s
prometheus-kube-state-metrics-5dc5fd89c6-ztmqr   1/1     Running             0          5m56s
prometheus-node-exporter-49zll                   1/1     Running             0          5m51s
prometheus-node-exporter-vwl44                   1/1     Running             0          4m20s
prometheus-pushgateway-c547cfc87-k28qx           1/1     Running             0          5m56s
prometheus-server-85666fd794-z9qnc               2/2     Running             0          4m52s
Grafana and cert-manager
To set up graphs and dashboards Grafana:
helm install grafana --namespace monitoring stable/grafana --set ingress.enabled=true --set ingress.hosts={"grafana.home.pi"}At the end of the output, we will be shown how to obtain a password for access:
kubectl get secret --namespace monitoring grafana -o jsonpath="{.data.admin-password}" | base64 --decode ; echoTo order certificates, we will install cert-manager. For its installation, we will refer to , which provides the appropriate commands for Helm:
helm repo add jetstack https://charts.jetstack.io

helm install
  cert-manager jetstack/cert-manager
  --namespace cert-manager
  --version v0.16.0
  --set installCRDs=true
For self-signed certificates for home use, this is quite sufficient. However, if you need to obtain the same Let’s Encrypt, it is necessary to additionally configure a cluster issuer. Details on this can be found in our article "».
I opted for the version from , deciding that the staging version of LE would be sufficient. We change the email in the example, save it to a file, and add it to the cluster ():
kubectl create -f cert-manager-cluster-issuer.yamlNow we can order a certificate, for example, for Grafana. For this, a domain and external access to the cluster are required. I have a domain, and I configured port forwarding for 80 and 443 on my home router in accordance with the ingress-controller service created:
kubectl -n ingress-nginx get svc
NAME                                 TYPE        CLUSTER-IP     EXTERNAL-IP   PORT(S)                      AGE
    ingress-nginx-controller             NodePort    10.2.206.61            80:31303/TCP,443:30498/TCP   23d
Port 80 is in this case translated to 31303, while 443 is translated to 30498. (Ports are generated randomly, so yours will be different.)
Here is an example certificate ():
apiVersion: cert-manager.io/v1alpha2
kind: Certificate
metadata:
  name: grafana
  namespace: monitoring
spec:
  dnsNames:
    - grafana.home.pi
  secretName: grafana-tls
  issuerRef:
    kind: ClusterIssuer
    name: letsencrypt-staging
We add it to the cluster:
kubectl create -f cert-manager-grafana-certificate.yamlAfter this, an Ingress resource will appear through which Let’s Encrypt validation will occur:
root@pi-control:~# kubectl -n monitoring get ing
NAME                        CLASS    HOSTS                        ADDRESS         PORTS   AGE
cm-acme-http-solver-rkf8l      grafana.home.pi      192.168.88.31   80      72s
grafana                        grafana.home.pi      192.168.88.31   80      6d17h
prometheus-server              prometheus.home.pi   192.168.88.31   80      8d
After validation passes, we will see that the resource certificate is ready, and in the above-mentioned secret grafana-tls — the certificate and key. You can check who issued the certificate right away:
root@pi-control:~# kubectl -n monitoring get certificate
NAME      READY   SECRET        AGE
grafana   True    grafana-tls   13m

root@pi-control:~# kubectl -n monitoring get secrets grafana-tls -ojsonpath="{.data['tls.crt']}" | base64 -d | openssl x509 -issuer -noout
issuer=CN = Fake LE Intermediate X1
Let's return to Grafana. We will need to make a few adjustments to its Helm release, changing the settings for TLS according to the created certificate.
To do this, we download the chart, edit it, and update from the local directory:
helm pull --untar stable/grafana Edit the file grafana/values.yaml TLS parameters:
  tls:
    - secretName: grafana-tls
      hosts:
        - grafana.home.pi
Here you can also configure the installed Prometheus as a datasource:
datasources:
  datasources.yaml:
    apiVersion: 1
    datasources:
    - name: Prometheus
      type: prometheus
      url: http://prometheus-server:80
      access: proxy
      isDefault: true
Now we update the Grafana chart from the local directory:
helm upgrade grafana --namespace monitoring ./grafana --set ingress.enabled=true --set ingress.hosts={"grafana.home.pi"} Check that the Ingress grafana has added port 443 and has access via HTTPS:
root@pi-control:~# kubectl -n monitoring get ing grafana
NAME CLASS HOSTS ADDRESS PORTS AGE
grafana  grafana.home.pi 192.168.88.31 80, 443 63m

root@pi-control:~# curl -kI https://grafana.home.pi
HTTP/2 302
server: nginx/1.19.1
date: Tue, 28 Jul 2020 19:01:31 GMT
content-type: text/html; charset=utf-8
cache-control: no-cache
expires: -1
location: /login
pragma: no-cache
set-cookie: redirect_to=; Path=/; HttpOnly; SameSite=Lax
x-frame-options: deny
strict-transport-security: max-age=15724800; includeSubDomains
To demonstrate Grafana in action, you can download and add a . Here’s what it looks like:
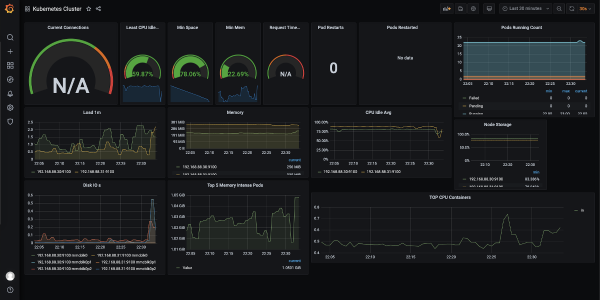
I also recommend adding a dashboard for node exporter: it will show in detail what is happening with the "raspberries" (CPU load, memory usage, network, disk, etc.).
After that, I believe that the cluster is ready to accept and run applications!
Note about the assembly
To build applications for the ARM architecture, there are at least two options. First, you can build directly on an ARM device. However, after observing the current utilization of two Raspberry Pis, I realized they can't even handle the building process. Therefore, I ordered a new Raspberry Pi 4 (which is more powerful and has 4 GB of RAM) — I plan to build on it.
The second option is to build a multi-architecture Docker image on a more powerful machine. For this, there is If the application is in a compiled language, cross-compilation for ARM will be necessary. I won't describe all the settings for this path, as it would require a separate article. By implementing this approach, you can achieve 'universal' images: Docker running on an ARM machine will automatically pull the corresponding architecture image.
Conclusion
The conducted experiment exceeded all my expectations: the 'vanilla' Kubernetes with the necessary base runs quite well on ARM, and only a couple of nuances arose during its configuration.
The Raspberry Pi 3B+ handle the CPU load, but their SD cards are clearly a bottleneck. Colleagues suggested that in some versions there is a possibility to boot from USB, to which an SSD can be connected: then the situation is likely to improve.
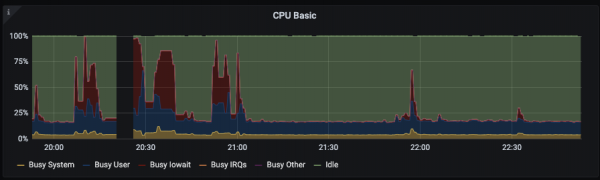
Here is an example of CPU load during the installation of Grafana:
For experiments and 'just to try', in my opinion, a Kubernetes cluster on 'Raspberries' conveys the experience of operation much better than the same Minikube, because all cluster components are installed and operate 'fully-fledged'.
In the future, there is an idea to add the entire CI/CD cycle to the cluster, fully implemented on Raspberry Pi. I would also appreciate it if someone could share their experience in setting up K8s on AWS Graviton.
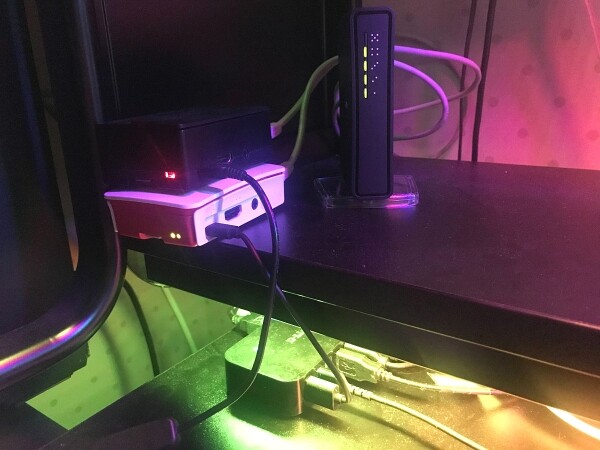
P.S. Yes, 'production' might be closer than I thought:
P.P.S.
Also read in our blog:
- «».
Source: habr.com
