


Daria Vilkova's Report for Zabbix Meetup Online
I would like to introduce you to a monitoring tool for PostgreSQL and operating systems, which is being developed by our company using Zabbix.
We chose Zabbix as our monitoring solution a long time ago because it is an open-source platform supported by an active community, which is very popular in Russia.
We created an active agent — Mamonsu, which provided more flexible monitoring than standard tools at the time, allowing for metric collection and transmission to the Zabbix Server. In our company, Mamonsu is used for auditing.
Mamonsu
Mamonsu is an active agent (Zabbix Trapper) for monitoring PostgreSQL and operating systems. Mamonsu (written in Python) allows you to configure PostgreSQL and operating system monitoring parameters in five minutes.
Mamonsu comes with additional tools:
- mamonsu tune — a command that edits configuration parameters in the PostgreSQL configuration file for the machine on which the Mamonsu agent is installed.
- mamonsu report — a command that generates reports on the operating system and PostgreSQL.
Mamonsu is installed on the DBMS server, collects information, compiles it into JSON, and sends it for visualization to the Zabbix Server, where a template for its metrics should exist.
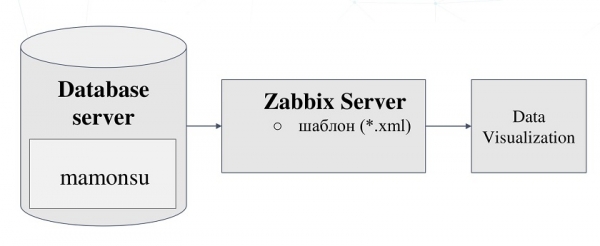
Mamonsu Workflow
Mamonsu Features
- Effective Work with PostgreSQL. A constant connection to PostgreSQL is the main advantage of Mamonsu. The maximum number of connections equals the maximum number of databases it connects to.
- Scalability. Mamonsu is fully "plugin-based," and thanks to the fixed structure of each plugin and the relative simplicity of Python, new plugins can be easily written or standard plugins can be modified, i.e., metric collection parameters.
- Wide Coverage of Monitoring Metrics for PostgreSQL, including metrics from specific extensions.
- Quick Start, availability "out of the box".
- Export of templates and configuration files, as well as loading to Zabbix Server.
- Cross-Platform Compatibility, which is important for our clients using various Linux distributions, including domestic ones.
- BSD-clause license.
Currently, we offer a variety of plugins and strive to add something new in each subsequent version.
- 14 plugins for PostgreSQL,
- 8 plugins for Linux OS,
- 4 plugins for Windows OS.
Mamonsu collects over 110 metrics for PostgreSQL and operating systems:
- 70 metrics for PostgreSQL,
- 40 metrics for Linux OS,
- 8 metrics for Windows OS.
Key metrics include database availability, the number of connections, database size, checkpoints, read/write speed, locks, number of autovacuum processes, and WAL generation speed. A complete list of available metrics and detailed descriptions of all tools are available at the GitHub site.
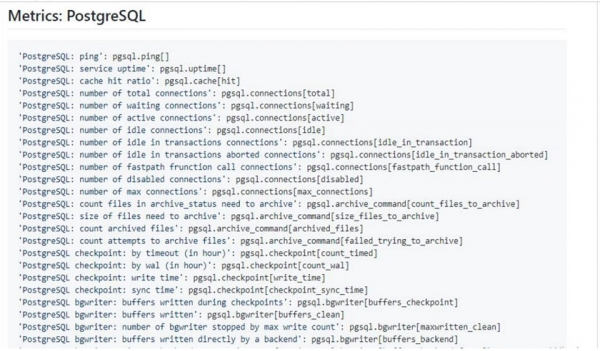
The list of available metrics is on the GitHub site
Running Mamonsu in 5 minutes
You can set up PostgreSQL and operating system monitoring with Mamonsu in just 5 minutes by following 5 simple steps.
- Installing Mamonsu. You can compile Mamonsu from source or use the available packages.
$ git clone ... && cd mamonsu && python setup.py
build && python setup.py install
- Configuring connections. You need to specify the connection parameters for PostgreSQL and Zabbix Server in the agent.conf file.
/etc/mamonsu/agent.conf
- Exporting the template to Zabbix Server.
$ mamonsu zabbix template export
/usr/share/mamonsu/example.xml
- Adding a network node to Zabbix Server. The exported template will be automatically linked to the new network node on the Zabbix Server.
$ mamonsu zabbix host create mamonsu-demo
- Start.
$ service mamonsu start
Development directions for Mamonsu
As part of the development of Mamonsu, we plan to enhance metrics and create new plugins, such as a plugin for monitoring the size of individual tables. We also plan to improve and create additional tools, as well as expand auto-configuration capabilities via the command mamonsu tune.
PostgreSQL monitoring module as part of Zabbix Agent 2
For connecting to PostgreSQL, we use a fast and popular driver (PG driver and toolkit for Go).
Currently, we use two interfaces: Exporter, which calls the handler by key, and Configurator for Zabbix Agent 2, which reads and checks the connection parameters to the server specified in the configuration file.
We have optimized the performance of the DBMS by grouping metrics and using a handler for metrics and groups of metrics, as well as using metric groups in JSON as dependent variables (dependency items) and low-level discovery (discovery rules).
Key Features
- maintaining a persistent connection to PostgreSQL between checks;
- support for flexible polling intervals;
- compatibility with PostgreSQL versions starting from 10 and Zabbix Server starting from version 4.4;
- the ability to connect and monitor multiple PostgreSQL instances simultaneously, as Zabbix Agent 2 allows for the creation of multiple sessions.
Connection parameter levels for PostgreSQL
There are three available levels of connection parameters for PostgreSQL, i.e., tasks and settings:
- Global,
- Sessions,
- Macros.
Global parameters are set at the agent level, while Session and Macros parameters define the database connection parameters.
PostgreSQL connection parameters — Sessions are specified in the file zabbix_agent2.conf.
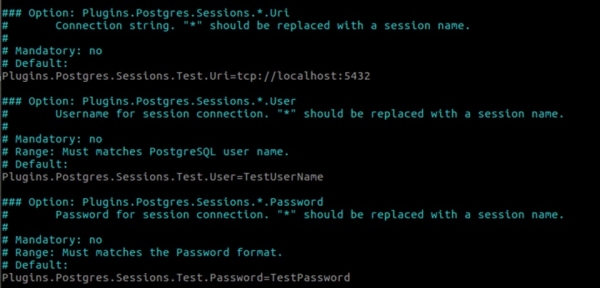
PostgreSQL connection parameters — Sessions
- After the keyword Sessions a unique session name is specified, which must be included in the key (template).
- Parameters URI and UserName is mandatory for each session.
- If the database name is not specified, a common default database name is used for all sessions for PostgreSQL, which is also defined in the configuration file.
- PostgreSQL connection parameters — Macros are defined in the metric key in the template (similarly to the method used in Zabbix Agent 1), i.e., created in the template and then indicated as parameters in the key. In this case, the sequence of macros is fixed, meaning, for example, URI it is always specified first.
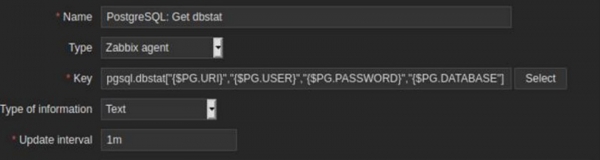
PostgreSQL connection parameters — Macros
The PostgreSQL monitoring module includes over 95 metrics, allowing for a fairly wide range of PostgreSQL parameters, including:
- the number of connections,
- the size of databases,
- archiving of WAL files,
- checkpoints,
- the number of "bloated" tables,
- replication status,
- replica lag.
PostgreSQL metrics are not informative without operating system parameters. However, Zabbix Agent 2 can already collect operating system parameters, so to get a complete picture, simply connect the necessary templates to the network node.
Handler
A handler is the main unit of the module in which the query itself is executed and which allows for metrics retrieval.
To obtain a simple metric:
- Create a file to collect a new metric:
zabbix/src/go/plugins/postgres/handler_uptime.go
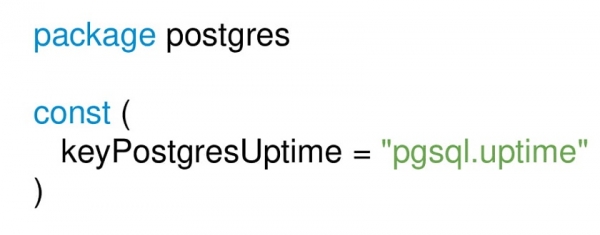
- Import the package and specify the unique key(s) for metrics:
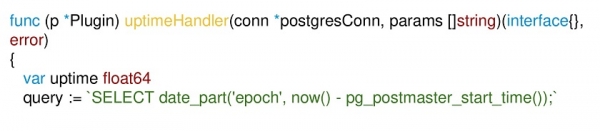
- Create a handler with the query, i.e., initialize a variable that will hold the result:
- Execute the query:
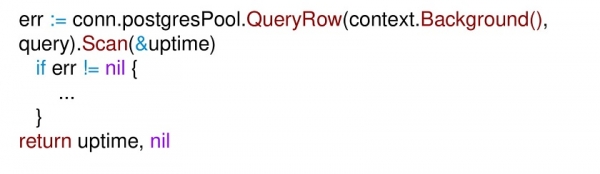
It is necessary to check the query for errors, after which the result will be captured by the Zabbix Agent 2 process.
- Register the key for the new metric:
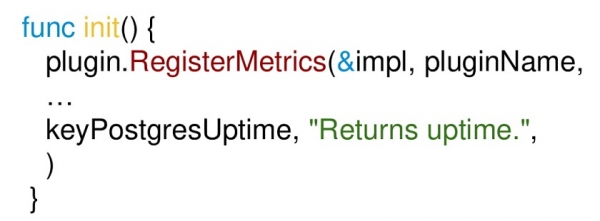
After registering the metric, you can rebuild the agent with the new metric.
The module is available starting from Zabbix 5.0 on the website. . In this version of Zabbix, parameters are set separately via host and port. In Zabbix version 5.0.2, which will be released soon, the connection parameters will be combined into a single URI.
Thank you for your attention!
Useful links
Source: habr.com
