

This post will describe the setup of ELK and SIEM dashboard visualization in ELK.
The article is divided into the following sections:
1- Overview of ELK SIEM
2- Default Dashboards
3- Creating Your First Dashboards
Table of contents for all posts.
- Integration with WAZUH
- Alerting
- Reporting
- Case Management
1- Overview of ELK SIEM
ELK SIEM was recently added to the elk stack in version 7.2 on June 25, 2019.
This SIEM solution, created by elastic.co, is designed to make a security analyst's life much easier and less tedious.
In our version of the work, we decided to create our own SIEM and pick our own dashboard.
But we believe it is important to first explore ELK SIEM.
1.1- Host Events Section
First, we will look at the host section. The host section will allow you to see events generated at the endpoint itself.
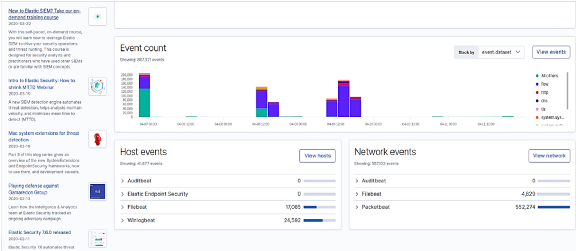
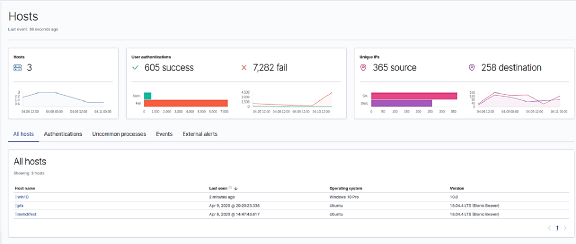
After clicking on the hosts view, you should see something like this. As you can see, three hosts are connected to this computer:
1 Windows 10.
2 Ubuntu Server 18.04.
We have several displayed visualizations, each showing different types of events.
For example, the one in the middle shows login data for all three machines.
This volume of data that you see here was collected over five days. This explains the large number of failed and successful logins. You will likely have a small number of logs, so don't worry.
1.2- Network Events Section
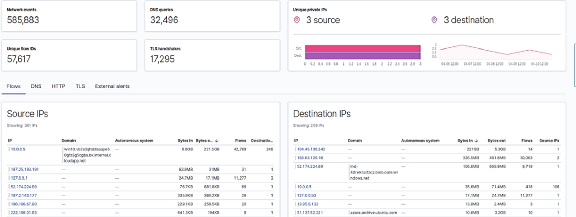
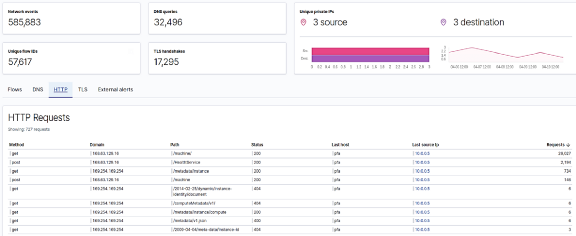
Moving to the network section, you should see something like this. This section will allow you to closely monitor everything happening in your network, from HTTP / TLS traffic to DNS traffic and external event alerts.
2- Default Dashboards
To make life easier for users, the developers at elastic.co created a default dashboard officially supported by ELK. Our bits were no exception to this rule. Here I will take the default Packetbeat dashboard as an example.
If you have correctly completed step two of the article, you should have a dashboard set up that is waiting for you. So, let's get started.
On the left tab of Kibana, select the dashboard icon. This is the third one counting from the top.
Enter the name of the share in the search tab
If there are multiple modules in the bit, a control panel will be created for each of them. However, only the one with the active module will display non-empty data.
Select the one that has the name of your module.
This is the main template PacketBeat.
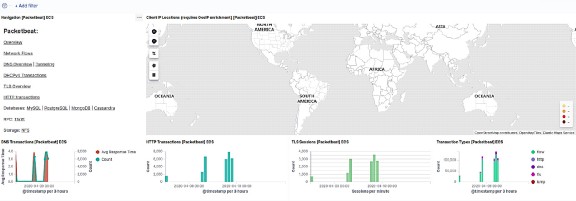
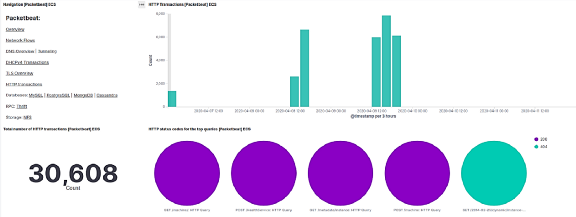
This is the network traffic control panel. It will inform us about incoming and outgoing packets, the sources and destinations of IP addresses, as well as providing a lot of useful information for the security center analyst.

3 — Creating Your First Dashboards
3-1- Basic Concepts
A- Types of Dashboards:
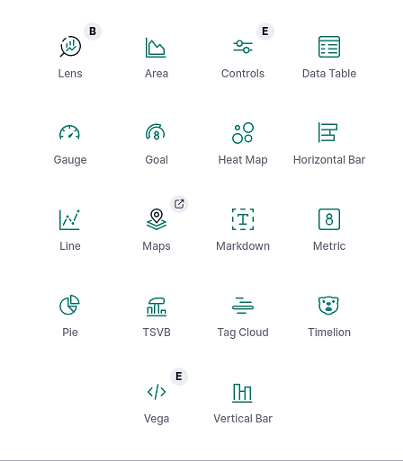
These are various types of visualizations that you can use to visualize your data.
for example, we have:
- Histogram
- Map
- Markdown Widget
- Pie Chart
B- KQL (Kibana Query Language):
This is the language used in Kibana for convenient data searching. It allows you to check if certain data exists, among many other useful functions. To learn more, you can explore the information at this link
This is an example of a request to search for a host running Windows 10 Pro.

C- Filters:
This feature will allow you to filter specific parameters, such as hostname, code, or event ID, etc. Filters significantly enhance the investigation phase in terms of the time and effort spent on searching for evidence.
D- The First Visualization:
Let's create a visualization for MITRE ATT&CK.
First, we need to go to Dashboard → Create new dashboard → create new → Pie dashboard
Set the type for the index pattern, then touch the name of your bit.
Press Enter. By this point, you should see a green donut.
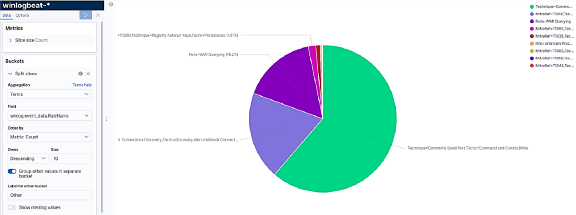
In the Buckets tab on the left you will find:
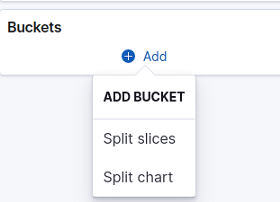
— Split slices will divide the donut into different parts based on data spread.
— Split Chart will create another donut next to this one.
We will use split slices.
We will visualize our data based on the term we selected. In this case, the term will refer to MITRE ATT&CK.
In Winlogbeat, the field that will provide us with this information is called:
winlog.event_data.RuleNameWe will set the count metric to order events based on the number of occurrences.
Enable the 'Group other values into a separate segment' feature.
This will be convenient if the terms you selected have many different meanings originating from the rhythm. It helps to visualize the other data as a whole. This will give you an idea of the percentage of other events.
Now that we have completed the data tab setup, let's move to the options tab.
You need to do the following:
** Remove the donut chart so a full circle appears in the visualization.
** Choose a legend position that you like. In this case, we will display them to the right.
** Set the display values to appear next to their segment for easier reading, while leaving the others at default.
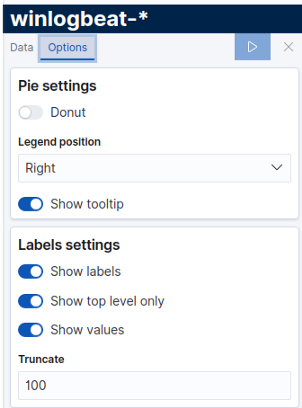
Truncation determines how much you want to display from the event name.
Set the starting time for the visualization and then click the blue square.
You should end up with something like this:
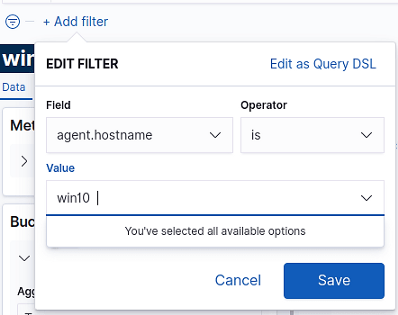
You can also add a filter to your visualization to filter a specific host you want to check or any settings that you think would be useful for your goal. The visualization will only show data that matches the rule placed in the filter. In this case, we'll display data from MITER ATT & CK that comes only from a host named win10.
3–2- Creating Your First Dashboard:
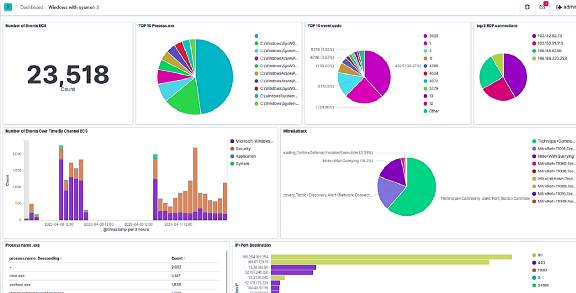
A dashboard is a collection of multiple visualizations. Your dashboards should be clear, understandable, and contain useful and deterministic data. Here’s an example of dashboards that we created from scratch for winlogbeat.
Thank you for your time. I hope this article was helpful to you. If you want more detailed information on the topic, we recommend visiting .
Telegram chat on Elasticsearch:
Source: habr.com
