

We will explore the concept of Kubernetes monitoring, introduce the Prometheus tool, and discuss alerting.
The topic of monitoring is extensive and cannot be fully covered in a single article. The goal of this text is to provide an overview of the tools, concepts, and approaches.
The material of this article is a summary of . If you want to undergo complete training, enroll in the course on .

What to Monitor in a Kubernetes Cluster
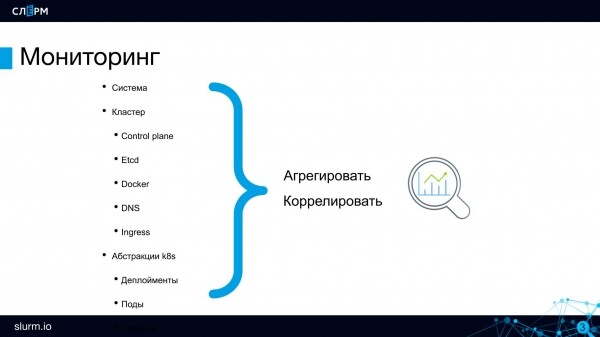
Physical servers. If the Kubernetes cluster is deployed on your own servers, it is crucial to monitor their health. Zabbix handles this task; if you are already using it, there is no need to abandon it, as there will be no conflicts. Zabbix is responsible for monitoring the state of our servers.
Now let's move on to cluster-level monitoring.
Control Plane components: API, Scheduler, and others. At the very least, you need to ensure that the API servers or etcd are operational. Etcd can provide a lot of metrics: regarding the disks it runs on, the health of its cluster, and more.
Docker has been around for a long time, and its problems are well known: numerous containers cause hangs and other issues. Therefore, it is also worth monitoring Docker as a system, at least for availability.
DNS. If DNS fails in the cluster, the entire service Discovery will fail as well, and service calls from pods to pods will stop working. In my experience, such issues have not occurred; however, this does not mean that DNS health should not be monitored. Delays in requests and some other metrics can be tracked with CoreDNS.
Ingress. It is necessary to monitor the availability of ingress points (including the Ingress Controller) as entry points to the project.
We have reviewed the main components of the cluster—now let’s delve deeper, to the level of abstractions.
It may seem that applications run in pods, which means they need to be monitored, but that's not actually the case. Pods are ephemeral: today they operate on one server, tomorrow on another; today there are 10 of them, tomorrow just 2. Therefore, nobody monitors just the pods. In a microservices architecture, it's more important to monitor the availability of the application as a whole. Specifically, checking the accessibility of service endpoints: is anything working at all? If the application is accessible, then what happens behind it, how many replicas are currently running—these are secondary concerns. There is no need to track individual instances.
At the final level, you need to monitor the operation of the application itself, capturing business metrics: the number of orders, user behavior, and so on.
Prometheus
The best system for monitoring a cluster is . I don’t know of any tool that can match Prometheus in terms of quality and ease of use. It’s well-suited for flexible infrastructures, so when people talk about 'Kubernetes monitoring', they usually mean Prometheus.
There are a couple of options to start working with Prometheus: you can deploy standard Prometheus or use Prometheus Operator with Helm.
- Standard Prometheus. It works well, but you need to configure it using ConfigMap—essentially writing text configuration files, as we did previously before microservices architecture.
- Prometheus Operator is a bit more complex in internal logic but easier to work with: it has separate objects, abstractions are added to the cluster, which makes them much more convenient to monitor and configure.
To get familiar with the product, I recommend starting with standard Prometheus. You will have to configure everything through a config file, but this will be beneficial: you will understand how everything relates and how it's set up. With Prometheus Operator, you immediately step up to a higher abstraction, but if you want to dig deeper, you can do that as well.
Prometheus is well integrated with Kubernetes: it can access the API Server and interact with it.
Prometheus is popular; therefore, it is supported by a large number of applications and programming languages. Support is necessary since Prometheus has its own metrics format, and to transmit this, either a library within the application or a ready-made exporter is required. There are quite a few such exporters. For instance, there is a PostgreSQL Exporter: it takes data from PostgreSQL and converts it into the Prometheus format so that Prometheus can work with it.
Prometheus Architecture
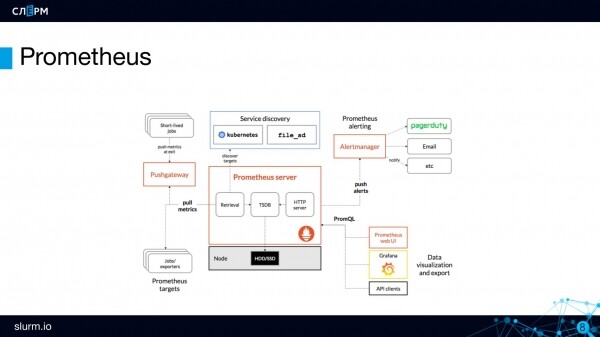
Prometheus Server is the server component, the brain of Prometheus. Here metrics are stored and processed.
Metrics are stored in a time series database (TSDB). TSDB is not a separate database, but rather a package written in Go that is embedded in Prometheus. Roughly speaking, everything is contained in a single binary.
Do not store data in TSDB for too long
Prometheus infrastructure is not suitable for long-term storage of metrics. By default, the storage duration is 15 days. This limit can be exceeded, but keep in mind: the more data you store in the TSDB and the longer you do so, the more resources it will consume. Storing historical data in Prometheus is considered poor practice.
If you have massive traffic, with the number of metrics reaching hundreds of thousands per second, it is better to limit their storage either by disk capacity or by duration. Typically, TSDB retains "hot data," metrics that are only a few hours old. For longer storage, external data warehouses suitable for this purpose are used, such as InfluxDB, ClickHouse, and so on. I've seen more positive reviews about ClickHouse.
Prometheus Server operates on the pullmodel: it fetches metrics from the endpoints we provided. We specified: "fetch from the API Server," and it goes there every n seconds to retrieve metrics.
For objects with a short lifespan (such as a job or cron job), which may appear between scraping intervals, there is a component called Pushgateway. Metrics from short-lived objects are pushed here: a job starts, performs an action, sends metrics to the Pushgateway, and then ends. After a while, Prometheus will periodically go and collect these metrics from the Pushgateway.
To configure notifications in Prometheus, there is a separate component called AlertmanagerAlert rules are crucial in this context. For example, you need to create an alert if the API servers go down. When the event triggers, the alert is sent to the alert manager for further dispatch. The alert manager has flexible routing settings: one group of alerts can be sent to the admins' Telegram chat, another to the developers' chat, and a third to the infrastructure chat. Notifications can come via Slack, Telegram, email, and other channels.
Lastly, let me tell you about Prometheus's killer feature — Discovering. When working with Prometheus, you don't need to specify the exact addresses of the objects to monitor; just their type will suffice. That is, you don't have to say, "here's the IP address, here's the port — monitor this"; instead, you need to define the principles for finding these objects (targets — targets). Prometheus automatically pulls in the necessary objects based on which ones are currently active and adds them to monitoring.
This approach fits well with the structure of Kubernetes, where everything is dynamic: today there are 10 servers, tomorrow there are 3. To avoid specifying the server's IP address every time, you define how to find it once — and Discovering will handle it.
The Prometheus language is called PromQL. This language allows you to retrieve values of specific metrics and then transform them, building analytical insights based on them.
https://prometheus.io/docs/prometheus/latest/querying/basics/

Simple query:

    container_memory_usage_bytes

Mathematical operations:

    container_memory_usage_bytes / 1024 / 1024

Built-in functions:

    sum(container_memory_usage_bytes) / 1024 / 1024

Query refinement:

    100 - avg by (instance) (rate(node_cpu_seconds_total{mode="idle"}[5m]) * 100)
Prometheus Web Interface
Prometheus has its own fairly minimalist web interface. It's suited mainly for debugging or demonstration purposes.
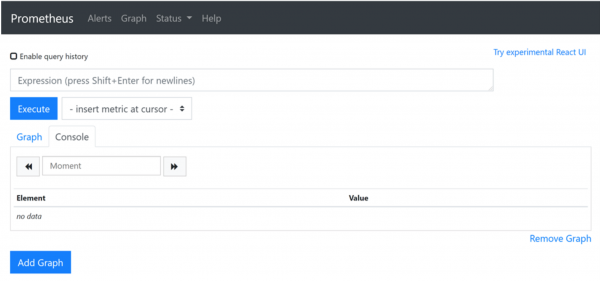
In the Expression field, you can write queries using PromQL.
In the Alerts tab, you will find alert rules, and they have three statuses:
- inactive — if the alert is currently inactive, meaning everything is fine and it hasn't triggered;
- pending — this is when the alert has triggered, but the dispatch hasn't occurred yet. A delay is set to compensate for network flapping: if the designated service comes up within a minute, there is no need to raise an alarm yet;
- firing — this is the third status, when the alert is active and sending out messages.
In the Status menu, you can access information about what Prometheus is all about. There is also a transition to the targets we discussed earlier.
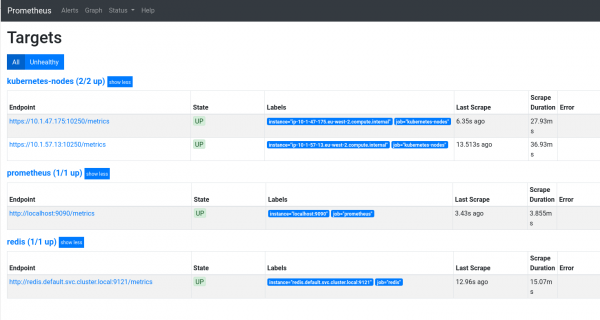
For a more detailed overview of the Prometheus interface, see .
Integration with Grafana
In the Prometheus web interface, you won't find beautiful and understandable graphs that provide insights into the state of the cluster. To generate these, Prometheus integrates with Grafana. This results in dashboards like these.
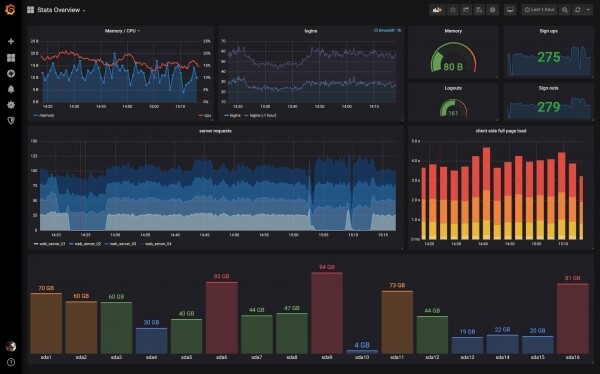
Setting up integration between Prometheus and Grafana is quite simple; you can find instructions in the documentation: , and I will conclude here.
In the next articles, we will continue the monitoring topic: we will discuss log collection and analysis using Grafana Loki and alternative tools.
Author: Marsel Ibryaev, certified Kubernetes administrator, practicing engineer at , speaker and course developer at Slyrm.
Source: habr.com
