

Everyone loves alerts.
Of course, it's much better to receive a notification when something has happened (or been fixed) than to sit and watch graphs in search of anomalies.
And there are quite a few tools created for this purpose. Alertmanager from the Prometheus ecosystem and vmalert from the VictoriaMetrics product group. Zabbix notifications and alerts in Grafana. Custom bash scripts and Telegram bots that periodically ping a URL and notify if something is wrong. A lot of options.
In our company, we also used different solutions until we hit the complexity, or rather, the impossibility of creating complex, composite alerts. What we wanted and what we eventually did is below. TLDR: This led to the emergence of the open source project
For quite a while, we were doing fine with alerts configured in Grafana. Yes, this isn't the best approach. It's always recommended to use some specialized solutions like Alertmanager. We've looked into migrating more than once. Then gradually, we wanted more.
Saying when a certain graph has dropped/risen by XX% and has stayed there for N minutes compared to the previous period of M hours? This seems possible to implement with Grafana or Alertmanager, but quite not straightforward. (Or maybe it's not possible; I can't say for sure right now.)
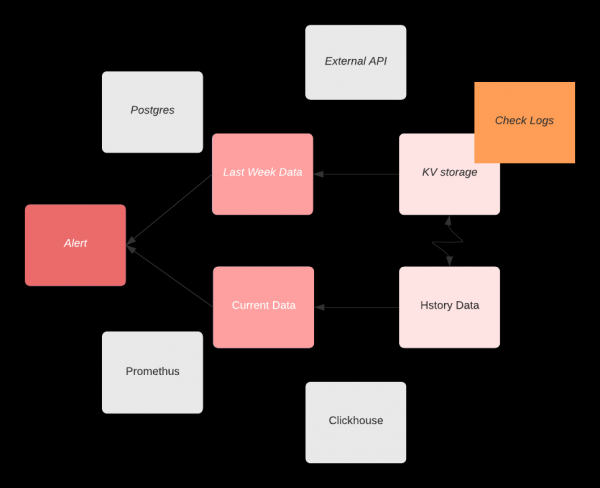
Everything becomes even more complicated when the alert decision needs to be based on data from different sources. A real-life example:
We check data from two Clickhouse databases, then compare it with some data from Postgres, and make a decision about the alert. Signal or cancel.
We have accumulated quite a few such wishes that made us think about our own solution. So we tried to compile the first list of requirements/features for this yet-to-be-created service.
to query different data sources. For example, Prometheus, Clickhouse, Postgres.
to send alerts to various channels — Telegram, Slack, etc.
in the process of consideration, it became clear that we wanted not a declarative description, but the ability to write scripts.
to schedule script executions.
easy script updates without restarting the service.
the ability to somehow extend functionality without recompiling the service from source code.
This list is approximate and most likely not very accurate. Some points changed, some were dropped. Just like usual.
This is actually how the story of Balerter began.

I'll briefly describe what we have achieved and how it works. (Yes, of course, this is not the final version. There are many plans for product development. I'll just focus on today.)
Initially, a check is performed: does the client device support power via PoE? A voltage of 2.8 to 10 volts is supplied, and the input resistance is determined. If the results obtained are satisfactory for powering via PoE, the power device proceeds to the next stage.
You write a script in Lua, where you explicitly send requests (to Prometheus, Clickhouse, etc.). You receive responses, process and compare them somehow. After that, you turn some alert on or off. Balerter will send notifications to the channels you configured (Email, Telegram, Slack, etc.). The script runs at a specified interval. And… that's basically it.)
It's best illustrated with an example:
-- @interval 10s
-- @name script1

local minRequestsRPS = 100

local log = require("log")
local ch1 = require("datasource.clickhouse.ch1")

local res, err = ch1.query("SELECT sum(requests) AS rps FROM some_table WHERE date = now()")
if err ~= nil then
    log.error("Clickhouse 'ch1' query error: " .. err)
    return
end

local resultRPS = res[1].rps

if resultRPS < minRequestsRPS then
    alert.error("rps-min-limit", "Requests RPS are very small: " .. tostring(resultRPS))
else
    alert.success("rps-min-limit", "Requests RPS ok")
end
What's happening here:
we specify that this script should run every 10 seconds
we specify the name of the script (for the API, for logging, for use in tests)
we import the logging module
we import the module to access Clickhouse named
ch1(the connection itself is configured in the config)we send a request to Clickhouse
in case of an error — we log the message and exit
we compare the query result with a constant (in a real-life example, we could get this value, for instance, from a Postgres database)
we turn the alert with the ID
rps-min-limityou will receive a notification if the alert status changes
The example is quite simple and understandable. However, in real life, scripts can be quite elaborate and complicated. It's easy to get confused and make mistakes.
Therefore, the logical desire arose — to have the ability to write tests for your scripts. And this feature appeared in version v0.4.0.
Script Testing
Example test for our script from the example above:
-- @test script1
-- @name script1-test

test = require('test')

local resp = {
    {
        rps = 10
    }
}

test.datasource('clickhouse.ch1').on('query', 'SELECT sum(requests) AS rps FROM some_table WHERE date = now()').response(resp)

test.alert().assertCalled('error', 'rps-min-limit', 'Requests RPS are very small: 10')
test.alert().assertNotCalled('success', 'rps-min-limit', 'Requests RPS ok')
Step by step:
we specify the name of the script for which the test is written
the name of the test (for logs)
we import the testing module
We specify what result should be returned for a certain query to ClickHouse
ch1We check that the error alert rps-min-limit was triggered with the specified message
We verify that the alert rps-min-limit was not disabled (success)
What else can Balerter do?
I will touch upon the most important features of Balerter, in my opinion. You can take a detailed look at the official website
fetch data from
clickhouse
postgres
mysql
prometheus
loki
send notifications to channels
slack
telegram
syslog
notiify (UI notifications on your computer)
email
discord
build graphs from your data, upload images to S3 compatible storage and attach to notifications ()
allows data exchange between scripts — a global Key/Value storage
write your libraries in Lua and use them in the scripts (by default, lua libraries for working with json, csv are included)
send HTTP requests from your scripts (and receive responses, of course)
provides an API (not as functional as we would like yet)
exports metrics in Prometheus format
What would you like to be able to do?
It is already clear that users and we want the ability to control script execution using syntax cron. This will be implemented before version v1.0.0
We would like to support more data sources and notification delivery channels. For example, someone might definitely miss MongoDB. Others might need Elastic Search. Sending SMS and/or making phone calls to mobile. We want to be able to obtain scripts not only from files but also, for instance, from a database. Ultimately, we want a more user-friendly website for the project and better documentation.
There is always someone who feels something is missing) Here we rely on community requests to properly prioritize. And on the community's help to implement everything
In conclusion
We leverage has been with us for quite a while now. Dozens of scripts are safeguarding our peace of mind. I hope this work will be useful to someone else.
And welcome with your Issues and PR.
Source: habr.com
