


I continue my story about how to integrate Exchange and ELK (starting ). Let me remind you that this combination can effortlessly handle a very large amount of logs. This time we will talk about how to set up Exchange with the components Logstash and Kibana.
Logstash in the ELK stack is used for intelligent log processing and preparation for placement in Elastic in the form of documents, which are convenient for building various visualizations in Kibana.
Installation
It consists of two stages:
- Installing and configuring the OpenJDK package.
- Installing and configuring the Logstash package.
Installing and configuring the OpenJDK package
The OpenJDK package needs to be downloaded and unpacked into a specific directory. Then, the path to this directory must be added to the $env:Path and $env:JAVA_HOME variables of the Windows operating system:
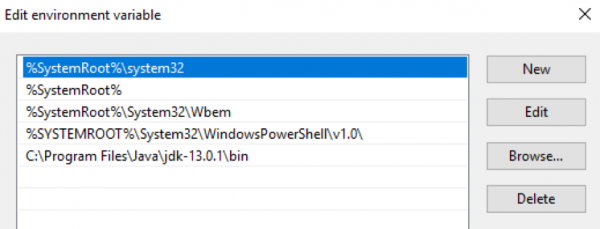
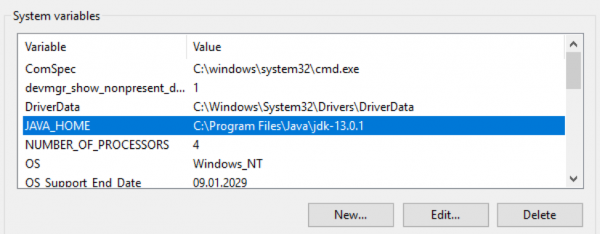
Let's check the Java version:
PS C:<; java -version
openjdk version "13.0.1" 2019-10-15
OpenJDK Runtime Environment (build 13.0.1+9)
OpenJDK 64-Bit Server VM (build 13.0.1+9, mixed mode, sharing)
Installing and configuring the Logstash package
Download the archive file with the Logstash distribution . The archive should be unpacked at the root of the disk. It should not be unpacked into a folder C:Program Files , as Logstash will fail to start correctly. Then, it is necessary to make edits in the file jvm.options that are responsible for allocating memory for the Java process. I recommend setting it to half of the server's RAM. If it has 16 GB of RAM, then the default keys are:
-Xms1g
-Xmx1g
which should be replaced with:
-Xms8g
-Xmx8g
Additionally, it is advisable to comment out the line -XX:+UseConcMarkSweepGC. More on this . The next step is to create a default configuration in the logstash.conf file:
input {
 stdin{}
}

filter {
}

output {
 stdout {
 codec => "rubydebug"
 }
}
When using this configuration, Logstash reads data from the console, passes it through an empty filter, and outputs it back to the console. Using this configuration will allow you to check the functionality of Logstash. To do this, we will run it in interactive mode:
PS C:...bin> .logstash.bat -f .logstash.conf
...
[2019-12-19T11:15:27,769][INFO ][logstash.javapipeline    ][main] Pipeline started {"pipeline.id"=>"main"}
The stdin plugin is now waiting for input:
[2019-12-19T11:15:27,847][INFO ][logstash.agent           ] Pipelines running {:count=>1, :running_pipelines=>[:main], :non_running_pipelines=>[]}
[2019-12-19T11:15:28,113][INFO ][logstash.agent           ] Successfully started Logstash API endpoint {:port=>9600}
Logstash successfully started on port 9600.
The final step of installation: starting Logstash as a Windows service. This can be done, for example, using the package :
PS C:...bin> .nssm.exe install logstash
Service "logstash" installed successfully!
Fault tolerance
The integrity of logs during transmission from the source server is ensured by the Persistent Queues mechanism.
How It Works
The queue arrangement in the log processing scheme is: input → queue → filter + output.
The input plugin receives data from the log source, records it in the queue, and sends a confirmation of data receipt back to the source.
Messages from the queue are processed by Logstash, go through a filter, and then the output plugin. Upon receiving confirmation of log delivery from the output, Logstash removes the processed log from the queue. If Logstash is stopped, all unprocessed messages and those for which confirmation of delivery has not been received remain in the queue, and Logstash will continue to process them upon the next startup.
Settings
Controlled by keys in the file C:Logstashconfiglogstash.yml:
queue.type: (possible values —persistedandmemory (default)).path.queue: (path to the folder with queue files, which by default are stored in C:Logstashqueue).queue.page_capacity: (maximum size of the queue page, default value — 64mb).queue.drain: (true/false — enables/disables stopping queue processing before stopping Logstash. It is not recommended to enable this as it will directly affect the server shutdown speed).queue.max_events: (maximum number of events in the queue, default — 0 (unlimited)).queue.max_bytes: (maximum size of the queue in bytes, default — 1024mb (1gb)).
If configured queue.max_events and queue.max_bytes, messages will stop being accepted into the queue once any of these settings is reached. More about Persistent Queues is discussed .
Example part of logstash.yml responsible for queue configuration:
queue.type: persisted
queue.max_bytes: 10gb
Settings
Logstash configuration generally consists of three parts, each responsible for different phases of processing incoming logs: receipt (input section), parsing (filter section), and sending to Elastic (output section). Below we will delve into each of them in detail.
Input
The incoming stream of raw logs is received from filebeat agents. This is the plugin we specify in the input section:
input {
  beats {
    port => 5044
  }
}
After this configuration, Logstash starts listening on port 5044, and upon receiving logs, processes them according to the settings in the filter section. If necessary, the log receiving channel from filebeat can be wrapped in SSL. More details on the settings for the beats plugin are covered .
Filter
All interesting text logs generated by Exchange are in csv format with fields described within the log files themselves. For parsing csv records, Logstash offers us three plugins: , csv, and grok. The first one is the , but only handles parsing the simplest logs.
For example, it will split the following entry into two (due to the presence of a comma within the field), leading to incorrect log parsing:
…,"MDB:GUID1, Mailbox:GUID2, Event:526545791, MessageClass:IPM.Note, CreationTime:2020-05-15T12:01:56.457Z, ClientType:MOMT, SubmissionAssistant:MailboxTransportSubmissionEmailAssistant",…
It can be used when parsing logs, for instance, from IIS. In this case, the filter section may look as follows:
filter {
  if "IIS" in [tags] {
    dissect {
      mapping => {
        "message" => "%{date} %{time} %{s-ip} %{cs-method} %{cs-uri-stem} %{cs-uri-query} %{s-port} %{cs-username} %{c-ip} %{cs(User-Agent)} %{cs(Referer)} %{sc-status} %{sc-substatus} %{sc-win32-status} %{time-taken}"
      }
      remove_field => ["message"]
      add_field => { "application" => "exchange" }
    }
  }
}
Logstash configuration allows the use of , so we can direct only the logs marked with the filebeat tag IIS. Inside the plugin, we map field values to their names, remove the original field message, which contained the log entry, and can add an arbitrary field that could, for example, contain the name of the application from which we are collecting logs.
In the case of tracking logs, it is better to use the csv plugin, which can correctly handle complex fields:
filter {
  if "Tracking" in [tags] {
    csv {
      columns => ["date-time","client-ip","client-hostname","server-ip","server-hostname","source-context","connector-id","source","event-id","internal-message-id","message-id","network-message-id","recipient-address","recipient-status","total-bytes","recipient-count","related-recipient-address","reference","message-subject","sender-address","return-path","message-info","directionality","tenant-id","original-client-ip","original-server-ip","custom-data","transport-traffic-type","log-id","schema-version"]
      remove_field => ["message", "tenant-id", "schema-version"]
      add_field => { "application" => "exchange" }
    }
}
Inside the plugin, we map field values to their names, remove the original field message (as well as the fields tenant-id and schema-version), which contained the log entry, and we can add an arbitrary field that could, for example, contain the name of the application from which we are collecting logs.
At the output of the filtering stage, we will get documents that are roughly ready for visualization in Kibana. The following will be missing:
- Numeric fields will be recognized as text, which prevents operations from being performed on them. Specifically, the fields
time-takenof the IIS log, as well as the fieldsrecipient-countandtotal-bitesof the Tracking log. - The standard document timestamp will contain the log processing time, not the time it was written on the server side.
- Field
recipient-addresswill appear as a single string, which does not allow for analysis with a count of email recipients.
It's time to add a bit of magic to the log processing.
Conversion of numeric fields
The dissect plugin has the option convert_datatype, which can be used to convert a text field into a numeric format. For example, like this:
dissect {
  …
  convert_datatype => { "time-taken" => "int" }
  …
}
It's worth remembering that this method is only suitable if the field will definitely contain a string. Null values from fields are not processed by this option and will throw an exception.
For tracking logs, it is better not to use a similar convert method, as the fields recipient-count and total-bites can be empty. For converting these fields, it is better to use the :
mutate {
  convert => [ "total-bytes", "integer" ]
  convert => [ "recipient-count", "integer" ]
}
Splitting recipient_address into individual recipients
This task can also be solved using the mutate plugin:
mutate {
  split => ["recipient_address", ";"]
}
Modifying timestamp
In the case of tracking logs, the task is very easily resolved with the plugin , which will help write the date and time in the required format from the field timestamp date-time date { match => [ "date-time", "ISO8601" ] timezone => "Europe/Moscow" remove_field => [ "date-time" ] }:
In the case of IIS logs, we will need to combine the data from the fields
using the mutate plugin, specify the required timezone, and place this timestamp in date and time using the date plugin: timestamp mutate { add_field => { "data-time" => "%{date} %{time}" } remove_field => [ "date", "time" ] } date { match => [ "data-time", "YYYY-MM-dd HH:mm:ss" ] timezone => "UTC" remove_field => [ "data-time" ] }
The output section is used to send processed logs to the log receiver. In the case of direct sending to Elastic, the plugin is used
Output
, which specifies the server address and the index name pattern for sending the formatted document: output { elasticsearch { hosts => ["127.0.0.1:9200", "127.0.0.2:9200"] manage_template => false index => "Exchange-%{+YYYY.MM.dd}" } }
Final configuration
The final configuration will look as follows:
The final configuration will look as follows:
input {
  beats {
    port => 5044
  }
}

filter {
  if "IIS" in [tags] {
    dissect {
      mapping => {
        "message" => "%{date} %{time} %{s-ip} %{cs-method} %{cs-uri-stem} %{cs-uri-query} %{s-port} %{cs-username} %{c-ip} %{cs(User-Agent)} %{cs(Referer)} %{sc-status} %{sc-substatus} %{sc-win32-status} %{time-taken}"
      }
      remove_field => ["message"]
      add_field => { "application" => "exchange" }
      convert_datatype => { "time-taken" => "int" }
    }
    mutate {
      add_field => { "data-time" => "%{date} %{time}" }
      remove_field => [ "date", "time" ]
    }
    date {
      match => [ "data-time", "YYYY-MM-dd HH:mm:ss" ]
      timezone => "UTC"
      remove_field => [ "data-time" ]
    }
  }
  if "Tracking" in [tags] {
    csv {
      columns => ["date-time","client-ip","client-hostname","server-ip","server-hostname","source-context","connector-id","source","event-id","internal-message-id","message-id","network-message-id","recipient-address","recipient-status","total-bytes","recipient-count","related-recipient-address","reference","message-subject","sender-address","return-path","message-info","directionality","tenant-id","original-client-ip","original-server-ip","custom-data","transport-traffic-type","log-id","schema-version"]
      remove_field => ["message", "tenant-id", "schema-version"]
      add_field => { "application" => "exchange" }
    }
    mutate {
      convert => [ "total-bytes", "integer" ]
      convert => [ "recipient-count", "integer" ]
      split => ["recipient_address", ";"]
    }
    date {
      match => [ "date-time", "ISO8601" ]
      timezone => "Europe/Moscow"
      remove_field => [ "date-time" ]
    }
  }
}

output {
  elasticsearch {
    hosts => ["127.0.0.1:9200", "127.0.0.2:9200"]
    manage_template => false
    index => "Exchange-%{+YYYY.MM.dd}"
  }
}
Useful links:
Source: habr.com
