

High performance is one of the key requirements when working with big data. At Sber's data loading management, we process almost all transactions into our Data Cloud based on Hadoop, and therefore, we deal with truly massive streams of information. Naturally, we are constantly looking for ways to enhance performance, and we now want to share how we managed to patch the RegionServer HBase and HDFS client, which significantly increased the reading operation speed.
However, before diving into the details of our modifications, it's worth discussing the limitations that cannot be circumvented if you're using HDD.
Why HDD and fast Random Access reads are incompatible
As is well known, HBase and many other databases store data in blocks, typically several tens of kilobytes in size. By default, this is about 64 KB. Now imagine that we need to retrieve just 100 bytes, and we request HBase to give us this data by some key. Since the block size in HFiles is 64 KB, what is requested will be 640 times more (just for a moment!) than needed.
Furthermore, since the request will go through HDFS and its metadata caching mechanism ShortCircuitCache (which allows direct access to files), this leads to reading already 1 MB from the disk. However, this can be adjusted with the parameter dfs.client.read.shortcircuit.buffer.size and in many cases, it makes sense to reduce this value, for example, to 126 KB.
Let’s assume we do this, but also, when we start reading data through the Java API, using functions like FileChannel.read, and ask the operating system to read the specified amount of data, it will read "just in case" twice as much, i.e., 256 KB in our case. This happens because there is no simple way in Java to set the FADV_RANDOM flag that prevents such behavior.
As a result, to retrieve our 100 bytes, 2600 times more is read under the hood. It seems the solution is obvious: let’s reduce the block size to one kilobyte, set the mentioned flag, and achieve great enlightenment speedup. But the problem is that by halving the block size, we also halve the number of bytes read per unit of time.
Some gain from setting the FADV_RANDOM flag can be obtained, but only with high multithreading and a block size of at least 128 KB, which is at most a couple of dozen percent.

Tests were conducted on 100 files, each 1 GB in size and distributed across 10 HDDs.
Let's calculate what we can expect at such a speed:
Suppose we are reading from 10 disks at a speed of 280 MB/sec, i.e., 3 million times 100 bytes. But as we remember, the needed data occurs 2600 times less frequently than read. Thus, we divide 3 million by 2600 and get 1100 records per second.
Disheartening, isn't it? Such is the nature of Random Access to data on HDDs — regardless of block size. This is the physical limit of random access, and no database can squeeze more out in such conditions.
So how do databases achieve much higher speeds? To answer this question, let's look at what happens in the next picture:
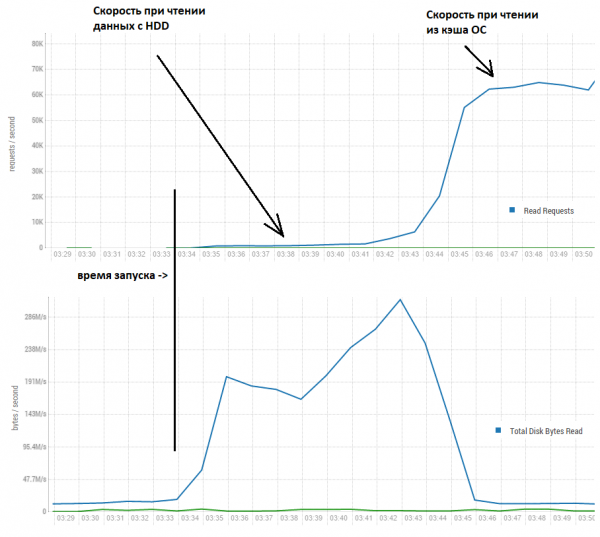
Here we see that for the first several minutes, the speed is indeed around a thousand records per second. However, later on, because much more is read than was requested, the data settles in the OS buff/cache (Linux) and the speed grows to a more decent 60,000 per second.
Thus, we will further explore accelerating access only to the data that exists in the OS cache or is located in similarly fast storage like SSD/NVMe.
In our case, we will conduct tests on a setup of 4 servers, each configured as follows:
CPU: Xeon E5-2680 v4 @ 2.40GHz 64 threads.
Memory: 730 GB.
java version: 1.8.0_111
And here is the key point — the volume of data in the tables that needs to be read. The fact is that if reading data from a table that fits entirely in HBase cache, it won't even reach the OS buff/cache. Because HBase by default allocates 40% of memory for a structure called BlockCache. Essentially, this is a ConcurrentHashMap, where the key is the file name + block offset, and the value is the data at that offset.
Thus, when reading is done only from this structure, we , seeming like a million queries per second. But let’s imagine that we cannot devote hundreds of gigabytes of memory just for the database needs, because there’s a lot of other useful stuff running on these servers.
For example, in our case, the BlockCache size on one RS is about 12 GB. We deployed two RS on one node, so a total of 96 GB is allocated for BlockCache across all nodes. The amount of data is many times larger; for instance, let's say we have 4 tables, each containing 130 regions, with files of 800 MB each, compressed with FAST_DIFF, totaling 410 GB (this is raw data, without considering the replication factor).
Thus, BlockCache makes up only about 23% of the total data volume, which is much closer to the real conditions of what’s called Big Data. And this is where things get really interesting—obviously, the fewer hits to the cache, the worse the performance. In case of a miss, a lot of work will have to be done, i.e., it will have to descend to calling system functions. However, this is unavoidable, so let’s explore quite a different aspect—what happens to the data inside the cache?
Let’s simplify the situation and assume we have a cache that only holds 1 object. Here’s an example of what will happen when trying to work with a data volume 3 times larger than the cache; we will have to:
1. Place block 1 into the cache
2. Remove block 1 from the cache
3. Place block 2 into the cache
4. Remove block 2 from the cache
5. Place block 3 into the cache
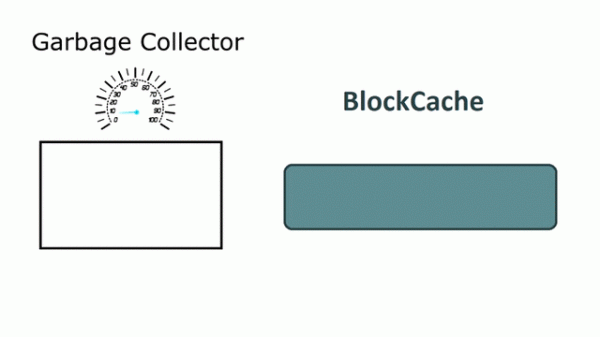
Five actions completed! However, this situation cannot be called normal; essentially, we are forcing HBase to perform a lot of completely useless work. It constantly reads data from the OS cache, places it into its BlockCache, only to almost immediately discard it, because a new batch of data arrives. The animation at the beginning of the post illustrates the essence of the problem—Garbage Collector spikes, the atmosphere warms up, little Greta in faraway and hot Sweden gets upset. And we IT folks really don’t like it when children are sad, so we start thinking about what can be done about it.
What if we only place a certain percentage of the blocks into the cache, so that it doesn’t overflow? Let’s start by simply adding a few lines of code at the beginning of the function that places data into BlockCache:
  public void cacheBlock(BlockCacheKey cacheKey, Cacheable buf, boolean inMemory) {
    if (cacheDataBlockPercent != 100 && buf.getBlockType().isData()) {
      if (cacheKey.getOffset() % 100 >= cacheDataBlockPercent) {
        return;
      }
    }
...
The essence here is that the offset is the position of the block in the file, and the last digits are randomly and evenly distributed from 00 to 99. Therefore, we will skip only those that fall within the required range.
For example, let's set cacheDataBlockPercent = 20 and see what happens:
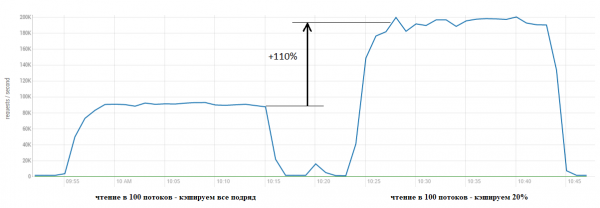
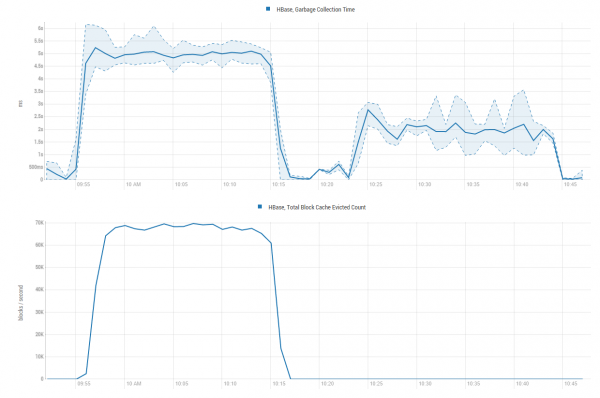
The result is evident. The graphs below make it clear what caused such acceleration — we save a lot of GC resources by not engaging in Sisyphean work of placing data into the cache only to immediately throw it to the Martian dogs.
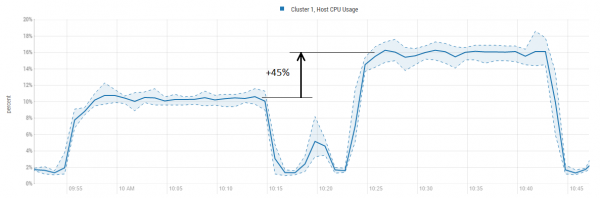
CPU utilization, in this case, rises, but significantly less than productivity:
It should also be noted that blocks stored in BlockCache can vary. Most of them, approximately 95%, are actually data. The rest consists of metadata, like Bloom filters or LEAF_INDEX and . This data is minimal but very useful, as before accessing the data directly, HBase consults the metadata to determine whether it needs to look further and, if so, where the desired block is located.
Therefore, in the code, we see the condition check buf.getBlockType().isData() and thanks to this metadata, we will keep it in the cache regardless.
Now let's increase the load and slightly tweak the feature. In the first test, we set the cutoff percentage to 20, and BlockCache was slightly underutilized. Now we will set it to 23% and add 100 threads every 5 minutes to see at what point saturation occurs:
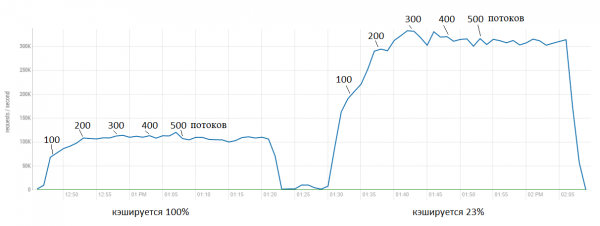
Here we see that the original version hits a ceiling almost immediately at around 100,000 requests per second. Meanwhile, the patch accelerates it to 300,000. It's clear that further acceleration is no longer 'free', and CPU utilization also rises.
However, this is not a very elegant solution, as we do not know in advance what percentage of blocks need to be cached; this depends on the load profile. Therefore, a mechanism for automatic adjustment of this parameter based on the activity of read operations was implemented.
To manage this, three parameters were added:
hbase.lru.cache.heavy.eviction.count.limit — sets how many times the data eviction process should run before we start using optimization (i.e., skipping blocks). By default, this is set to MAX_INT = 2147483647, which effectively means that the feature will never start working with such a value. This is because the eviction process runs every 5 to 10 seconds (depending on the load) and 2147483647 * 10 / 60 / 60 / 24 / 365 = 680 years. However, we can set this parameter to 0 and make the feature work immediately after startup.
However, there is also a payload in this parameter. If our load pattern consists of frequent short-term reads (say during the day) and long-term reads (at night), then we can configure it so that the feature only activates during prolonged reading operations.
For example, we know that short-term reads typically last about 1 minute. There is no need to start evicting blocks; the cache won't have aged out, and then we can set this parameter to, say, 10. This will lead to optimization starting only when a long read operation begins, i.e., after 100 seconds. Thus, if we have short-term reads, all blocks will enter the cache and be available (except for those that are evicted by the standard algorithm). And when we perform long reads, the feature activates, and we will have significantly higher performance.
hbase.lru.cache.heavy.eviction.mb.size.limit — sets how many megabytes we would like to put into the cache (and, of course, evict) every 10 seconds. The feature will try to achieve and maintain this value. The idea is that if we push gigabytes into the cache, we will have to evict gigabytes as well, which, as we have seen above, can be quite costly. However, we shouldn't try to set it too small, as this would lead to prematurely exiting the block-skipping mode. For powerful servers (around 20-40 physical cores), setting it to about 300-400 MB is optimal. For mid-range systems (~10 cores), 200-300 MB. For weaker systems (2-5 cores), 50-100 MB may be acceptable (this hasn’t been tested).
Let's consider how it works: suppose we set hbase.lru.cache.heavy.eviction.mb.size.limit = 500, there is some load (readings) and then every ~10 seconds we calculate how many bytes have been evicted using the formula:
Overhead = Freed Bytes Sum (MB) * 100 / Limit (MB) — 100;
If, in fact, 2000 MB has been evicted, then the Overhead is:
2000 * 100 / 500 — 100 = 300%
The algorithms try to maintain no more than a few dozen percent, so the feature will reduce the percentage of cached blocks, thereby implementing an auto-tuning mechanism.
However, if the load drops, say only 200 MB has been evicted and the Overhead becomes negative (so-called overshooting):
200 * 100 / 500 — 100 = -60%
Then the feature, on the contrary, will increase the percentage of cached blocks until the Overhead becomes positive.
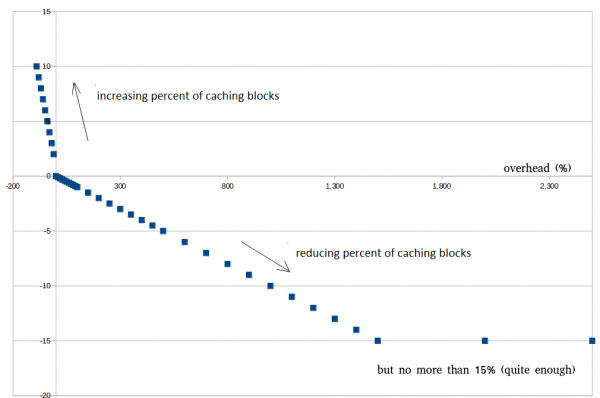
Below is an example of how this looks with real data. There's no need to try to achieve 0%, it's impossible. It's quite good when it's around 30 — 100%, as it helps avoid prematurely exiting the optimization mode during short-term spikes.
hbase.lru.cache.heavy.eviction.overhead.coefficient — sets how quickly we would like to obtain the result. If we know for sure that our readings are mainly long and we do not want to wait, we can increase this coefficient and achieve high performance more quickly.
For example, we set this coefficient = 0.01. This means that the Overhead (see above) will be multiplied by this number in the resulting value and the percentage of cached blocks will be reduced. Suppose that the Overhead = 300%, and the coefficient = 0.01, then the percentage of cached blocks will be reduced by 3%.
A similar ‘Backpressure’ logic is implemented for negative Overhead values (overshooting). Since there can always be short-term fluctuations in the volume of reads-evictions, this mechanism helps avoid premature exits from the optimization mode. Backpressure has inverted logic: the stronger the overshooting, the more blocks are cached.
Implementation code
        LruBlockCache cache = this.cache.get();
        if (cache == null) {
          break;
        }
        freedSumMb += cache.evict() / 1024 / 1024;
        /*
        * Sometimes we are reading more data than can fit into BlockCache
        * and it causes a high rate of evictions.
        * This, in turn, leads to heavy Garbage Collector work.
        * So, many blocks are put into BlockCache but never read,
        * but they consume a lot of CPU resources.
        * Here we will analyze how many bytes were freed and decide
        * whether it is time to reduce the number of cached blocks.
        * It helps avoid putting too many blocks into BlockCache
        * when evict() is very active and saves CPU for other tasks.
        * More details: https://issues.apache.org/jira/browse/HBASE-23887
        */

        // First of all, we need to control how much time
        // has passed since the previous evict() was launched.
        // This should be almost the same time (+/- 10s)
        // because we get comparable volumes of freed bytes each time.
        // 10s is the default period to run evict() (see above this.wait)
        long stopTime = System.currentTimeMillis();
        if ((stopTime - startTime) > 1000 * 10 - 1) {
          // Here we need to calculate our situation.
          // We have the limit "hbase.lru.cache.heavy.eviction.bytes.size.limit"
          // and can calculate overhead on it.
          // We will use this information to decide,
          // how to adjust the percentage of cached blocks.
          freedDataOverheadPercent =
            (int) (freedSumMb * 100 / cache.heavyEvictionMbSizeLimit) - 100;
          if (freedSumMb > cache.heavyEvictionMbSizeLimit) {
            // Now we are in a situation where we are above the limit
            // But maybe we will ignore it because it will end quite soon.
            heavyEvictionCount++;
            if (heavyEvictionCount > cache.heavyEvictionCountLimit) {
              // It has been long, and we need to reduce the caching
              // blocks now. So, we calculate how many blocks we want to skip.
              // It depends on:
              // 1. Overhead - if overhead is significant, we could be more aggressive
              // reducing the number of caching blocks.
              // 2. How quickly we want to achieve results. If we know that our
              // heavy reading is prolonged, we don't want to wait and can
              // raise the coefficient to achieve better performance quickly.
              // But if we are unsure, we can do it slowly to prevent
              // premature exit from this mode. So, when the coefficient is
              // higher, we can achieve better performance under stable heavy reading.
              // However, when reading fluctuates, we can adjust to it and set
              // the coefficient to a lower value.
              int change =
                (int) (freedDataOverheadPercent * cache.heavyEvictionOverheadCoefficient);
              // But practice shows that a 15% reduction is usually sufficient.
              // We aren't greedy (as it could lead to a premature exit).
              change = Math.min(15, change);
              change = Math.max(0, change); // This should never happen, but check for safety.
              // So, this is the key point; here we reduce the percentage of caching blocks.
              cache.cacheDataBlockPercent -= change;
              // If we go too low, we must stop here; at least 1% should be maintained.
              cache.cacheDataBlockPercent = Math.max(1, cache.cacheDataBlockPercent);
            }
          } else {
            // Well, we have overshot our target.
            // Maybe it is just a short-term fluctuation, and we can remain in this mode.
            // It helps avoid premature exit during short-term fluctuations.
            // If overshooting is less than 90%, we will try to increase the percentage of
            // cached blocks and hope it will suffice.
            if (freedSumMb >= cache.heavyEvictionMbSizeLimit * 0.1) {
              // Simple logic: more overshooting means more caching blocks (backpressure).
              int change = (int) (-freedDataOverheadPercent * 0.1 + 1);
              cache.cacheDataBlockPercent += change;
              // But it can't exceed 100%, so check it.
              cache.cacheDataBlockPercent = Math.min(100, cache.cacheDataBlockPercent);
            } else {
              // It seems heavy reading has subsided.
              // Just exit from this mode.
              heavyEvictionCount = 0;
              cache.cacheDataBlockPercent = 100;
            }
          }
          LOG.info("BlockCache evicted (MB): {}, overhead (%): {}, " +
            "heavy eviction counter: {}, " +
            "current caching DataBlock (%): {}",
            freedSumMb, freedDataOverheadPercent,
            heavyEvictionCount, cache.cacheDataBlockPercent);

          freedSumMb = 0;
          startTime = stopTime;
       }
Let's now consider all this with a real example. We have the following test scenario:
- We start the Scan (25 threads, batch = 100)
- After 5 minutes, we add multi-gets (25 threads, batch = 100)
- After 5 minutes, we turn off multi-gets (only scan remains again)
We run two passes, first with hbase.lru.cache.heavy.eviction.count.limit = 10000 (which effectively turns off the feature), and then we set limit = 0 (to enable it).
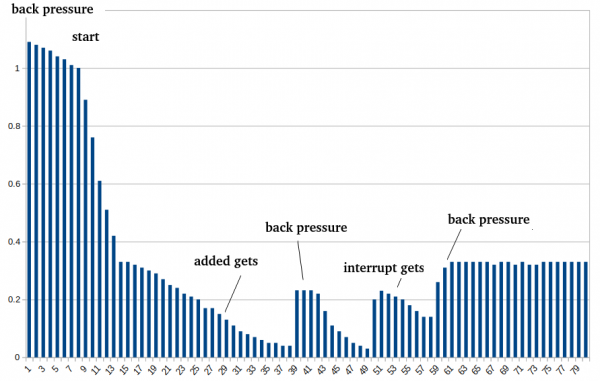
In the logs below, we see how the feature is enabled, resetting Overshooting to 14-71%. From time to time, the load decreases, which activates Backpressure and HBase caches more blocks again.
RegionServer Log
evicted (MB): 0, ratio 0.0, overhead (%): -100, heavy eviction counter: 0, current caching DataBlock (%): 100
evicted (MB): 0, ratio 0.0, overhead (%): -100, heavy eviction counter: 0, current caching DataBlock (%): 100
evicted (MB): 2170, ratio 1.09, overhead (%): 985, heavy eviction counter: 1, current caching DataBlock (%): 91 < start
evicted (MB): 3763, ratio 1.08, overhead (%): 1781, heavy eviction counter: 2, current caching DataBlock (%): 76
evicted (MB): 3306, ratio 1.07, overhead (%): 1553, heavy eviction counter: 3, current caching DataBlock (%): 61
evicted (MB): 2508, ratio 1.06, overhead (%): 1154, heavy eviction counter: 4, current caching DataBlock (%): 50
evicted (MB): 1824, ratio 1.04, overhead (%): 812, heavy eviction counter: 5, current caching DataBlock (%): 42
evicted (MB): 1482, ratio 1.03, overhead (%): 641, heavy eviction counter: 6, current caching DataBlock (%): 36
evicted (MB): 1140, ratio 1.01, overhead (%): 470, heavy eviction counter: 7, current caching DataBlock (%): 32
evicted (MB): 913, ratio 1.0, overhead (%): 356, heavy eviction counter: 8, current caching DataBlock (%): 29
evicted (MB): 912, ratio 0.89, overhead (%): 356, heavy eviction counter: 9, current caching DataBlock (%): 26
evicted (MB): 684, ratio 0.76, overhead (%): 242, heavy eviction counter: 10, current caching DataBlock (%): 24
evicted (MB): 684, ratio 0.61, overhead (%): 242, heavy eviction counter: 11, current caching DataBlock (%): 22
evicted (MB): 456, ratio 0.51, overhead (%): 128, heavy eviction counter: 12, current caching DataBlock (%): 21
evicted (MB): 456, ratio 0.42, overhead (%): 128, heavy eviction counter: 13, current caching DataBlock (%): 20
evicted (MB): 456, ratio 0.33, overhead (%): 128, heavy eviction counter: 14, current caching DataBlock (%): 19
evicted (MB): 342, ratio 0.33, overhead (%): 71, heavy eviction counter: 15, current caching DataBlock (%): 19
evicted (MB): 342, ratio 0.32, overhead (%): 71, heavy eviction counter: 16, current caching DataBlock (%): 19
evicted (MB): 342, ratio 0.31, overhead (%): 71, heavy eviction counter: 17, current caching DataBlock (%): 19
evicted (MB): 228, ratio 0.3, overhead (%): 14, heavy eviction counter: 18, current caching DataBlock (%): 19
evicted (MB): 228, ratio 0.29, overhead (%): 14, heavy eviction counter: 19, current caching DataBlock (%): 19
evicted (MB): 228, ratio 0.27, overhead (%): 14, heavy eviction counter: 20, current caching DataBlock (%): 19
evicted (MB): 228, ratio 0.25, overhead (%): 14, heavy eviction counter: 21, current caching DataBlock (%): 19
evicted (MB): 228, ratio 0.24, overhead (%): 14, heavy eviction counter: 22, current caching DataBlock (%): 19
evicted (MB): 228, ratio 0.22, overhead (%): 14, heavy eviction counter: 23, current caching DataBlock (%): 19
evicted (MB): 228, ratio 0.21, overhead (%): 14, heavy eviction counter: 24, current caching DataBlock (%): 19
evicted (MB): 228, ratio 0.2, overhead (%): 14, heavy eviction counter: 25, current caching DataBlock (%): 19
evicted (MB): 228, ratio 0.17, overhead (%): 14, heavy eviction counter: 26, current caching DataBlock (%): 19
evicted (MB): 456, ratio 0.17, overhead (%): 128, heavy eviction counter: 27, current caching DataBlock (%): 18 < added gets (but table the same)
evicted (MB): 456, ratio 0.15, overhead (%): 128, heavy eviction counter: 28, current caching DataBlock (%): 17
evicted (MB): 342, ratio 0.13, overhead (%): 71, heavy eviction counter: 29, current caching DataBlock (%): 17
evicted (MB): 342, ratio 0.11, overhead (%): 71, heavy eviction counter: 30, current caching DataBlock (%): 17
evicted (MB): 342, ratio 0.09, overhead (%): 71, heavy eviction counter: 31, current caching DataBlock (%): 17
evicted (MB): 228, ratio 0.08, overhead (%): 14, heavy eviction counter: 32, current caching DataBlock (%): 17
evicted (MB): 228, ratio 0.07, overhead (%): 14, heavy eviction counter: 33, current caching DataBlock (%): 17
evicted (MB): 228, ratio 0.06, overhead (%): 14, heavy eviction counter: 34, current caching DataBlock (%): 17
evicted (MB): 228, ratio 0.05, overhead (%): 14, heavy eviction counter: 35, current caching DataBlock (%): 17
evicted (MB): 228, ratio 0.05, overhead (%): 14, heavy eviction counter: 36, current caching DataBlock (%): 17
evicted (MB): 228, ratio 0.04, overhead (%): 14, heavy eviction counter: 37, current caching DataBlock (%): 17
evicted (MB): 109, ratio 0.04, overhead (%): -46, heavy eviction counter: 37, current caching DataBlock (%): 22 < back pressure
evicted (MB): 798, ratio 0.24, overhead (%): 299, heavy eviction counter: 38, current caching DataBlock (%): 20
evicted (MB): 798, ratio 0.29, overhead (%): 299, heavy eviction counter: 39, current caching DataBlock (%): 18
evicted (MB): 570, ratio 0.27, overhead (%): 185, heavy eviction counter: 40, current caching DataBlock (%): 17
evicted (MB): 456, ratio 0.22, overhead (%): 128, heavy eviction counter: 41, current caching DataBlock (%): 16
evicted (MB): 342, ratio 0.16, overhead (%): 71, heavy eviction counter: 42, current caching DataBlock (%): 16
evicted (MB): 342, ratio 0.11, overhead (%): 71, heavy eviction counter: 43, current caching DataBlock (%): 16
evicted (MB): 228, ratio 0.09, overhead (%): 14, heavy eviction counter: 44, current caching DataBlock (%): 16
evicted (MB): 228, ratio 0.07, overhead (%): 14, heavy eviction counter: 45, current caching DataBlock (%): 16
evicted (MB): 228, ratio 0.05, overhead (%): 14, heavy eviction counter: 46, current caching DataBlock (%): 16
evicted (MB): 222, ratio 0.04, overhead (%): 11, heavy eviction counter: 47, current caching DataBlock (%): 16
evicted (MB): 104, ratio 0.03, overhead (%): -48, heavy eviction counter: 47, current caching DataBlock (%): 21 < interrupt gets
evicted (MB): 684, ratio 0.2, overhead (%): 242, heavy eviction counter: 48, current caching DataBlock (%): 19
evicted (MB): 570, ratio 0.23, overhead (%): 185, heavy eviction counter: 49, current caching DataBlock (%): 18
evicted (MB): 342, ratio 0.22, overhead (%): 71, heavy eviction counter: 50, current caching DataBlock (%): 18
evicted (MB): 228, ratio 0.21, overhead (%): 14, heavy eviction counter: 51, current caching DataBlock (%): 18
evicted (MB): 228, ratio 0.2, overhead (%): 14, heavy eviction counter: 52, current caching DataBlock (%): 18
evicted (MB): 228, ratio 0.18, overhead (%): 14, heavy eviction counter: 53, current caching DataBlock (%): 18
evicted (MB): 228, ratio 0.16, overhead (%): 14, heavy eviction counter: 54, current caching DataBlock (%): 18
evicted (MB): 228, ratio 0.14, overhead (%): 14, heavy eviction counter: 55, current caching DataBlock (%): 18
evicted (MB): 112, ratio 0.14, overhead (%): -44, heavy eviction counter: 55, current caching DataBlock (%): 23 < back pressure
evicted (MB): 456, ratio 0.26, overhead (%): 128, heavy eviction counter: 56, current caching DataBlock (%): 22
evicted (MB): 342, ratio 0.31, overhead (%): 71, heavy eviction counter: 57, current caching DataBlock (%): 22
evicted (MB): 342, ratio 0.33, overhead (%): 71, heavy eviction counter: 58, current caching DataBlock (%): 22
evicted (MB): 342, ratio 0.33, overhead (%): 71, heavy eviction counter: 59, current caching DataBlock (%): 22
evicted (MB): 342, ratio 0.33, overhead (%): 71, heavy eviction counter: 60, current caching DataBlock (%): 22
evicted (MB): 342, ratio 0.33, overhead (%): 71, heavy eviction counter: 61, current caching DataBlock (%): 22
evicted (MB): 342, ratio 0.33, overhead (%): 71, heavy eviction counter: 62, current caching DataBlock (%): 22
evicted (MB): 342, ratio 0.33, overhead (%): 71, heavy eviction counter: 63, current caching DataBlock (%): 22
evicted (MB): 342, ratio 0.32, overhead (%): 71, heavy eviction counter: 64, current caching DataBlock (%): 22
evicted (MB): 342, ratio 0.33, overhead (%): 71, heavy eviction counter: 65, current caching DataBlock (%): 22
evicted (MB): 342, ratio 0.33, overhead (%): 71, heavy eviction counter: 66, current caching DataBlock (%): 22
evicted (MB): 342, ratio 0.32, overhead (%): 71, heavy eviction counter: 67, current caching DataBlock (%): 22
evicted (MB): 342, ratio 0.33, overhead (%): 71, heavy eviction counter: 68, current caching DataBlock (%): 22
evicted (MB): 342, ratio 0.32, overhead (%): 71, heavy eviction counter: 69, current caching DataBlock (%): 22
evicted (MB): 342, ratio 0.32, overhead (%): 71, heavy eviction counter: 70, current caching DataBlock (%): 22
evicted (MB): 342, ratio 0.33, overhead (%): 71, heavy eviction counter: 71, current caching DataBlock (%): 22
evicted (MB): 342, ratio 0.33, overhead (%): 71, heavy eviction counter: 72, current caching DataBlock (%): 22
evicted (MB): 342, ratio 0.33, overhead (%): 71, heavy eviction counter: 73, current caching DataBlock (%): 22
evicted (MB): 342, ratio 0.33, overhead (%): 71, heavy eviction counter: 74, current caching DataBlock (%): 22
evicted (MB): 342, ratio 0.33, overhead (%): 71, heavy eviction counter: 75, current caching DataBlock (%): 22
evicted (MB): 342, ratio 0.33, overhead (%): 71, heavy eviction counter: 76, current caching DataBlock (%): 22
evicted (MB): 21, ratio 0.33, overhead (%): -90, heavy eviction counter: 76, current caching DataBlock (%): 32
evicted (MB): 0, ratio 0.0, overhead (%): -100, heavy eviction counter: 0, current caching DataBlock (%): 100
evicted (MB): 0, ratio 0.0, overhead (%): -100, heavy eviction counter: 0, current caching DataBlock (%): 100
Scans were needed to illustrate this same process as a chart showing the ratio between two sections of the cache — single (where blocks go that no one has requested yet) and multi (where 'requested' data is stored at least once):
And finally, here’s how the parameters perform in a chart. For comparison, the cache was completely turned off at the start, then HBase was launched with caching and a delay in the start of optimization for 5 minutes (30 eviction cycles).
The full code can be found in the Pull Request on GitHub.
However, 300,000 reads per second is not all that can be squeezed from this hardware under these conditions. The fact is that when accessing data through HDFS, the ShortCircuitCache (SSC) mechanism is used, which allows direct access to data, avoiding network interactions.
Profiling showed that while this mechanism offers significant gains, it also becomes a bottleneck at some point because nearly all heavy operations occur within a lock, leading to blocks most of the time.
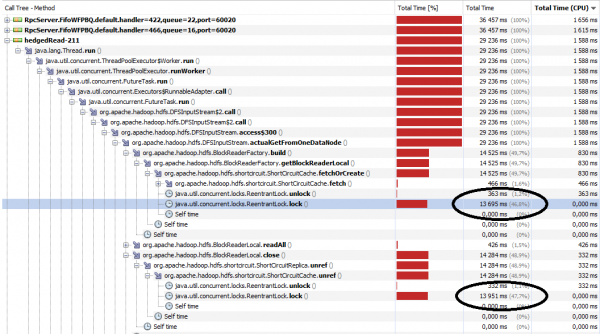
Realizing this, we understood that the problem could be circumvented by creating an array of independent SSCs:
private final ShortCircuitCache[] shortCircuitCache;
...
shortCircuitCache = new ShortCircuitCache[this.clientShortCircuitNum];
for (int i = 0; i < this.clientShortCircuitNum; i++)
  this.shortCircuitCache[i] = new ShortCircuitCache(…);
And then work with them, excluding overlaps based on the last digit of the offset as well:
public ShortCircuitCache getShortCircuitCache(long idx) {
    return shortCircuitCache[(int) (idx % clientShortCircuitNum)];
}
Now we can proceed to the tests. For this, we will read files from HDFS using a simple multithreaded application. We set the parameters:
conf.set("dfs.client.read.shortcircuit", "true");
conf.set("dfs.client.read.shortcircuit.buffer.size", "65536"); // by default = 1 MB, which significantly slows down reading, so it’s better to adjust it according to actual needs
conf.set("dfs.client.short.circuit.num", num); // from 1 to 10
And simply read the files:
FSDataInputStream in = fileSystem.open(path);
for (int i = 0; i  900000000)
        position = 0L;
    int res = in.read(position, byteBuffer, 0, 65536);
}
This code runs in separate threads, and we will increase the number of simultaneously read files (from 10 to 200 — horizontal axis) and the number of caches (from 1 to 10 — graphs). The vertical axis shows the acceleration that increasing SSC provides compared to the case when there is only one cache.
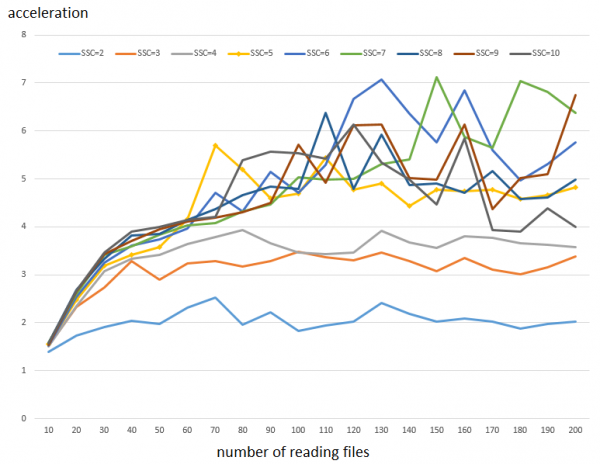
How to read the graph: the execution time for 100,000 reads in blocks of 64 KB with one cache takes 78 seconds. Whereas with 5 caches, it takes 16 seconds. That is, there is an acceleration of approximately 5 times. As can be seen from the graph, at a small number of parallel reads, the effect is not very noticeable; it starts to play a significant role when the number of reading threads exceeds 50. It is also noticeable that increasing the number of SSCs from 6 and above gives significantly less performance gain.
Note 1: Since the testing results are quite volatile (see below), 3 runs were conducted, and the obtained values were averaged.
Note 2: The performance gain from tuning for random access is the same, although the access itself is slightly slower.
However, it is important to note that, unlike in the case of HBase, this acceleration is not always free. Here, we are more "unlocking" the CPU's capabilities to do work, rather than getting stuck in locks.
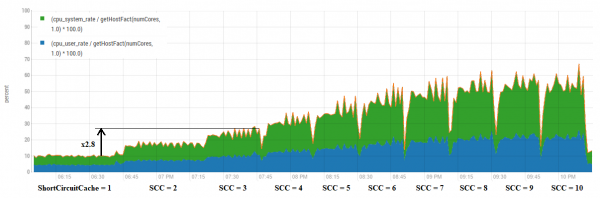
It can be observed that, in general, an increase in the number of caches provides a roughly proportional increase in CPU utilization. However, there are a few combinations that are more advantageous.
For example, let’s take a closer look at the SSC setting = 3. The performance increase across the range is about 3.3 times. Below are the results of all three individual runs.
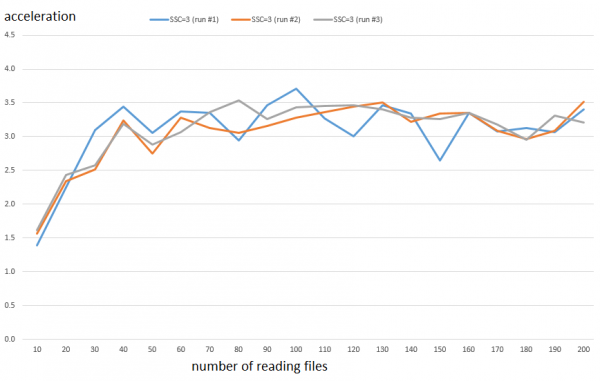
Meanwhile, CPU consumption increases by about 2.8 times. The difference isn't very large, but little Greta will be glad, and she might finally have time to attend school and classes.
Thus, this will have a positive effect for any tool using mass access to HDFS (like Spark, etc.), provided that the application code is lightweight (i.e., the bottleneck is indeed on the HDFS client side) and there are available CPU resources. To verify, let's test what effect the combined use of the BlockCache optimization and SSC tuning for reading from HBase will have.
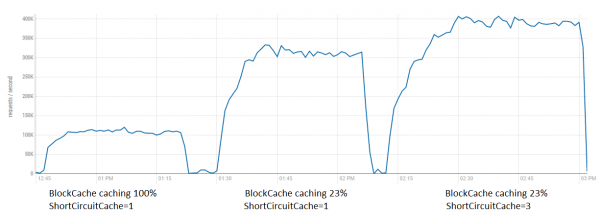
Here it can be seen that, under such conditions, the effect is not as significant as in refined tests (reading without any processing), but squeezing out an additional 80K is definitely possible. Together, both optimizations provide an acceleration of up to 4 times.
There was also a PR made regarding this optimization , which has been merged and this functionality will be available in the next releases.
Finally, it was interesting to compare the read performance of a similar wide-column database, Cassandra, with HBase.
For this, instances of the standard load testing tool YCSB were run from two hosts (800 threads in total). On the server side, there were 4 instances of RegionServer and Cassandra on 4 hosts (not the ones where the clients are running to avoid any influence). Reads were performed from tables sized:
HBase — 300 GB on HDFS (100 GB of pure data)
Cassandra — 250 GB (replication factor = 3)
That is, the volume was approximately the same (a little larger in HBase).
HBase parameters:
dfs.client.short.circuit.num = 5 (HDFS client optimization)
hbase.lru.cache.heavy.eviction.count.limit = 30 — this means the patch will start working after 30 evictions (~5 minutes)
hbase.lru.cache.heavy.eviction.mb.size.limit = 300 — target caching and eviction volume
The YCSB logs were parsed and consolidated into Excel graphs:
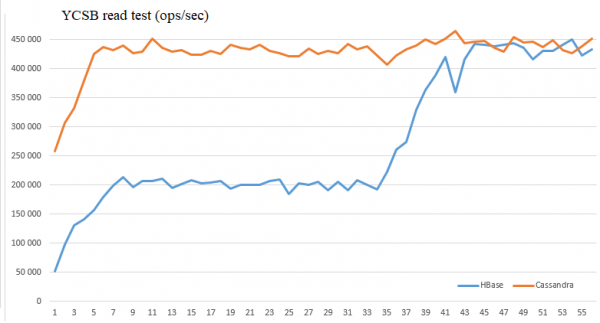
As seen, the optimization data allows equalizing the performance of these databases under these conditions, achieving 450,000 reads per second.
We hope this information can be useful to someone in the exciting battle for performance.
Source: habr.com
