

We are excited to present the preview version (NSM), a lightweight service mesh that utilizes the NGINX Plus data plane for managing container traffic in Kubernetes environments.
NSM can be downloaded for free . We hope you will try it for development and testing environments — we look forward to your feedback. .
Implementing a microservices methodology brings challenges as scaling delivery becomes more complex. The communication between services becomes convoluted, debugging issues become harder, and more services require additional resources for management.
NSM addresses these challenges by providing you with:
- Security, which is more important now than ever. Data breaches can cost companies millions of dollars annually in lost revenue and reputation. NSM ensures the encryption of all connections using mTLS — so there are simply no sensitive data that hackers can steal over the network. Access control allows you to set policies for how services will communicate with one another.
- Traffic Management. When delivering a new version of an application, you might want to initially limit its incoming traffic in case of errors. With NSM's intelligent container traffic management, you can set a traffic limiting policy for new services that will gradually increase traffic over time. Other features like rate limiting and circuit breakers give you full control over traffic management for all your services.
- Visualization. Managing thousands of services can be a nightmare for debugging and visualization. NSM helps tackle this with its integrated Grafana dashboard, which displays all metrics available in NGINX Plus. Additionally, built-in OpenTracing allows for detailed transaction tracking.
- Hybrid deliveries, if your company, like most others, does not fully run on Kubernetes infrastructure. NSM ensures that legacy applications are not left unattended. With the integrated NGINX Kubernetes Ingress Controller, legacy services can communicate with mesh services and vice versa.
NSM also ensures application security in zero-trust environments by transparently applying encryption and traffic authentication for containers. It enables monitoring and analysis of transactions, aiding in the swift and accurate deployment and troubleshooting of applications. Furthermore, detailed traffic control is provided, allowing DevOps teams to deploy and optimize parts of applications while enabling developers to create and easily connect their distributed applications.
How is the NGINX Service Mesh structured?
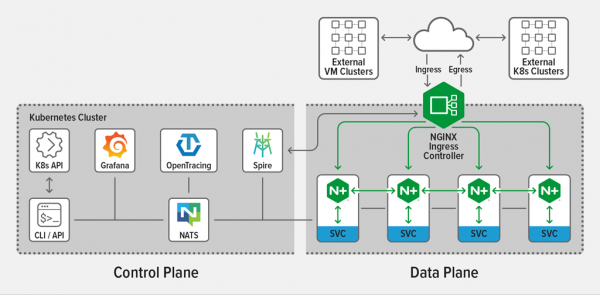
NSM consists of a unified data plane for horizontal (service-to-service) traffic and an embedded NGINX Plus Ingress Controller for vertical traffic, managed by a single control plane.
The control plane is specifically designed and optimized for the NGINX Plus data plane, defining traffic management rules distributed across NGINX Plus sidecars.
In NSM, sidecar proxies are set up for each service in the mesh. They interact with the following open-source solutions:
- Grafana, which visualizes Prometheus metrics, the built-in NSM dashboard assists you in your work;
- Kubernetes Ingress Controllers, to manage incoming and outgoing traffic in the mesh;
- SPIRE, a CA for managing, distributing, and updating certificates in the mesh;
- NATS, a scalable messaging system, for example, route updates from the control plane to sidecars;
- Open Tracing, for distributed debugging (Zipkin and Jaeger are supported);
- Prometheus, for collecting and storing metrics from NGINX Plus sidecars, such as request counts, connections, and SSL handshakes.
Features and Components
NGINX Plus, as a data plane, covers sidecar proxies (horizontal traffic) and the Ingress controller (vertical), intercepting and managing container traffic between services.
Features include:
- Mutual TLS authentication (mTLS);
- Load balancing;
- Fault tolerance;
- Rate limiting;
- Circuit breaking;
- Blue-green and canary deployments;
- Access control.
Launching NGINX Service Mesh
To launch NSM, you need:
- Access to a Kubernetes environment. NGINX Service Mesh is supported on many Kubernetes platforms, including Amazon Elastic Container Service for Kubernetes (EKS), Azure Kubernetes Service (AKS), Google Kubernetes Engine (GKE), VMware vSphere, and regular Kubernetes clusters deployed on 'bare metal' servers;
- Tool
kubectl, installed on the machine from which NSM will be set up; - Access to NGINX Service Mesh release packages. The package includes NSM images necessary for deployment in a private registry for containers available in the Kubernetes cluster. The package also contains
nginx-meshctl, needed for deploying NSM.
To deploy NSM with default settings, run the following command. During the deployment, messages will appear indicating the successful installation of components, and finally, a message stating that NSM is running in a separate namespace (first, it needs to be and placed in the registry, translator's note):
$ DOCKER_REGISTRY=your-Docker-registry ; MESH_VER=0.6.0 ;
 ./nginx-meshctl deploy
  --nginx-mesh-api-image "${DOCKER_REGISTRY}/nginx-mesh-api:${MESH_VER}"
  --nginx-mesh-sidecar-image "${DOCKER_REGISTRY}/nginx-mesh-sidecar:${MESH_VER}"
  --nginx-mesh-init-image "${DOCKER_REGISTRY}/nginx-mesh-init:${MESH_VER}"
  --nginx-mesh-metrics-image "${DOCKER_REGISTRY}/nginx-mesh-metrics:${MESH_VER}"
Created namespace "nginx-mesh".
Created SpiffeID CRD.
Waiting for Spire pods to be running...done.
Deployed Spire.
Deployed NATS server.
Created traffic policy CRDs.
Deployed Mesh API.
Deployed Metrics API Server.
Deployed Prometheus Server nginx-mesh/prometheus-server.
Deployed Grafana nginx-mesh/grafana.
Deployed tracing server nginx-mesh/zipkin.
All resources created. Testing the connection to the Service Mesh API Server...

Connected to the NGINX Service Mesh API successfully.
NGINX Service Mesh is running.
To get additional parameters, including advanced settings, run this command:
$ nginx-meshctl deploy –hTo check that the control plane is functioning correctly in the namespace nginx-mesh, you can do this:
$ kubectl get pods –n nginx-mesh
NAME                                 READY   STATUS    RESTARTS   AGE
grafana-6cc6958cd9-dccj6             1/1     Running   0          2d19h
mesh-api-6b95576c46-8npkb            1/1     Running   0          2d19h
nats-server-6d5c57f894-225qn         1/1     Running   0          2d19h
prometheus-server-65c95b788b-zkt95   1/1     Running   0          2d19h
smi-metrics-5986dfb8d5-q6gfj         1/1     Running   0          2d19h
spire-agent-5cf87                    1/1     Running   0          2d19h
spire-agent-rr2tt                    1/1     Running   0          2d19h
spire-agent-vwjbv                    1/1     Running   0          2d19h
spire-server-0                       2/2     Running   0          2d19h
zipkin-6f7cbf5467-ns6wc              1/1     Running   0          2d19h
Depending on the deployment parameters that set manual or automatic injection policies, NGINX sidecar proxies will be added to applications by default. To disable automatic addition, read
For example, if we deploy an application sleep in the namespace default, and then check the Pod — we will see two running containers, the application sleep and the associated sidecar:
$ kubectl apply –f sleep.yaml
$ kubectl get pods –n default
NAME                     READY   STATUS    RESTARTS   AGE
sleep-674f75ff4d-gxjf2   2/2     Running   0          5h23m
We can also monitor the application sleep in the NGINX Plus panel, run this command to access the sidecar from your local machine:
$ kubectl port-forward sleep-674f75ff4d-gxjf2 8080:8886Then simply go to your browser. You can also connect to Prometheus to monitor the application sleep.
You can use separate Kubernetes resources to configure traffic policies, such as access control, rate limiting, and circuit breaking; refer to
Conclusion
NGINX Service Mesh is available for free download at . Try it out in your dev and test environments and .
To try the NGINX Plus Ingress Controller, activate the or to discuss your use cases.
Translation by Pavel Demkovich, an engineer at . System administration for ₽15,000 per month. And as a separate division — the training center , practice and nothing but practice.
Source: habr.com
