

Habr may not be the most suitable platform for romance, but we can't help but confess our love for Zabbix. In many of our monitoring projects, we used Zabbix and truly appreciate the system's elegance and logic. Yes, it may lack trendy event clustering and machine learning (and some other features available out-of-the-box in commercial systems), but what is available is definitely sufficient for internal peace concerning productive systems.
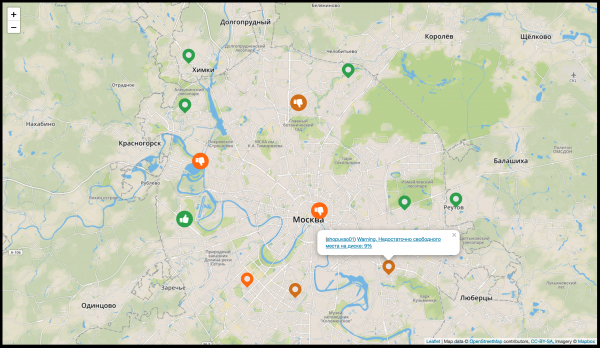
In this article, we will discuss a couple of tools for extending Zabbix's functionality: a CMDB based on the free solution iTop and an object map based on OpenStreetMap (OSM). At the end of the article, you will find a link to the repository with the front-end code for OSM.
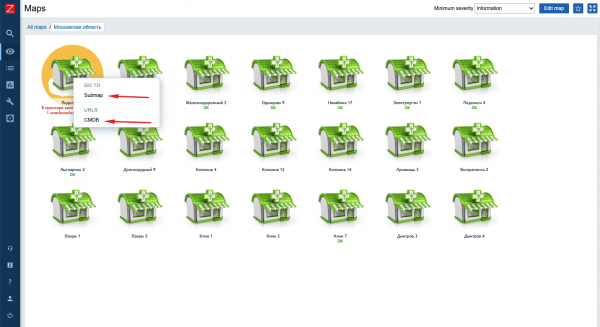
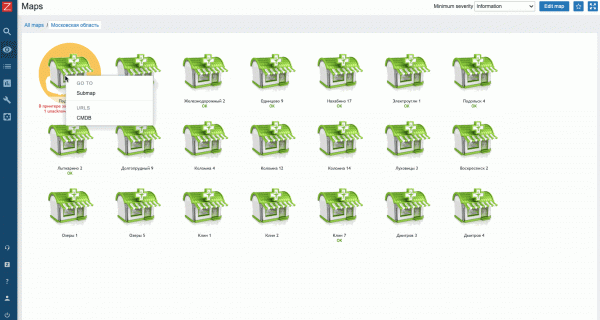
We will break down the overall concept using the example of a hypothetical project monitoring a retail pharmacy chain. In the screenshot below, you can see our demo stand; however, we use a similar concept in a production environment. You can switch from an object to either a nested map or the object's card in the CMDB.
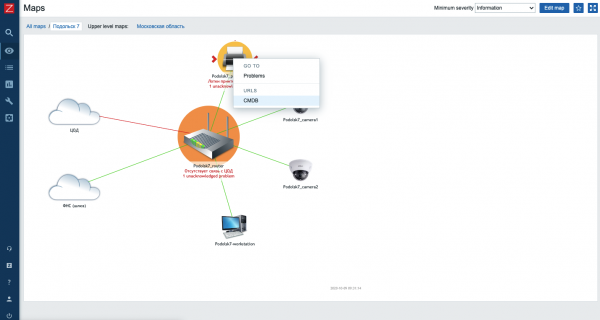
Each pharmacy comprises the following equipment: a workstation (or several workstations), a router, IP cameras, a printer, and other peripherals. Zabbix agents are installed on the workstations. A check is performed via ping from the workstation to the peripheral equipment. Likewise, in the object map, you can click on the printer to view its card in the CMDB and check the inventory data: model, delivery date, responsible person, etc. This is what a nested map looks like.
Here, a small digression is needed. You might ask, why not use Zabbix's internal inventory? In some cases, it is enough, but we recommend clients to use an external CMDB ( is not the only option, but this system is quite functional for its free nature). It serves as a convenient centralized repository where you can generate reports and track the relevance of data (in fact, this is not the only function).
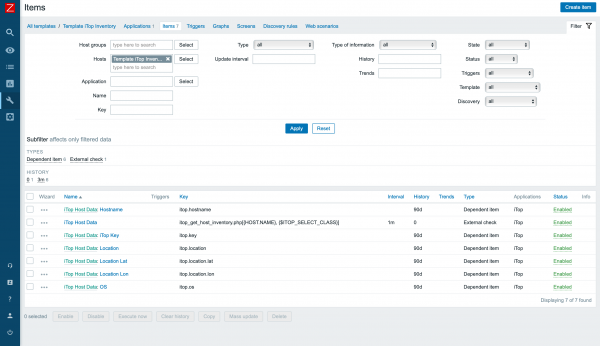
In the screenshot below is an example template for populating the Zabbix inventory from iTop. All this data can later be used in the notification texts, which will allow you to have up-to-date information immediately in case of an emergency.
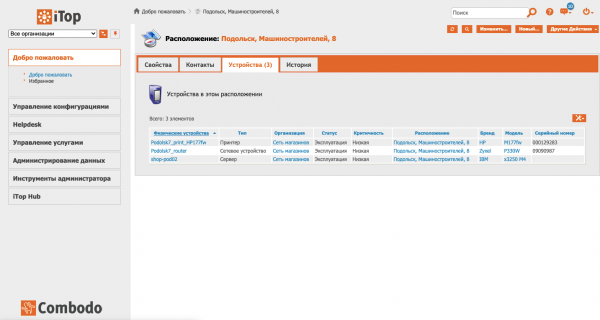
In the screenshot below is the location card. Here we can see a list of all the IT equipment located in the pharmacy. On the tab History you can track changes in the composition of the equipment.
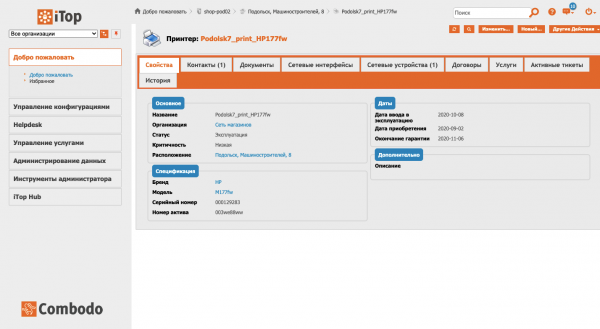
You can click on any object's card to see which network devices it is connected to, find the contact information of the responsible engineer, check when the ink cartridge was last replaced, etc.
At our overall approach to integrating Zabbix with iTop.
Now let’s move on to the mapping service. We consider it a convenient tool for viewing the status of distributed objects on a television in an office with a large leather chair.
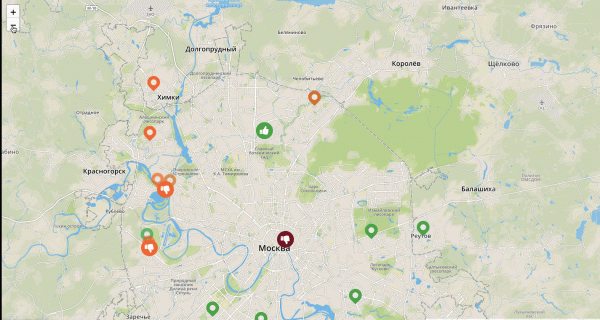
When you click on the emergency marker, a tooltip appears. From there, you can go to the object's card in the CMDB or in Zabbix. As you zoom in and out, the markers cluster together with the worst status color.
The geographic map is implemented using the js library and Events from the monitoring system and a link to the corresponding object in the CMDB are added to each marker. The status of the clusters is determined by the worst event for the nested markers. If necessary, the map can be integrated with any monitoring system that has an open API.
You can view the front-end code in . Contributions are welcome.
If you are interested in our approach, you can submit a request for a demonstration at . We will tell you more and show you.
Source: habr.com
