

Hello, friends! In the we explored the basics of working with logs on FortiAnalyzer. Today we will go further and look at the key aspects of working with reports: what reports are, what they consist of, and how to edit existing reports and create new ones. As usual, we'll start with a bit of theory, followed by practical work with reports. Below is the theoretical part of the lesson, as well as a video tutorial that includes both theory and practice.
The main purpose of reports is to consolidate large amounts of data contained in logs and present all the gathered information in a readable format: through graphs, tables, and charts. The picture below shows a list of pre-installed reports for FortiGate devices (not all reports are included, but I think it's already clear from this list that even 'out of the box' many interesting and useful reports can be generated).
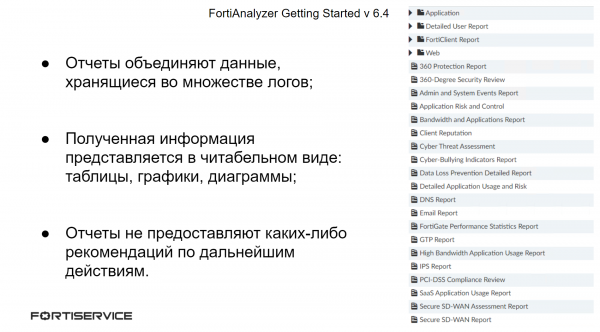
However, reports only present the requested information in a readable format — they do not contain any recommendations for further action regarding identified issues.
The main components of reports are charts. Each report consists of one or more charts. Charts determine what information needs to be extracted from the logs and in what format it should be presented. Datasets are responsible for extracting the information — SELECT queries to the database. It is in the datasets that it is precisely defined from where and what information needs to be extracted. Once the necessary data appears as a result of the query, formatting (or display) settings are applied to it. As a result, the obtained data is formatted into tables, graphs, or different types of charts.
The SELECT query uses various commands that specify conditions for the information being extracted. The most important thing to keep in mind is that these commands must be applied in a specific order, and they are presented in that order below:
FROM — the only command that is mandatory in a SELECT query. It specifies the type of logs from which information needs to be extracted;
WHERE — this command sets conditions on the logs (for example, a specific application/attack/virus name);
GROUP BY — this command allows you to group information by one or more specified columns;
ORDER BY — this command can be used to sort the output information by rows;
LIMIT — Limits the number of records returned by the query.
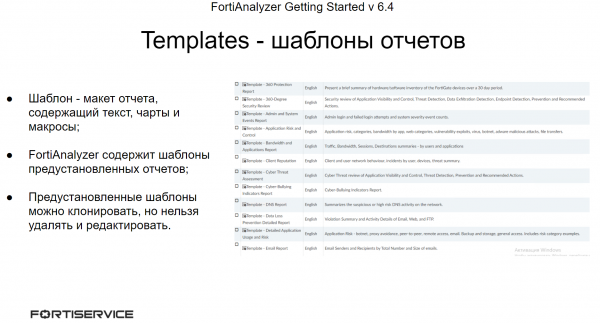
FortiAnalyzer includes predefined templates for reports. The templates serve as what is known as a report layout — they contain the report text, its charts, and macros. With these templates, new reports can be created if minimal changes are required in the predefined ones. However, the predefined reports cannot be edited or deleted — they can be cloned, and necessary changes can be made to the copy. There is also the option to create custom report templates.
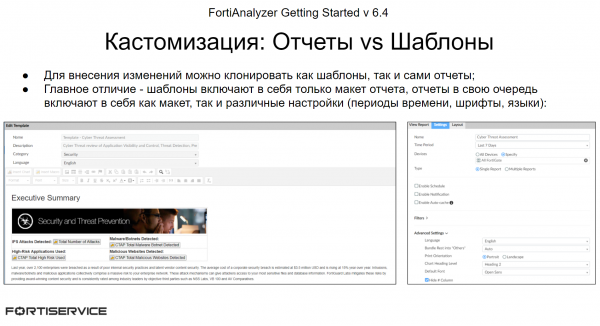
Sometimes you may encounter the following situation: a predefined report fits the task but not completely. You might need to add some information or, conversely, remove it. In this case, there are two options: clone and modify the template or the report itself. Here, several factors should be considered.
Templates serve as a layout for the report, containing charts and the report text, no more than that. The reports themselves, in turn, besides the so-called 'layout,' include various report parameters: language, font, text color, generation period, data filtering, and so on. Therefore, if changes are needed only in the report layout, templates can be used. If additional report configuration is necessary, the report itself (or rather, its copy) can be edited.
Based on templates, multiple similar reports can be created, so if many similar reports need to be made, it is preferable to use templates.
If the predefined templates and reports do not suit you, it is possible to create either a new template or a new report.
FortiAnalyzer also offers the ability to set up report forwarding to individual administrators via email or to upload them to external servers. This is done using the Output Profile mechanism. Separate Output Profiles are configured in each administrative domain. The following parameters are defined when configuring the Output Profile:
- The formats of the reports to be sent are PDF, HTML, XML, or CSV;
- The destination for the reports. This can be an administrator's email (for this, it is necessary to link FortiAnalyzer to the mail server, which we discussed in the previous lesson). It can also be an external file server — FTP, SFTP, SCP;
- It is possible to specify what to do with local reports that remain on the device after forwarding — either keep them or delete them.
If necessary, there is an option to speed up report generation. Let's consider two methods:
When creating a report, FortiAnalyzer builds charts from precompiled SQL cache data known as hcache. If hcache data has not been created during the report execution, the system must first create hcache and then build the report. This increases the report generation time. However, if new logs for the report are not received, the generation time for the report will significantly decrease upon re-execution, as the hcache data is already compiled.
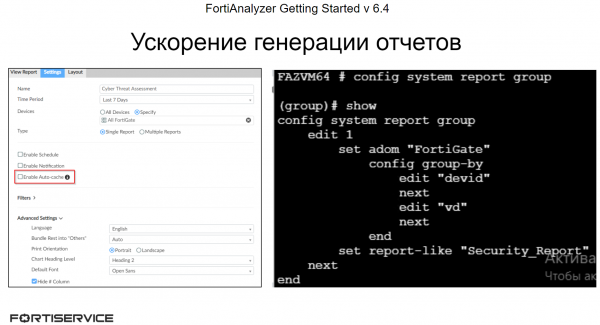
To improve report generation performance, you can enable automatic creation of hcache in the report settings. In this case, hcache is automatically updated upon arrival of new logs. An example of the setup is shown in the figure below.
This process uses a large number of system resources (especially for reports that require a long time to gather data), so after enabling it, you need to monitor the status of FortiAnalyzer: whether the load has significantly increased, and if there is critical resource consumption. If FortiAnalyzer cannot handle the load, it is better to disable this process.
It should also be noted that automatic updates of hcache data are enabled by default for scheduled reports.
The second method to speed up report generation is grouping:
If the same (or similar) reports are generated for different FortiGate devices (or other Fortinet devices), the report generation process can be significantly accelerated through grouping. Grouping reports can reduce the number of hcache tables and speed up the automatic caching time, thereby accelerating report generation.
In the example shown in the diagram below, reports containing the string Security_Report in their title are grouped by the Device ID parameter.
The video tutorial presents the theoretical material discussed above, as well as practical aspects of working with reports—from creating your own datasets and charts, templates, and reports to setting up report forwarding to administrators. Enjoy the viewing!
In the next lesson, we will explore various aspects of FortiAnalyzer administration and its licensing scheme. To not miss it, subscribe to our .
You can also follow updates on the following resources:
Source: habr.com
