

Welcome to Lesson 12. Today we will discuss another very important topic, namely, working with logs and reports.Sometimes this functionality turns out to be crucial when choosing a security tool. Security professionals love a convenient reporting system and a functional search for various events. It’s hard to blame them. Essentially, logs and reports are a vital element in assessing security. How can you understand the current level of security if you can't see what's happening? Fortunately, Check Point has all of this covered and more. Check Point has one of the best reporting systems that works out of the box! There is also customization options to create your own reports! All of this is complemented by a convenient and intuitive process for working with logs. But let's take it step by step.
Completely new interface
If you have worked with Check Point before, you will surely be surprised by the completely new interface for working with logs and reports in R80. In the picture, you can see how many different utilities have been combined into one new tab, Logs & Monitor.:
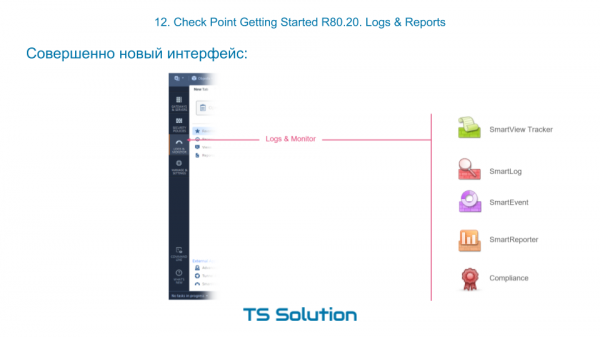
The Logs & Monitor section
If you go to Logs & Monitor and open a new tab, you should see something like this:
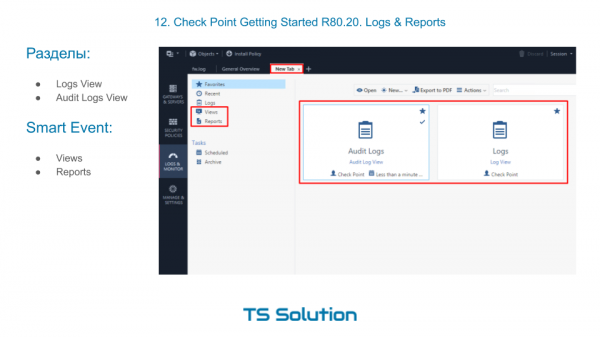
By default, there are two large sections here:
- Audit Logs View — here you can find all events related to admin logins/logouts, changes in configuration, etc. In other words, the classic audit of administrator actions.
- Logs View — this is where you can search through events generated by all our enabled blades, whether it's firewall, antivirus, IPS, etc. We have used this function many times before.
Additionally, there are links to reports (Reports) and various dashboards (Views). To use these, the Smart Eventblade must be enabled. But more on that later. First, let's figure out how to work with logs.
Log search
In my opinion, working with logs in R80 is a pleasure. We have a very smart search bar that allows us to ‘cut’ through arbitrary text, by blade, and by any other indexed parameters like source, destination, action, etc.
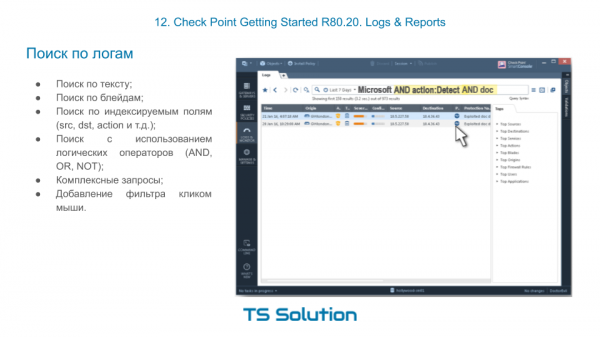
At the same time, we can create quite complex search queries using logical operators. AND, OR, NOTAnd for this, you don't even have to type anything. You can create a filter literally in just a couple of clicks. We will try this out in practice a bit later.
Viewing Log Messages by Access List
We have already assessed the possibility of viewing logs by a specific access list. This is incredibly convenient and you quickly get used to it. It especially helps during troubleshooting. You highlight an interesting access list and check below to see if the necessary traffic falls under it.
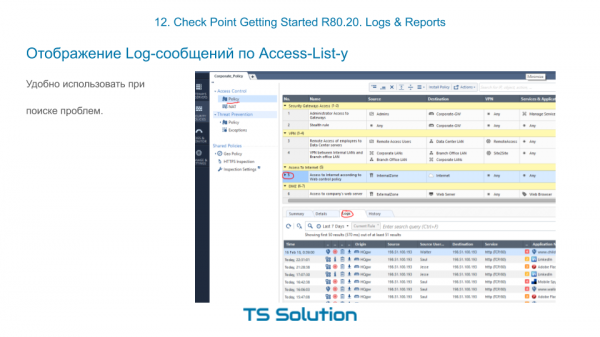
There's no need to navigate elsewhere or create a complex filter for logs.
Views & Reports
The reporting and data visualization in Check Point is managed by the blade Smart Event, which is activated on server management. This functionality can confidently be called a SIEM, but only for Check Point products! Technically, it is possible to process logs from other systems (like Cisco, Microsoft, etc.) on Smart Event, but it’s not the best idea 🙂 In practice, it can be quite problematic. However, SmartEvent handles Check Point logs exceptionally well. It can correlate, summarize, average, and much more. And all of this works out of the box! Naturally, there are already ready-made dashboards for displaying the most important information. In Check Point, they are referred to as Views:
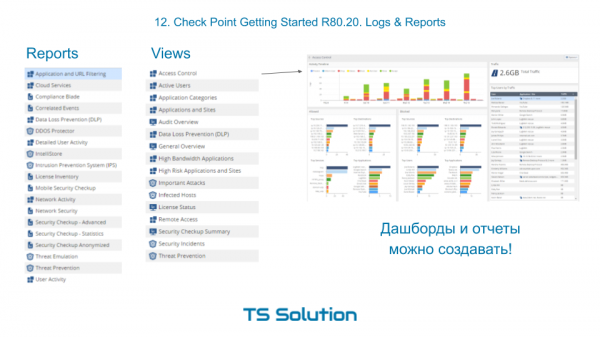
You can see that there are quite a large number of default dashboards, which are very useful for everyday administration and monitoring.
In addition to dashboards where information is simply visualized, there is also the ability to generate full reports and save them in PDF or Excel format. Reports can be generated on a schedule and sent to an email address.
And the best part! You can create your own dashboards and reports! That is, you are not limited to the built-in ones. Not every vendor can boast this feature. Moreover, the templates for these dashboards or reports can be imported or exported, allowing users to share their creations. The process of creating a dashboard is very simple and intuitive. I will try to demonstrate this in the lab work, which you will find in the video lesson below.
Video lesson

Stay tuned for more and join our 🙂
Source: habr.com
