

We continue to explore the new cloud platform Check Point Management Platform for managing user computer protection — SandBlast Agent. We described the main components of SandBlast Agent, got acquainted with the architecture of Check Point Infinity, and registered the SandBlast Agent Management Platform application on the Infinity Portal. Today, we will take a detailed look at the web interface of the agent management system — this article will serve as a convenient guide to all functions and capabilities of the cloud console. As preparation for the next article, we will install SandBlast Agent and familiarize ourselves with its interface.
Structure of the Management Platform Cloud Console
The interface of the SandBlast Agent Management Platform can be conditionally divided into three components:
- Control Panel — located at the top of the interface and allows performing basic administration tasks: managing accounts, contacting Check Point technical support, and configuring the administrator profile;
- Navigation Panel — located on the left and enables navigation between the main components of the management panel, such as policy settings, log display, etc.;
- Workspace — occupies the larger part of the management console and includes features to configure sections of the navigation panel, display graphical information (logs, reports), and configure global system settings.
Let's take a closer look at each element of the SandBlast Agent Management Platform. The workspaces will be described in detail for all components of the navigation panel, but for now, let's start with the capabilities of the management panel.
Control Panel
The management panel includes 6 components, which we will examine from left to right. The first is the 'Menu' button, which, when clicked, displays your current portal services and allows you to add new services from the categories Cloud Protection, Network Protection, and Endpoint Protection to your account. Next is the name of the current application you are working in — in this case, it's the SandBlast Agent Management Platform. By clicking the application icon, you can always access the 'OVERVIEW' section of the navigation panel. The third element is the account management icon, allowing you to quickly switch between accounts of the companies for which you are the administrator.
The fourth component of the control panel is the help button, allowing you to contact Check Point technical support directly from the console, and navigate to to monitor the status of Check Point's cloud and web resources, as well as access the 'Administrator Guides' for the SandBlast Agent Management Platform and Infinity Portal. The next item is your profile on the Infinity Portal, clicking on which allows you to 'drill down' into profile settings or log out of the current profile. Finally, the last item on the control panel is a button to go to the website .
Infinity Portal Profile Settings
When you click on your Infinity Portal profile name, a workspace opens for profile configuration: you can change the displayed username and phone number, as well as change the interface language (currently available in English and Japanese) and select the account to which the profile is linked. In addition, you can change the current profile password and enable two-factor authentication using Google Authenticator or Twilio Authy for portal access. The process of setting up two-factor authentication is extremely simple — scan a QR code with the app, then enter the generated access token, and confirm the enabling of 2FA.
Navigation Panel
The SandBlast Agent Management Platform management console consists of 9 sections in the navigation panel, as shown in the image below, allowing you to perform various tasks for deploying and administering agents, as well as managing the settings of the web console. Let's briefly review each of the sections, and for detailed information — click on the spoiler with the name of the section that interests you. Let's get started:
- OVERVIEW — the section consists of several dashboards displaying the current status of client machines and agents from a performance perspective (the number of protected machines, their operating system versions, agent statuses, error messages, etc.) and from a security perspective (data on attacked and infected machines, active and blocked attacks, attack timelines, etc.);
Overview Section: Detailed
This section consists of two subsections: Operational Overview and Security OverviewIn the first section, Operational Overview, information about the status of user machines and agents is displayed: the number of protected machines, specifications of user computers (device type — personal computer/laptop, operating system type — Windows/MacOS), statistics on the deployment process of agents, the 'health status' of machines, information on the antivirus database updates on computers, as well as the versions of installed SandBlast Agent and the operating systems in use, and a section with active events (Alerts). From this subsection, you can download the SandBlast Agent client.
The second subsection, Security Overview, displays information about the level of protection for user machines and about attacks (both active and blocked). This subsection allows you to filter the displayed information by time as well as set search parameters for specific objects. Each block in the Security Overview section can be adjusted individually — you can add charts of various types that will display information according to the specified filter. The subsection can be exported as a report in Excel/PDF formats. From this subsection, you can also download the SandBlast Agent client.
- POLICY — a section of the navigation panel where the parameters of the unified security policy (the so-called Unified Policy) are configured, and the rules for agent distribution and global policy settings are defined;
Section POLICY: detailed
The first subsection, Threat Prevention, allows you to configure security policy rules, specifying the objects to which the policy will apply, as well as finely tune the operation of blades. Each rule can contain settings for three logical components of the Threat Prevention policy: Web & Files Protection, Behavioral Protection, Analysis & Remediation. The Web & Files Protection component includes settings for URL Filtering, Download protection, Credential protection, Files Protection. The Behavioral Protection component consists of the Anti-Bot, Behavioral Guard & Anti-Ransomware, and Anti-Exploit blades. The Analysis & Remediation component includes Automated attack analysis (forensics), Remediation & Response.
There are 3 pre-set profiles that regulate the security component settings: Tuning (all blades are set to Detect mode), Recommended (some blades are in Detect mode), and Default (only URL Filtering is in Detect mode). Additionally, in the Threat Prevention section, exceptions can be added (in the Exclusions Center) to bypass policy rules.
The second subsection — Data Protection, includes settings for Full Disk Encryption. Check Point encryption and BitLocker encryption for Windows, and File Vault for macOS are supported. Furthermore, it is possible to customize encryption parameters, Pre-Boot Authentication, and advanced Windows Authentication settings.
The next subsection — Deployment, configures the installation parameters for SandBlast Agent components on user machines. This subsection allows for policy rules to separate the installation of various blades for different machines and agent versions.
The final subsection, Global Policy Settings, allows you to set a password for removing SandBlast Agent from a user machine, modify data parameters for transmission to Check Point, and establish password characteristics for Full Disk Encryption.
- COMPUTER MANAGEMENT — is the area of the navigation panel that displays detailed information about all client machines and allows management of logical groups of computers, perform forced actions (Push Operation), and configure disk encryption (Full Disk Encryption Actions);
COMPUTER MANAGEMENT section: detailed
The COMPUTER MANAGEMENT section has three main components: settings icons, a field displaying information about user machines, and filters for setting display parameters. Let's examine the settings icons in order from left to right: refresh information; export a report for the selected machine in CSV format; create a Directory Scanner to retrieve information about users, machines, groups from Active Directory; manage groups (create/edit/delete); create a new virtual group; add a user machine to an existing virtual group; add a forced action from the Push Operation category (detailed in the relevant section); create tasks for data recovery from an encrypted disk in case of access issues (Full Disk Encryption Actions).
Virtual groups allow user machines to be grouped into logical units for flexible management. These groups can be used as an alternative to Active Directory or in conjunction with AD. There are several virtual groups that are automatically assigned to user machines, such as Desktops, Laptops, Servers, and others.
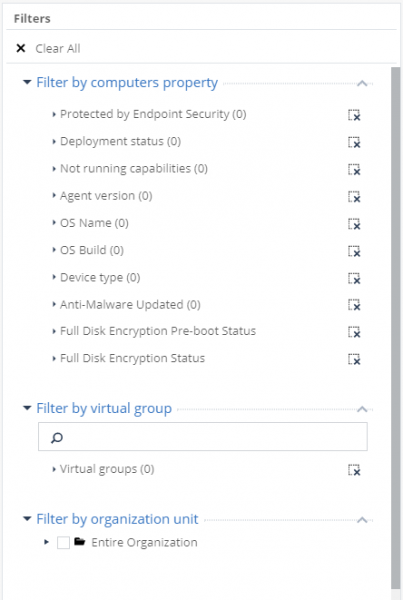
The display field for user machines can be configured according to the filters shown in the image above. The first filter (by computers property) has many built-in criteria and allows displaying user computers based on their characteristics, machine status, or SandBlast Agent components. The second filter (by virtual group) offers the option to choose by virtual groups, and the third (by organization unit) — by Active Directory parameters.
- LOGS — a logs display panel that shows statistics based on various parameters (blades, event severity, user machines, etc.) and provides detailed information on each log;
LOGS section: detailed
This section provides a user-friendly interface for exploring logs with many filtering tools. Conditionally, in the working area of the LOGS section, there are 4 main components: a top search bar for queries and time selection; a left panel with statistics for various criteria; a central area displaying all logs and key information about them; and a right panel with detailed information on the selected log. There is an option to display logs without user and machine information (Hide Identities) and export to an Excel file.
- PUSH OPERATIONS — a section where tasks that are forcibly executed on the client machine (log collection, rebooting or shutting down the machine, scanning for malware/files, etc.) are created and tracked;
PUSH OPERATIONS section: detailed
This section has two main working areas: the top one configures and displays forced tasks for client machines, while the bottom displays detailed information about the selected task.
There are three categories of forced operations, each containing several tasks: in the category of Anti-Malware this includes Scan for Malware, Update malware signature Database, Restore files from quarantine; in the category of Forensics And Remediation This is Analyze by Indicator, File Remediation; in the category Agent Settings This includes Collect Client Logs, Repair Client, Shutdown Computer, Restart Computer. Each forced task can also have a specific start time assigned and include a comment with a description.
- ENDPOINT SETTINGS — a section of the navigation panel where integration with Active Directory is configured, system message parameters (Alerts) are set, log export via Syslog is enabled, and there is an option to monitor license status and select the type of active policy (user-based or computer-based);
ENDPOINT SETTINGS section: detailed
The first subsection, AD Scanners, allows you to configure full portal synchronization with your organization's Active Directory to retrieve information about all users and machines. By default, the Organization Distributed Scan mode is enabled, where machines with the SandBlast Agent installed send data about their path to the management console for further display in the COMPUTER MANAGEMENT section. You can also switch to Full Active Directory Sync mode, where all data from Active Directory will be pulled into the management console. For successful scanning, an account with full read rights for: Active Directory root, all child containers and objects, and the deleted objects container is required.
The second subsection is Alerts, where settings for notifications about critical situations are configured, for example, about machine infections or problems with agent deployment. In the right part of the workspace, settings are configured for 12 preset critical situations, including threshold activation and deactivation values for notifications. This subsection also allows you to set up mail server parameters for sending notifications via email.
Next is the subsection Export Events, which allows you to configure transmission of logs in various formats (Syslog, CEF, LEEF, Generic) to your log server. This option also enables the transmission of logs to your SIEM system, where a Syslog agent may be running.
The next subsection — Licenses, which displays information about licenses: unique key, license status, number of active agents, and quota size. License management is carried out in the GLOBAL SETTINGS.
The last subsection is Policy Operation Mode, where the active policy type is selected: Users based Policy or Computers based Policy. As can be seen from the policy descriptions in the image below — they differ in the application of policies either exclusively regarding machines or they are applied in a mixed scheme concerning both users and machines.
- SERVICE MANAGEMENT — an area of the navigation panel that allows management of the Endpoint Management Platform service and uses SmartView to view detailed reports on security events; this section also allows downloading installation files for the SmartConsole application and the SandBlast Agent client;
SERVICE MANAGEMENT Section: detailed
The workspace of the SERVICE MANAGEMENT section consists of three components: service management and data display about the service, as well as access to SmartView (the interface is shown in the image below) for analyzing logs and reports; a panel for downloading SmartConsole R80.40 — Check Point’s product management program, including SandBlast Agent; a panel for downloading the SandBlast Agent client.
- THREAT HUNTING — a section where rules for proactive threat hunting are set up (currently in Beta);
THREAT HUNTING Section: detailed
The Threat Hunting approach enables proactive searching for anomalous or malicious activity on user machines with SandBlast Agent installed — for example, access to domains deemed malicious by Check Point, processes launched via WMI, etc. There is the possibility to use pre-installed filters for searches, or to create your own. This technology utilizes Check Point ThreatCloud — an always-updated service that represents a global network of threat detection sensors and companies that send threat information to Check Point. Currently, Threat Hunting is in development, and access to the Beta version is available by request to Check Point. We will definitely review this tool in detail in one of the upcoming articles in the series.
- GLOBAL SETTINGS - a section of global settings for all your applications in the Infinity Portal, allowing you to change your company's account settings, manage administrator accounts and track their actions, view the status of contracts for various account applications, as well as manage API keys and export logs from CloudGuard SaaS to your local log server.
GLOBAL SETTINGS section: detailed
The first subsection, Account Settings, displays your account name and Account ID, and allows configuring forced authentication parameters and inactivity timeout. In addition, this subsection can specify parameters for SSO authorization and change the account type (client, partner of Distributor/Reseller category, or partner of MSSP category).
The next subsection, Users, displays information about the administrators of your portal — contact details, as well as the date and time of registration and last login to the portal. In this section, you can also add users of two types — administrator and Read-only user.
Next is the subsection Audits, which allows you to track the actions of portal administrators. As shown in the figure below — the logs of administrator activity include the username, date and time of the event, service, category and type of event, as well as a brief description of the log. For example, the logs below recorded portal login events (Login), changes to the account type (Account Updated) to “Distributor”, and the addition of two-factor authentication for a specific user to access the portal (User Updated).
The fourth subsection is Contracts, which displays information about contracts for your applications on the portal — contract expiration date, number of contracts, and quota usage (if any). In this subsection, you can also manage associated Check Point accounts from the ASSOCIATED ACCOUNTS section.
The next subsection — API Keys, which manages API keys for all available Infinity Portal applications. When generating a key, a Client ID and Secret Key are created, which can later be used for access to the portal by third-party applications.
The last two subsections — Export Events and Partner Settings, the first describes the process of exporting logs from CloudGuard SaaS to your local log server, while the second allows viewing account information and adding new accounts (for Partner category accounts only).
SandBlast Agent: installation and familiarization with the interface
Agent distribution options
Check Point describes two methods for deploying agents on user computers: automatic and manual. Automatic deployment — is carried out by installing the Initial Client using third-party solutions (such as Active Directory group policies) and subsequently downloading policies to the agent automatically. Manual deployment — the client with embedded Threat Prevention and/or Data Protection policies is downloaded and then distributed to user machines using third-party solutions. The first method is more convenient because the Initial Client version is many times smaller than the full version with all policies, allowing the agent to be distributed, for example, via email as an attachment. On the other hand, manual deployment does not require time for downloading policies and blades to the agent after installation — all components are already included in the SandBlast Agent package.
Let's use automatic agent deployment. The Initial Client version can be downloaded from two sections of the console: Service Management and Overview. In the Service Management section, choosing the Download Initial Client option will download the initial client. When downloading from the Overview section, there are three building options for SandBlast Agent: Quick Install (Initial), Threat Prevention Agent, and Data Protection & Threat Prevention. The second and third options are suitable for manual deployment, while the first is the Initial Client build.
The downloaded EPS.msi file is transferred to the user machine, after which the installation process must be initiated. Upon successful installation completion, the Check Point Endpoint Security icon appears in the Taskbar, indicating that the agent is disconnected from the management server.
At this time, the client automatically attempts to connect to the cloud management server using the built-in address. This is a fairly quick process, and after a couple of minutes, a new notification indicates a scheduled agent installation. This message signifies the successful connection of the agent to the cloud management server.
Right-clicking on the Endpoint Security icon provides more detailed information about the connection established with the management server, such as the name of the management server the client connected to and the current connection status.
After successfully connecting to the management server, the process of downloading necessary components (according to the security policy) to the user machine begins. The administrator can monitor the agent installation process in the Computer Management section of the management web console — once the user machine successfully connects to the cloud management server, its status in the Computer Management section changes from Scheduled to Downloading. After downloading and verifying all components, the user is prompted to install the agent right away or delay the installation process. If the agent is not installed by the user within two days from the beginning of the process, the agent will be installed forcibly, with a notification in the prompt window indicating the installation start.
Once the agent installation starts, the user machine in the Computer Management section of the management console switches to Deploying status. Upon completion of the agent installation process, its interface can be opened by right-clicking on the Endpoint Security icon and selecting the Display Overview option.
After installation, it is recommended to click 'Update now' to initiate the process of updating policies and databases on the agent. The first update of the Anti-Malware database may take some time. Once all databases are updated, the first automatic system scan will commence. At this point, the client’s machine in the management console should display the Completed status, indicating the successful installation of the agent.
Let's begin exploring the agent interface. In the bottom left corner, the agent's status (Online/Disconnected) and the name of your cloud management server are displayed — in our case, the status is 'Online' and the management server name is 'matssolution'. In the bottom right corner, the current version of the agent is indicated — we have version E83.11 (83.11.2702) installed. The agent's navigation panel consists of several sections:
- Overview — the main section shows information about the status of all blades and whether the user's computer complies with the security policy. From this section, you can also 'drill down' into each blade to get more detailed information about the status and security events;
- Update now — initiates the process of checking the relevance of the security policies and databases currently active on the agent;
- Scan system now — initiates the process of scanning the system for malware or malicious files;
- Advanced — advanced agent settings allow you to view the applied policy, check or gather logs, and also use the user's computer as a Deployment Agent.
Since no changes have been made to the initial policy — at this moment, the agent only contains the Threat Prevention policy blades with default values. The contents of the initial Threat Prevention policy will be examined in more detail in our next article in the series.
Conclusion
It's time to summarize the work done: in this article, we thoroughly familiarized ourselves with the interface of the SandBlast Agent Management Platform web console, installed the agent on the user machine, and studied its interface.
In our next article in the series, we will examine the standard Threat Prevention policy and test it against the most common attacks. We will also create our own policy rules to enhance the security of the user machine.
. To not miss the next publications on the SandBlast Agent Management Platform — follow our updates on social media (, , , , ).
Source: habr.com
