


If you administer a virtual infrastructure based on VMware vSphere (or any other technology stack), then you probably often hear complaints from users: “The virtual machine is slow!”. In this series of articles, I will analyze performance metrics and tell you what and why "slows down" and how to make sure that it does not "slow down".
I will consider the following aspects of virtual machine performance:
- CPU,
- RAM,
- disk,
- Network.
I'll start with the CPU.
For performance analysis we need:
- vCenter Performance Counters – performance counters, graphs of which can be viewed through the vSphere Client. Information on these counters is available in any version of the client (“thick” client in C#, web client in Flex, and web client in HTML5). In these articles, we will use screenshots from the C# client, just because they look better in miniature :)
- ESXTOP is a utility that runs from the ESXi command line. With its help, you can get the values of performance counters in real time or upload these values for a certain period to a .csv file for further analysis. Next, I’ll tell you more about this tool and provide some useful links to documentation and articles on the topic.
Some theory
In ESXi, a separate process is responsible for the operation of each vCPU (virtual machine kernel) - world in VMware terminology. There are also service processes, but from the point of view of VM performance analysis, they are less interesting.
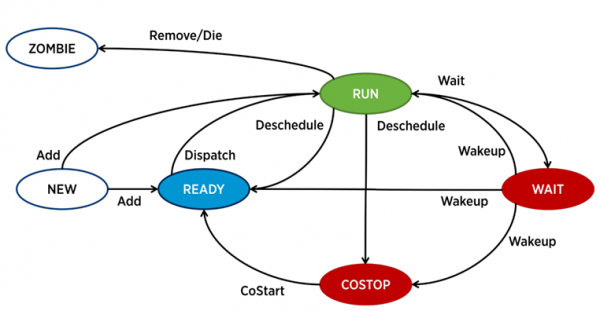
A process in ESXi can be in one of four states:
- Run The process is doing some useful work.
- Wait - the process does not perform any work (idle) or waits for input / output.
- Costop - a state that occurs in multi-core virtual machines. It occurs when the hypervisor's CPU scheduler (ESXi CPU Scheduler) cannot schedule all active virtual machine cores to run on the server's physical cores at the same time. In the physical world, all processor cores run in parallel, the guest OS inside the VM expects similar behavior, so the hypervisor has to slow down the VM cores, which have the opportunity to finish the cycle faster. In modern versions of ESXi, the CPU scheduler uses a mechanism called relaxed co-scheduling: the hypervisor calculates the gap between the “fastest” and “slowest” virtual machine core (skew). If the gap exceeds a certain threshold, the "fast" core enters the costop state. If the VM cores spend a lot of time in this state, it can cause performance issues.
- Ready – the process enters this state when the hypervisor is unable to allocate resources for its execution. High ready values can cause VM performance issues.
Main VM CPU performance counters
CPU Usage, %. Shows the percentage of CPU usage for the given period.
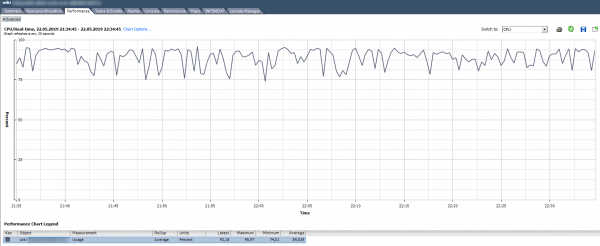
How to analyze? If the VM consistently uses the CPU at 90% or there are peaks up to 100%, then we have a problem. Problems can be expressed not only in the "slow" operation of the application inside the VM, but also in the inaccessibility of the VM over the network. If the monitoring system shows that the VM periodically falls off, pay attention to the peaks on the CPU Usage graph.
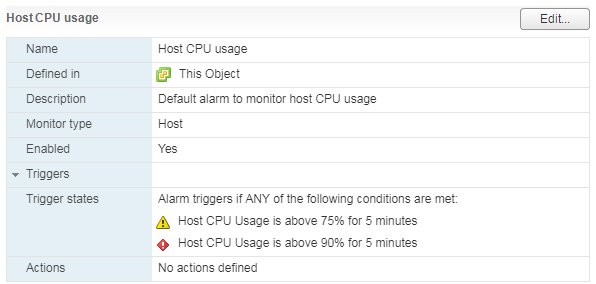
There is a standard Alarm that shows the CPU load of the virtual machine:
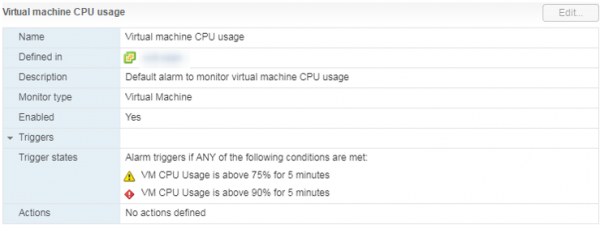
What to do? If the VM constantly has CPU Usage going off scale, then you can think about increasing the number of vCPUs (unfortunately, this does not always help) or moving the VM to a server with more efficient processors.
CPU Usage in MHz
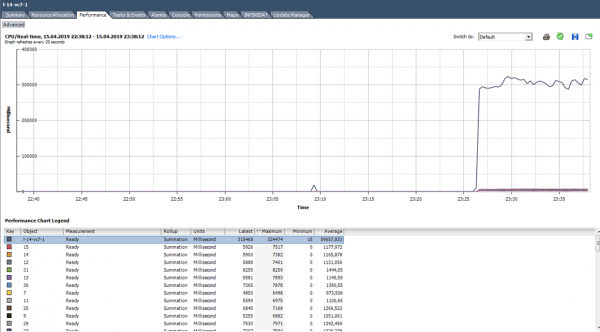
In the graphs on vCenter, Usage in % can only be viewed for the entire virtual machine, there are no graphs for individual cores (in Esxtop, there are values in % for cores). For each core, you can see Usage in MHz.
How to analyze? It happens that an application is not optimized for a multi-core architecture: it uses only one core at 100%, and the rest are idle without load. For example, with default backup settings, MS SQL starts the process on only one core. As a result, backup slows down not because of the slow speed of the disks (this is what the user initially complained about), but because the processor cannot cope. The problem was solved by changing the parameters: backup began to run in parallel in several files (respectively, in several processes).
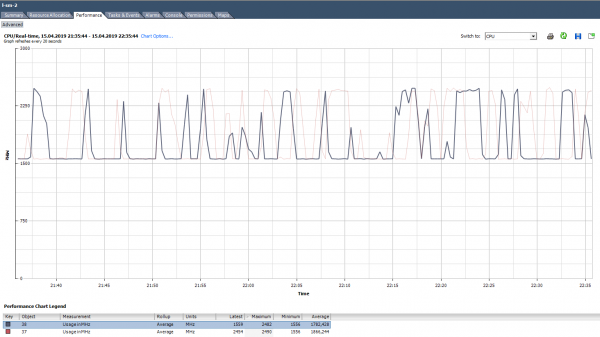
An example of uneven loading of cores.
There is also a situation (as in the graph above) when the cores are loaded unevenly and some of them have peaks of 100%. As with loading only one core, the CPU Usage alarm will not work (it is all over the VM), but there will be performance problems.
What to do? If the software in the virtual machine loads the cores unevenly (uses only one core or part of the cores), it makes no sense to increase their number. In this case, it is better to move the VM to a server with more efficient processors.
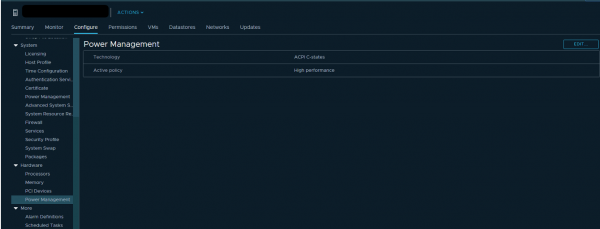
You can also try checking the power settings in the server's BIOS. Many administrators enable the High Performance mode in the BIOS and thereby disable the C-states and P-states power saving technologies. Modern Intel processors use Turbo Boost technology, which increases the frequency of individual processor cores at the expense of other cores. But it only works when power saving technologies are enabled. If we disable them, then the processor cannot reduce the power consumption of cores that are not loaded.
VMware recommends not disabling power-saving technologies on servers, but choosing modes that give maximum power management to the hypervisor. At the same time, in the hypervisor power consumption settings, you need to select High Performance.
If you have individual VMs (or VM cores) in your infrastructure that require an increased CPU frequency, properly configuring power consumption can significantly improve their performance.
CPU Ready
If the VM core (vCPU) is in the Ready state, it does not perform useful work. This condition occurs when the hypervisor does not find a free physical core to which the virtual machine's vCPU process can be assigned.
How to analyze? Typically, if the cores of a virtual machine are in the Ready state for more than 10% of the time, then you will notice performance issues. Simply put, more than 10% of the time the VM waits for the availability of physical resources.
In vCenter, you can see 2 counters related to CPU Ready:
- readiness,
- Ready.
The values of both counters can be viewed both for the entire VM and for individual cores.
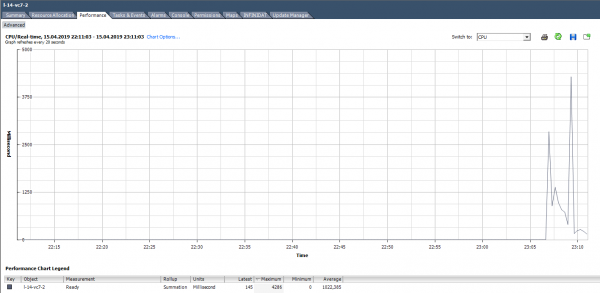
Readiness shows the value immediately as a percentage, but only in Real-time (data for the last hour, measurement interval 20 seconds). This counter is best used only to find problems in hot pursuit.
Ready counter values can also be viewed in a historical perspective. This is useful for establishing patterns and for deeper analysis of the problem. For example, if a VM starts having performance problems at a certain time, you can compare the CPU Ready hovering intervals with the overall load on the server where the VM is running and take steps to reduce the load (if DRS failed).
Ready, unlike Readiness, is shown not in percentages, but in milliseconds. This is a counter of the Summation type, that is, it shows how much time during the measurement period the VM core was in the Ready state. You can convert this value to a percentage using a simple formula:
(CPU ready summation value / (chart default update interval in seconds * 1000)) * 100 = CPU ready %
For example, for the VM in the graph below, the peak Ready value for the entire virtual machine would be:

When calculating the Ready value as a percentage, you should pay attention to two points:
- The Ready value across the entire VM is the sum of Ready across cores.
- Measurement interval. For Real-time, this is 20 seconds, and, for example, on daily charts, this is 300 seconds.
With active trouble shooting, these simple moments can be easily missed and valuable time wasted solving non-existent problems.
Let's calculate Ready based on the data from the graph below. (324474/(20*1000))*100 = 1622% for the entire VM. If you look at the cores it’s not so scary: 1622/64 = 25% per core. In this case, the catch is quite easy to spot: the Ready value is unrealistic. But if we are talking about 10–20% for the entire VM with several cores, then for each core the value may be within the normal range.
What to do? A high Ready value indicates that the server does not have enough processor resources for the normal operation of virtual machines. In such a situation, it remains only to reduce the oversubscription by processor (vCPU:pCPU). Obviously, this can be achieved by reducing the parameters of existing VMs or by migrating part of the VM to other servers.
Co-stop
How to analyze? This counter also has the Summation type and is converted to percentages in the same way as Ready:
(CPU co-stop summation value / (chart default update interval in seconds * 1000)) * 100 = CPU co-stop %
Here you also need to pay attention to the number of cores per VM and the measurement interval.
In the costop state, the kernel does not perform useful work. With proper VM sizing and normal server load, the co-stop counter should be close to zero.
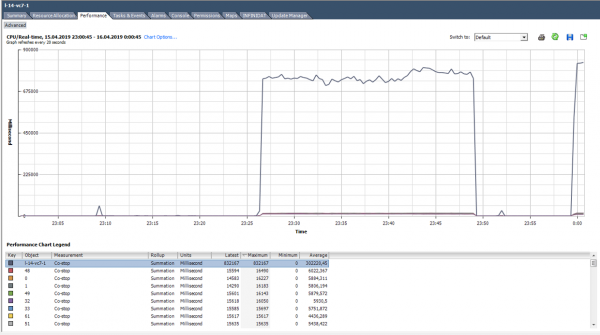
In this case, the load is clearly abnormal :)
What to do? If several VMs with a large number of cores are running on the same hypervisor and there is an oversubscription by CPU, then the co-stop counter may increase, which will lead to problems with the performance of these VMs.
Also, co-stop will increase if threads are used for active cores of one VM on one physical server core with hyper-treading enabled. This situation can occur, for example, if the VM has more cores than it physically has on the server where it is running, or if the “preferHT” setting is enabled for the VM. You can read about this setting. .
To avoid VM performance issues due to high co-stops, size the VM according to the manufacturer's recommendations for the software that runs on that VM and the capabilities of the physical server where the VM is running.
Do not add cores in reserve, this can cause performance problems not only for the VM itself, but also for its neighbors on the server.
Other useful CPU metrics
Run – how long (ms) during the measurement period the vCPU was in the RUN state, that is, it actually performed useful work.
Idle – how much time (ms) during the measurement period the vCPU was in the idle state. High Idle values are not a problem, it's just that the vCPU had "nothing to do".
Wait – how long (ms) during the measurement period the vCPU was in the Wait state. Since IDLE is included in this counter, high Wait values also do not indicate a problem. But if Wait IDLE is low when high, then the VM was waiting for the completion of I / O operations, and this, in turn, may indicate a problem with the performance of the hard disk or any virtual devices of the VM.
Max limited – how long (ms) during the measurement period the vCPU was in the Ready state due to the set resource limit. If the performance is inexplicably low, then it is useful to check the value of this counter and the CPU limit in the VM settings. VMs may indeed have limits that you don't know about. For example, this happens when a VM was cloned from a template that had a CPU limit set on it.
Swap wait – how long during the measurement period the vCPU waited for an operation with VMkernel Swap. If the value of this counter is above zero, then the VM definitely has performance problems. We will talk more about SWAP in the article about RAM counters.
ESXTOP
If the performance counters in vCenter are good for analyzing historical data, then online analysis of the problem is better done in ESXTOP. Here all values are presented in finished form (no need to translate anything), and the minimum measurement period is 2 seconds.
The ESXTOP screen on the CPU is called up with the "c" key and looks like this:

For convenience, you can leave only the virtual machine processes by pressing Shift-V.
To view metrics for individual VM cores, press "e" and type in the GID of the VM you are interested in (30919 in the screenshot below):
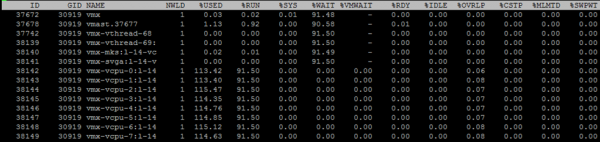
I will briefly go through the columns that are presented by default. Additional columns can be added by pressing "f".
NWLD (Number of Worlds) is the number of processes in the group. To expand the group and see metrics for each process (for example, for each core of a multi-core VM), press “e”. If there is more than one process in a group, then the metrics for the group are equal to the sum of the metrics for the individual processes.
%USED – how many server CPU cycles a process or group of processes is using.
%RUN – how long during the measurement period the process was in the RUN state, i.e. did useful work. Differs from %USED in that it does not take into account hyper-threading, frequency scaling, and time spent on system tasks (%SYS).
%SYS - time spent on system tasks, for example: interrupt processing, I / O, networking, etc. The value can be high if the VM has a lot of I / O.
%OVRLP - how much time the physical core on which the VM process is running spent on tasks of other processes.
These metrics relate to each other as follows:
%USED = %RUN + %SYS - %OVRLP.
Usually the %USED metric is more informative.
%WAIT – how long during the measurement period the process was in the Wait state. Includes IDLE.
%IDLE – how long during the measurement period the process was in the IDLE state.
%SWPWT – how long during the measurement period the vCPU waited for an operation with VMkernel Swap.
%VMWAIT – how much time during the measurement period the vCPU was in the state of waiting for an event (usually I / O). There is no similar counter in vCenter. High values indicate problems with I/O on the VM.
%WAIT = %VMWAIT + %IDLE + %SWPWT.
If the VM does not use VMkernel Swap, then when analyzing performance issues, it is advisable to look at %VMWAIT, since this metric does not take into account the time when the VM did nothing (%IDLE).
%RDY – how long during the measurement period the process was in the Ready state.
%CSTP – how long during the measurement period the process was in the state of stop.
%MLMTD – how long during the measurement period the vCPU was in the Ready state due to the set resource limit.
%WAIT + %RDY + %CSTP + %RUN = 100% - the VM core is always in one of these four states.
CPU on hypervisor
vCenter also has CPU performance counters for the hypervisor, but they are nothing interesting - it's just the sum of the counters for all the VMs on the server.
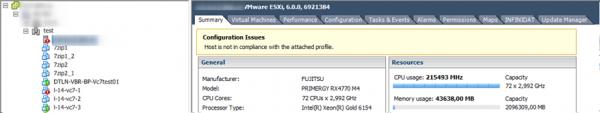
The most convenient way to view the state of the CPU on the server is on the Summary tab:
For the server, as well as for the virtual machine, there is a standard Alarm:
When the load on the server CPU is high, the VMs running on it begin to experience performance problems.
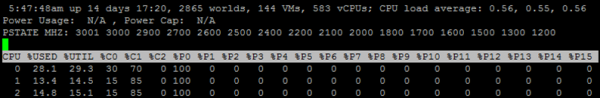
In ESXTOP, server CPU load data is presented at the top of the screen. In addition to the standard CPU load, which is not very informative for hypervisors, there are three more metrics:
CORE UTIL(%) – loading of the core of the physical server. This counter shows how much time the kernel has been doing work during the measurement period.
PCPU UTIL(%) – if hyper-threading is enabled, then there are two threads (PCPU) per physical core. This metric shows how long each thread has been doing work.
PCPU USED(%) - the same as PCPU UTIL(%), but takes into account frequency scaling (either lowering the core frequency to save power, or increasing the core frequency due to Turbo Boost technology) and hyper-threading.
PCPU_USED% = PCPU_UTIL% * effective core clock / nominal core clock.
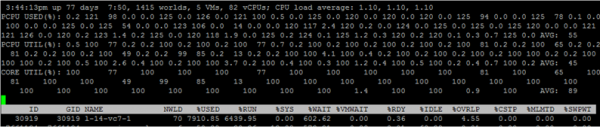
In this screenshot, for some cores, due to Turbo Boost, the USED value is greater than 100%, since the core frequency is higher than the nominal one.
A few words about how hyper-threading is taken into account. If processes are executed 100% of the time on both threads of the physical core of the server, while the core runs at the nominal frequency, then:
- CORE UTIL for core will be 100%,
- PCPU UTIL for both threads will be 100%,
- PCPU USED for both threads will be 50%.
If both threads did not work 100% of the time during the measurement period, then during those periods when the threads worked in parallel, the PCPU USED for the cores is halved.
ESXTOP also has a screen with server CPU power options. Here you can see if the server uses energy-saving technologies: C-states and P-states. Called by the "p" key:
Common CPU performance issues
Finally, I’ll go over the typical causes of problems with VM CPU performance and give short tips for solving them:
Not enough core clock. If it is not possible to upgrade the VM to more powerful cores, you can try changing the power settings so that Turbo Boost works more efficiently.
Wrong VM sizing (too many/few cores). If you put few cores, there will be a high load on the CPU of the VM. If a lot, catch a high co-stop.
Large CPU oversubscription on the server. If the VM is high Ready, lower the CPU oversubscription.
Wrong NUMA topology on large VMs. The NUMA topology seen by the VM (vNUMA) must match the NUMA topology of the server (pNUMA). About the diagnosis and possible solutions to this problem is written, for example, in the book . If you don’t want to go deep and you don’t have licensing restrictions on the OS installed on the VM, make many virtual sockets on one core on the VM. You won't lose much 🙂
That's all about the CPU for me. Ask questions. In the next part I will talk about RAM.
Useful links
Source: habr.com
