


In this article, we will talk about the performance counters of random access memory (RAM) in vSphere.
It seems that with memory everything is more clear than with the processor: if a VM has performance problems, it's hard not to notice them. But if they appear, it is much more difficult to deal with them. But first things first.
Some theory
The RAM of virtual machines is taken from the memory of the server on which the VMs are running. It's quite obvious :). If the server's RAM is not enough for everyone, ESXi starts using memory reclamation techniques to optimize the consumption of RAM. Otherwise, VM operating systems would crash with RAM access errors.
Which techniques to use ESXi decides depending on the load of RAM:
Memory status
Border
Actions
High
400% of minFree
After reaching the upper limit, large memory pages are split into small ones (TPS works in standard mode).
Clear
100% of minFree
Large memory pages are broken into small ones, TPS is forced to work.
Soft Drinks
64% of minFree
TPS + Balloon
Hard
32% of minFree
TPS + Compress + Swap
low
16% of minFree
Compress + Swap + Block
minFree is the RAM required for the hypervisor to work.
Before ESXi 4.1 inclusive, minFree was fixed by default - 6% of the server's RAM (the percentage could be changed via the Mem.MinFreePct option on ESXi). In later versions, due to the increase in memory sizes on servers, minFree began to be calculated based on the amount of host memory, and not as a fixed percentage.
The minFree (default) value is calculated as follows:
Percentage of memory reserved for minFree
Memory range
6%
0-4 GB
4%
4-12 GB
2%
12-28 GB
1%
Remaining memory
For example, for a server with 128 GB of RAM, the MinFree value would be:
MinFree = 245,76 + 327,68 + 327,68 + 1024 = 1925,12MB = 1,88GB
The actual value may differ by a couple of hundred MB, it depends on the server and RAM.
Percentage of memory reserved for minFree
Memory range
Value for 128 GB
6%
0-4 GB
245,76 MB
4%
4-12 GB
327,68 MB
2%
12-28 GB
327,68 MB
1%
Remaining memory (100 GB)
1024 MB
Usually, for productive stands, only the High state can be considered normal. For test and development benches, Clear/Soft states may be acceptable. If the RAM on the host is less than 64% MinFree, then the VMs running on it definitely have performance problems.
In each state, certain memory reclamation techniques are applied, starting with TPS, which practically does not affect the performance of the VM, and ending with Swapping. I'll tell you more about them.
Transparent Page Sharing (TPS). TPS is, roughly speaking, deduplication of virtual machine memory pages on a server.
ESXi looks for identical pages of virtual machine RAM by counting and comparing the hash sum of the pages, and removes duplicate pages, replacing them with links to the same page in the server's physical memory. As a result, physical memory consumption is reduced and some memory oversubscription can be achieved with little or no performance degradation.
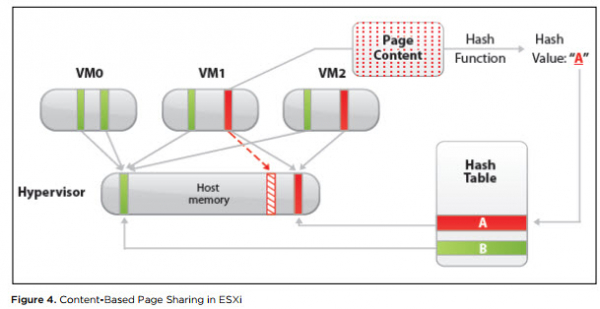
This mechanism only works for 4 KB memory pages (small pages). The hypervisor does not even try to dedupe pages of 2 MB (large pages): the chance to find identical pages of this size is not great.
By default, ESXi allocates memory to large pages. Breaking large pages into small pages starts when the High state threshold is reached and is forced when the Clear state is reached (see the hypervisor state table).
If you want TPS to start working without waiting for the host RAM to fill up, in Advanced Options ESXi you need to set the value “Mem.AllocGuestLargePage” to 0 (default 1). Then the allocation of large memory pages for virtual machines will be disabled.
Since December 2014, in all releases of ESXi, TPS between VMs has been disabled by default, as a vulnerability was found that theoretically allows access from one VM to the RAM of another VM. Details here. I have not come across information about the practical implementation of exploiting the TPS vulnerability.
TPS policy controlled via advanced option “Mem.ShareForceSalting” on ESXi:
0 - Inter-VM TPS. TPS works for pages of different VMs;
1 – TPS for VM with the same “sched.mem.pshare.salt” value in VMX;
2 (default) - Intra-VM TPS. TPS works for pages inside the VM.
It definitely makes sense to turn off large pages and turn on Inter-VM TPS on test benches. It can also be used for stands with a large number of the same type of VM. For example, on stands with VDI, savings in physical memory can reach tens of percent.
memory ballooning. Ballooning is no longer such a harmless and transparent technique for the VM operating system as TPS. But with proper application, you can live and even work with Ballooning.
Together with Vmware Tools, a special driver called Balloon Driver (aka vmmemctl) is installed on the VM. When the hypervisor begins to run out of physical memory and enters the Soft state, ESXi asks the VM to reclaim unused RAM through this Balloon Driver. The driver, in turn, works at the operating system level and requests free memory from it. The hypervisor sees which pages of physical memory the Balloon Driver has occupied, takes the memory from the virtual machine and returns it to the host. There are no problems with the operation of the OS, since at the OS level the memory is occupied by the Balloon Driver. By default Balloon Driver can take up to 65% of VM memory.
If VMware Tools are not installed on the VM or Ballooning is disabled (I do not recommend, but there are :), the hypervisor immediately switches to more stringent memory removal techniques. Conclusion: make sure that VMware Tools are on the VM.
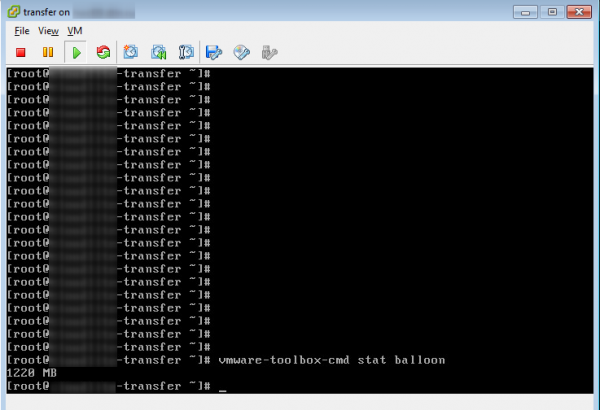
Balloon Driver's operation can be checked from the OS via VMware Tools.
memory compression. This technique is used when ESXi reaches the Hard state. As the name suggests, ESXi attempts to shrink a 4KB page of RAM into 2KB and thus free up some space on the server's physical memory. This technique significantly increases the access time to the contents of the VM RAM pages, since the page must first be uncompressed. Sometimes not all pages can be compressed and the process itself takes some time. Therefore, this technique is not very effective in practice.
memory swapping. After a short Memory Compression phase, ESXi almost inevitably (if the VMs have not left for other hosts or turned off) will switch to Swapping. And if there is very little memory left (Low state), then the hypervisor also stops allocating memory pages to the VM, which can cause problems in the guest OS of the VM.
Here's how Swapping works. When you turn on a virtual machine, a file with the .vswp extension is created for it. It is equal in size to the VM's unreserved RAM: it is the difference between configured and reserved memory. When Swapping is running, ESXi unloads virtual machine memory pages into this file and starts working with it instead of the server's physical memory. Of course, such such “operative” memory is several orders of magnitude slower than the real one, even if .vswp lies on fast storage.
Unlike Ballooning, when unused pages are taken from the VM, with Swapping, pages that are actively used by the OS or applications inside the VM can move to disk. As a result, the performance of the VM drops down to the point of freezing. The VM formally works and at least it can be properly disabled from the OS. If you are patient 😉
If the VMs went to Swap, this is an abnormal situation, which is best avoided if possible.
Key VM memory performance counters
So we got to the main point. To monitor the state of memory in the VM, there are the following counters:
Active — shows the amount of RAM (KB) that the VM got access to in the previous measurement period.
Usage - the same as Active, but as a percentage of the configured RAM of the VM. Calculated using the following formula: active ÷ virtual machine configured memory size.
High Usage and Active, respectively, are not always an indicator of VM performance problems. If the VM aggressively uses memory (at least gets access to it), this does not mean that there is not enough memory. Rather, it is an occasion to see what is happening in the OS.
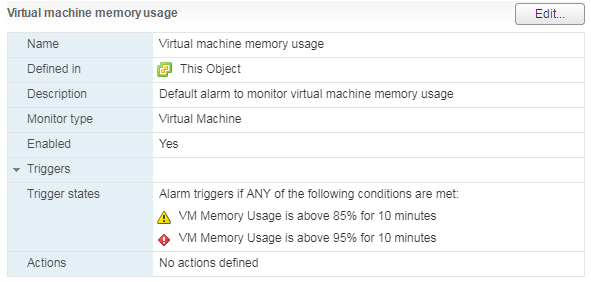
There is a standard Memory Usage Alarm for VMs:
Shared - the amount of VM RAM deduplicated using TPS (inside the VM or between VMs).
Granted - the amount of physical host memory (KB) that was given to the VM. Includes Shared.
consumed (Granted - Shared) - the amount of physical memory (KB) that the VM consumes from the host. Does not include Shared.
If part of the VM memory is given not from the physical memory of the host, but from the swap file, or the memory is taken from the VM through the Balloon Driver, this amount is not taken into account in Granted and Consumed.
High Granted and Consumed values are perfectly normal. The operating system gradually takes memory from the hypervisor and does not give it back. Over time, in an actively running VM, the values of these counters approach the amount of configured memory, and remain there.
Zero — the amount of VM RAM (KB), which contains zeros. Such memory is considered free by the hypervisor and can be given to other virtual machines. After the guest OS has written something to zeroed memory, it goes into Consumed and does not return back.
Reserved Overhead — the amount of VM RAM, (KB) reserved by the hypervisor for VM operation. This is a small amount, but it must be available on the host, otherwise the VM will not start.
Balloon — the amount of RAM (KB) seized from the VM using the Balloon Driver.
Compressed - the amount of RAM (KB) that was compressed.
Swapped - the amount of RAM (KB) that, due to lack of physical memory on the server, moved to disk.
Balloon and other memory reclamation techniques counters are zero.
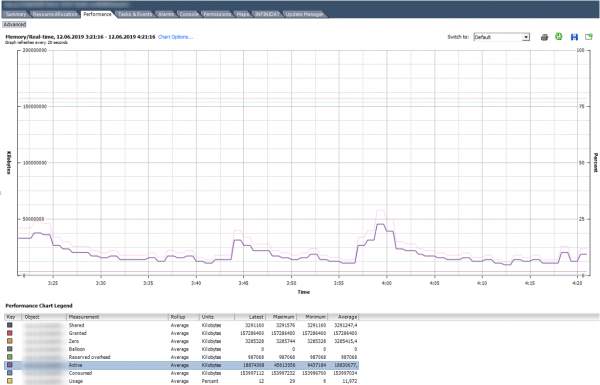
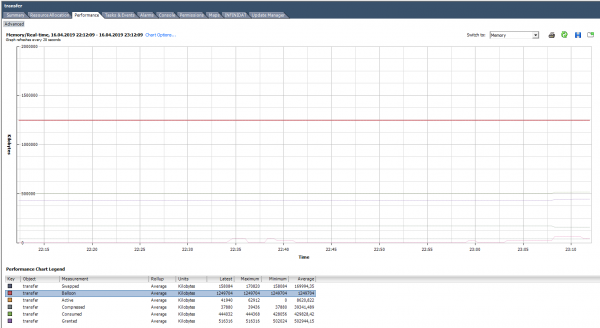
This is how the graph with Memory counters looks like for a normally working VM with 150 GB of RAM.
In the graph below, the VM has obvious problems. Under the graph, you can see that for this VM, all the described techniques for working with RAM were used. Balloon for this VM is much larger than Consumed. In fact, the VM is more dead than alive.
ESXTOP
As with the CPU, if we want to quickly assess the situation on the host, as well as its dynamics with an interval of up to 2 seconds, we should use ESXTOP.
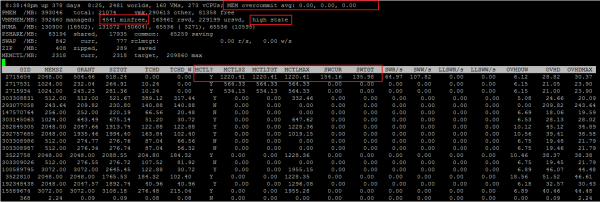
The ESXTOP screen by Memory is called up with the "m" key and looks like this (fields B, D, H, J, K, L, O are selected):
The following parameters will be of interest to us:
Mem overcommit avg - the average value of memory oversubscription on the host for 1, 5 and 15 minutes. If above zero, then this is an occasion to see what is happening, but not always an indicator of problems.
In lines PMEM/MB и VMKMEM/MB - information about the physical memory of the server and the memory available to VMkernel. From the interesting here you can see the value of minfree (in MB), the state of the host in memory (in our case, high).
In line NUMA/MB you can see the distribution of RAM by NUMA nodes (sockets). In this example, the distribution is uneven, which, in principle, is not very good.
The following is general server statistics on memory reclamation techniques:
PSHARE/MB are TPS statistics;
SWAP/MB — Swap usage statistics;
ZIP/MB — memory page compression statistics;
MEMCTL/MB — Balloon Driver usage statistics.
For individual VMs, we may be interested in the following information. I hid the VM names so as not to confuse the audience :). If the ESXTOP metric is similar to the counter in vSphere, I give the corresponding counter.
MEMSZ — the amount of memory configured on the VM (MB).
MEMSZ = GRANT + MCTLSZ + SWCUR + untouched.
GRANT — Granted to MB.
TCHD — Active in MB.
MCTL? - whether Balloon Driver is installed on the VM.
MCTLSZ — Balloon to MB.
MCTLGT — the amount of RAM (MB) that ESXi wants to take from the VM via Balloon Driver (Memctl Target).
MCTLMAX - the maximum amount of RAM (MB) that ESXi can take from the VM through the Balloon Driver.
SWCUR — the current amount of RAM (MB) allocated to the VM from the Swap file.
S.W.G.T. - the amount of RAM (MB) that ESXi wants to give to the VM from the Swap file (Swap Target).
Also, through ESXTOP, you can see more detailed information about the NUMA topology of the VM. To do this, select the fields D, G:
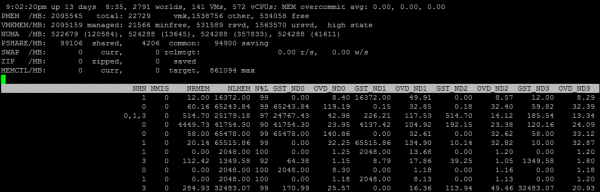
SMALL – NUMA nodes on which the VM is located. Here you can immediately notice wide vm, which do not fit on one NUMA node.
NRMEM - how many megabytes of memory the VM takes from the remote NUMA node.
NLMEM - how many megabytes of memory the VM takes from the local NUMA node.
N%L – percentage of VM memory on the local NUMA node (if less than 80%, performance problems may occur).
Memory on the hypervisor
If the CPU counters for the hypervisor are usually not of particular interest, then the situation is reversed with memory. High Memory Usage on a VM does not always indicate a performance problem, but high Memory Usage on a hypervisor triggers memory management techniques and causes performance problems in the VM. Host Memory Usage alarms must be monitored to prevent the VM from getting into Swap.
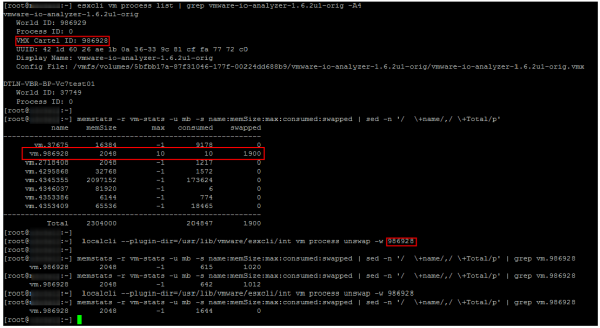
unswap
If a VM is in Swap, its performance is greatly reduced. Traces of Ballooning and compression quickly disappear after free RAM appears on the host, but the virtual machine is in no hurry to return from Swap to the server RAM.
Prior to ESXi 6.0, the only reliable and quick way to get a VM out of Swap was to reboot (to be more precise, turn off/on the container). Starting with ESXi 6.0, although not quite official, a working and reliable way to remove a VM from Swap has appeared. At one of the conferences, I was able to talk with one of the VMware engineers in charge of CPU Scheduler. He confirmed that the method is quite working and safe. In our experience, there were no problems with it either.
The actual commands for removing the VM from the Swap Duncan Epping. I will not repeat a detailed description, just give an example of its use. As you can see in the screenshot, some time after the execution of the specified commands, Swap disappears on the VM.
ESXi Memory Management Tips
Finally, here are some tips that will help you avoid problems with VM performance due to RAM:
- Avoid memory oversubscription in productive clusters. It is desirable to always have ~20-30% free memory in the cluster so that DRS (and the administrator) have room to maneuver, and VMs do not go into Swap during migration. Also, do not forget about the margin for fault tolerance. It is unpleasant when, when one server fails and the VM is rebooted using HA, some of the machines also go into Swap.
- In highly consolidated infrastructures, try NOT to create VMs with more than half of the host memory. This again will help DRS distribute virtual machines across the cluster servers without any problems. This rule, of course, is not universal :).
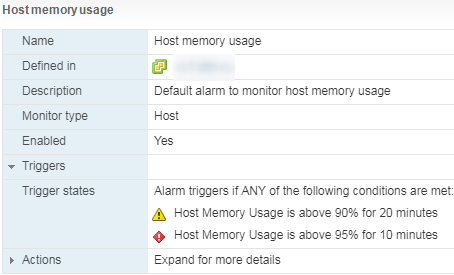
- Watch for Host Memory Usage Alarm.
- Do not forget to install VMware Tools on the VM and do not turn off Ballooning.
- Consider enabling Inter-VM TPS and disabling Large Pages in VDI and test environments.
- If the VM is experiencing performance issues, check to see if it is using memory from a remote NUMA node.
- Get your VM out of Swap as quickly as possible! Among other things, if the VM is in Swap, for obvious reasons, the storage system suffers.
That's all for me about RAM. Below is a related article for those who want to dig into the details. The next article will be devoted to storadzh.
Useful links
Source: habr.com
