


The time series database (TSDB) in Prometheus 2 is an excellent example of an engineering solution that offers significant improvements over the v2 storage in Prometheus 1 in terms of data accumulation speed and query execution, as well as resource efficiency. We implemented Prometheus 2 in Percona Monitoring and Management (PMM), and I had the opportunity to explore the performance of Prometheus 2's TSDB. In this article, I will discuss the results of these observations.
Average Load of Prometheus
For those used to dealing with general-purpose databases, the typical load of Prometheus is quite intriguing. The data accumulation rate tends toward a stable value: usually, the services you monitor send about the same number of metrics, and the infrastructure changes relatively slowly.
Information requests can come from various sources. Some of them, like alerts, also tend toward a stable and predictable value. Others, such as user queries, may cause spikes, although this is not characteristic of most of the load.
Load Testing
During the testing, I focused on the ability to accumulate data. I deployed Prometheus 2.3.2, compiled with Go 1.10.1 (as part of PMM 1.14) on a Linode service using this script: . To generate load as realistically as possible, using this , I launched several MySQL nodes with a real load (Sysbench TPC-C Test), each emulating 10 Linux/MySQL nodes.
All subsequent tests were conducted on a Linode server with eight virtual cores and 32 GB of memory, running 20 load simulations monitoring two hundred MySQL instances. Or, in Prometheus terms, 800 targets, 440 scrapes per second, 380 thousand samples per second, and 1.7 million active time series.
Design
The typical approach of traditional databases, including the one used by Prometheus 1.x, involves . If it is insufficient to handle the load, you will experience significant delays, and some queries will fail to execute. Memory usage in Prometheus 2 is configured via the key storage.tsdb.min-block-duration, which defines how long records will be kept in memory before being flushed to disk (the default is 2 hours). The amount of memory required will depend on the number of time series, labels, and the intensity of data collection (scrapes), combined with the net incoming flow. In terms of disk space, Prometheus aims to use 3 bytes per record (sample). On the other hand, memory requirements are much higher.
Although there is an option to configure the block size, it is not recommended to do so manually, thus you are left with the necessity of giving Prometheus as much memory as it asks for your workload.
If there is not enough memory to handle the incoming stream of metrics, Prometheus will crash with an out of memory error or be targeted by the OOM killer.
Adding swap to delay the moment of failure when Prometheus runs out of memory does not help much, as using this feature leads to explosive memory consumption. I believe this is related to Go, its garbage collector, and how it interacts with swap.
Another interesting approach is to configure the flushing of the head block to disk at a specific time, rather than counting it from the start time of the process.
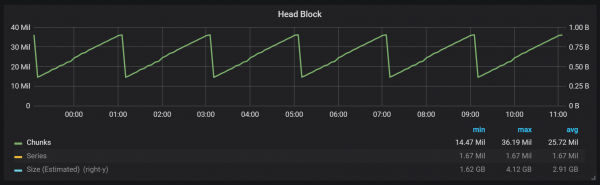
As you can see from the chart, disk flushes occur every two hours. If you change the min-block-duration parameter to one hour, these flushes will happen every hour, starting in half an hour.
If you want to use this and other charts in your Prometheus installation, you can use this . It was designed for PMM but, with a few adjustments, is suitable for any Prometheus installation.
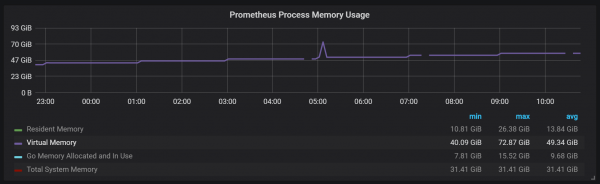
We have an active block called the head block, which is stored in memory; older data blocks are accessed via mmap(). This removes the need to configure the cache separately but also means that you need to leave enough space for the operating system cache if you want to query data older than what the head block can accommodate.
Additionally, this means that the virtual memory consumption of Prometheus will appear quite high, which is nothing to worry about.
Another interesting design aspect is the use of WAL (write-ahead log). As indicated in the storage documentation, Prometheus utilizes WAL to prevent data loss during crashes. Unfortunately, the specific mechanisms for ensuring data durability are not sufficiently documented. Prometheus version 2.3.2 flushes WAL to disk every 10 seconds, and this setting is not user-configurable.
Compactions
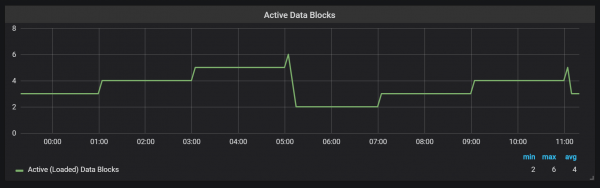
Prometheus TSDB is designed based on an LSM storage model (Log-Structured Merge): the head block is periodically flushed to disk, while the compaction mechanism merges several blocks together to avoid scanning too many blocks during queries. Here, you can see the number of blocks I observed on the test system after a day of load.
If you want to learn more about the storage, you can examine the meta.json file, which contains information about the existing blocks and how they came to be.
{
       "ulid": "01CPZDPD1D9R019JS87TPV5MPE",
       "minTime": 1536472800000,
       "maxTime": 1536494400000,
       "stats": {
               "numSamples": 8292128378,
               "numSeries": 1673622,
               "numChunks": 69528220
       },
       "compaction": {
               "level": 2,
               "sources": [
                       "01CPYRY9MS465Y5ETM3SXFBV7X",
                       "01CPYZT0WRJ1JB1P0DP80VY5KJ",
                       "01CPZ6NR4Q3PDP3E57HEH760XS"
               ],
               "parents": [
                       {
                               "ulid": "01CPYRY9MS465Y5ETM3SXFBV7X",
                               "minTime": 1536472800000,
                               "maxTime": 1536480000000
                       },
                       {
                               "ulid": "01CPYZT0WRJ1JB1P0DP80VY5KJ",
                               "minTime": 1536480000000,
                               "maxTime": 1536487200000
                       },
                       {
                               "ulid": "01CPZ6NR4Q3PDP3E57HEH760XS",
                               "minTime": 1536487200000,
                               "maxTime": 1536494400000
                       }
               ]
       },
       "version": 1
}
Compactions in Prometheus are tied to the timing of flushing the head block to disk. At this moment, several such operations can be performed.
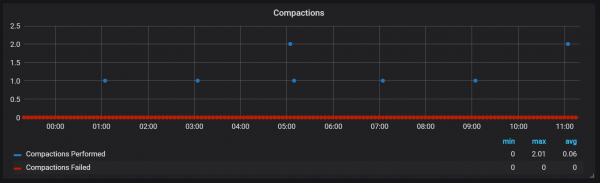
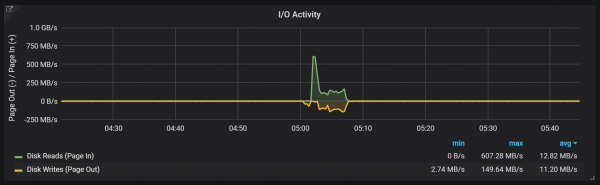
It seems that compactions are not limited in any way and can cause significant spikes in disk I/O during execution.
CPU load spikes
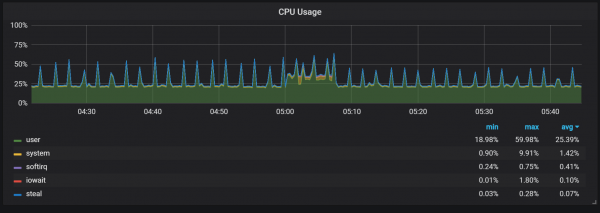
Naturally, this negatively affects system performance and poses a serious challenge for LSM stores: how to perform compactions to maintain high query speed without causing excessive overhead?
Memory usage during compactions also looks quite interesting.
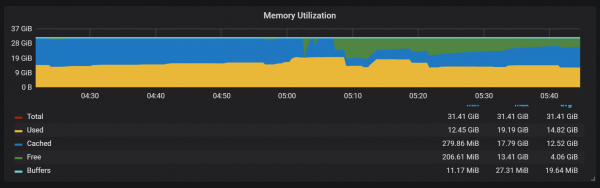
We can see that after compaction, most of the memory changes from Cached to Free: this means potentially valuable information has been removed from there. It’s interesting whether this involves fadvice() or some other minimization technique, or if it’s caused by the cache being cleared of blocks that were destroyed during compaction?
Recovery from Failure
Recovery from failures takes time, and this is justified. For an incoming stream of a million records per second, I had to wait about 25 minutes for recovery to take place, taking into account the SSD drive.
level=info ts=2018-09-13T13:38:14.09650965Z caller=main.go:222 msg="Starting Prometheus" version="(version=2.3.2, branch=v2.3.2, revision=71af5e29e815795e9dd14742ee7725682fa14b7b)"
level=info ts=2018-09-13T13:38:14.096599879Z caller=main.go:223 build_context="(go=go1.10.1, user=Jenkins, date=20180725-08:58:13OURCE)"
level=info ts=2018-09-13T13:38:14.096624109Z caller=main.go:224 host_details="(Linux 4.15.0-32-generic #35-Ubuntu SMP Fri Aug 10 17:58:07 UTC 2018 x86_64 1bee9e9b78cf (none))"
level=info ts=2018-09-13T13:38:14.096641396Z caller=main.go:225 fd_limits="(soft=1048576, hard=1048576)"
level=info ts=2018-09-13T13:38:14.097715256Z caller=web.go:415 component=web msg="Start listening for connections" address=:9090
level=info ts=2018-09-13T13:38:14.097400393Z caller=main.go:533 msg="Starting TSDB ..."
level=info ts=2018-09-13T13:38:14.098718401Z caller=repair.go:39 component=tsdb msg="found healthy block" mint=1536530400000 maxt=1536537600000 ulid=01CQ0FW3ME8Q5W2AN5F9CB7R0R
level=info ts=2018-09-13T13:38:14.100315658Z caller=web.go:467 component=web msg="router prefix" prefix=/prometheus
level=info ts=2018-09-13T13:38:14.101793727Z caller=repair.go:39 component=tsdb msg="found healthy block" mint=1536732000000 maxt=1536753600000 ulid=01CQ78486TNX5QZTBF049PQHSM
level=info ts=2018-09-13T13:38:14.102267346Z caller=repair.go:39 component=tsdb msg="found healthy block" mint=1536537600000 maxt=1536732000000 ulid=01CQ78DE7HSQK0C0F5AZ46YGF0
level=info ts=2018-09-13T13:38:14.102660295Z caller=repair.go:39 component=tsdb msg="found healthy block" mint=1536775200000 maxt=1536782400000 ulid=01CQ7SAT4RM21Y0PT5GNSS146Q
level=info ts=2018-09-13T13:38:14.103075885Z caller=repair.go:39 component=tsdb msg="found healthy block" mint=1536753600000 maxt=1536775200000 ulid=01CQ7SV8WJ3C2W5S3RTAHC2GHB
level=error ts=2018-09-13T14:05:18.208469169Z caller=wal.go:275 component=tsdb msg="WAL corruption detected; truncating" err="unexpected CRC32 checksum d0465484, want 0" file=/opt/prometheus/data/.prom2-data/wal/007357 pos=15504363
level=info ts=2018-09-13T14:05:19.471459777Z caller=main.go:543 msg="TSDB started"
level=info ts=2018-09-13T14:05:19.471604598Z caller=main.go:603 msg="Loading configuration file" filename=/etc/prometheus.yml
level=info ts=2018-09-13T14:05:19.499156711Z caller=main.go:629 msg="Completed loading of configuration file" filename=/etc/prometheus.yml
level=info ts=2018-09-13T14:05:19.499228186Z caller=main.go:502 msg="Server is ready to receive web requests."
The main issue with the recovery process is high memory consumption. While the server may function normally with that amount of memory under regular circumstances, it may fail to restart after a crash due to OOM. The only solution I found was to disable data collection, bring the server up, allow it to recover, and then restart it with data collection enabled.
Warm-up
Another behavior to keep in mind during the warm-up is the ratio of low performance to high resource consumption right after startup. I observed significant CPU and memory load during some, though not all, startups.
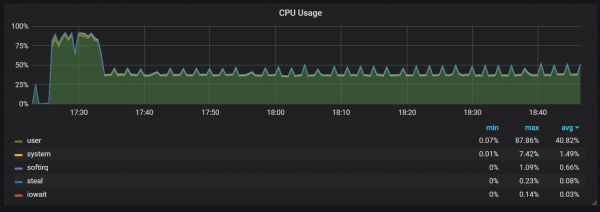
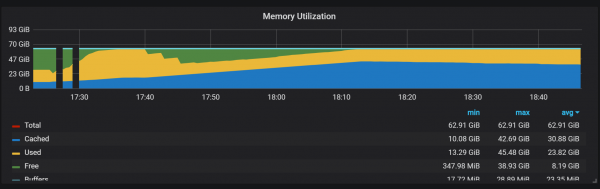
Memory usage spikes indicate that Prometheus is unable to configure all collections at startup, resulting in some information being lost.
I did not determine the exact reasons for the high load on the CPU and memory. I suspect it is related to the creation of new time series in the head block at a high frequency.
CPU load spikes
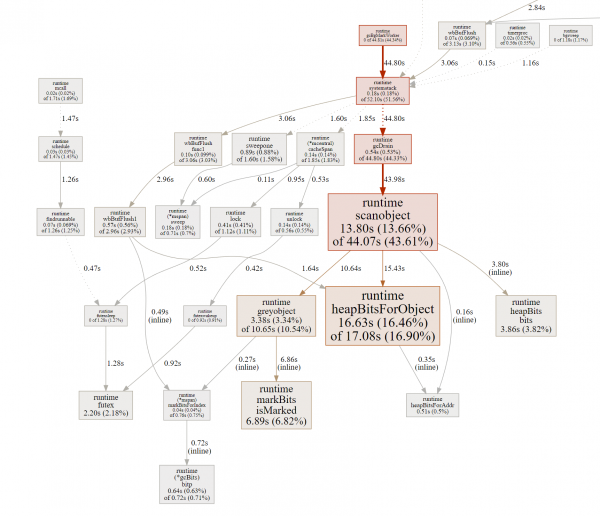
In addition to the compressions that create quite a high I/O load, I noticed significant spikes in CPU load every two minutes. The spikes last longer with high incoming traffic and seem to be caused by the Go garbage collector, as at least some cores are fully loaded.
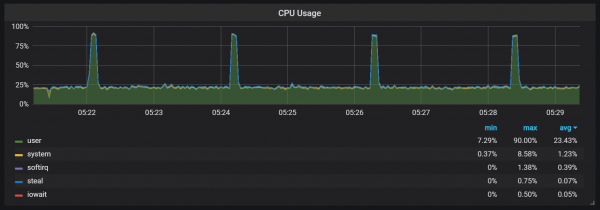
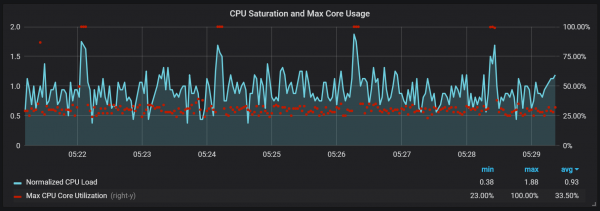
These spikes are not trivial. It seems that when they occur, the internal entry point and Prometheus metrics become inaccessible, causing data gaps during those same periods.
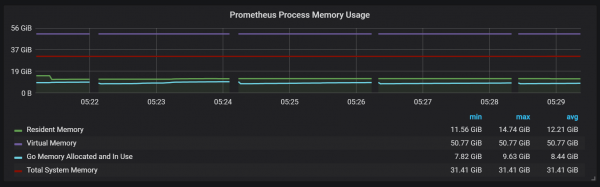
It can also be observed that the Prometheus exporter stalls for one second.
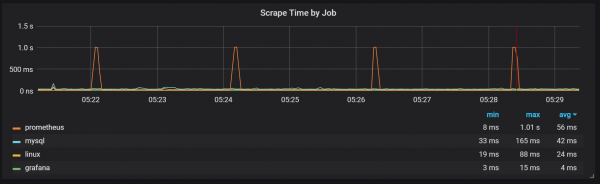
We can notice correlations with garbage collection (GC).
Conclusion
The TSDB in Prometheus 2 operates quickly, capable of handling millions of time series while also managing thousands of records per second, using quite modest hardware. The utilization of CPU and disk I/O is impressive as well. My example showed up to 200,000 metrics per second on a single utilized core.
For planning expansion, it is important to remember sufficient memory volumes, and this must be real memory. The amount of memory I observed in use was around 5 GB for 100,000 records per second of incoming traffic, totaling about 8 GB of occupied memory including the operating system cache.
Certainly, there is still considerable work to tame the spikes in CPU and disk I/O, which is not surprising given how young the Prometheus 2 TSDB is compared to InnoDB, TokuDB, RocksDB, and WiredTiger, all of which had similar problems early in their life cycles.
Source: habr.com
