

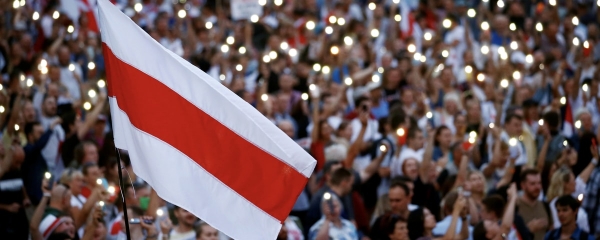
Source REUTERS/Vasily Fedosenko
Hey Habr.
2020 is turning out to be eventful. In Belarus, the scenario of a color revolution is flourishing. I propose to abstract from emotions and try to look at the available data on color revolutions from the point of view of data. Consider the possible success factors, as well as the economic consequences of such revolutions.
Perhaps there will be a lot of controversy.
To whom it is interesting — I ask under kat.
Note. Wiki: The term "color revolution" does not have a precise definition, researchers describe the causes, goals and methods of their implementation in different ways. Sometimes the term is interpreted as a change of ruling regimes, carried out with the predominant use of methods of non-violent political struggle (usually mass street protests).
The fact that it is the color revolution that is taking place in Belarus is taken from the words of A.G. Lukashenko.
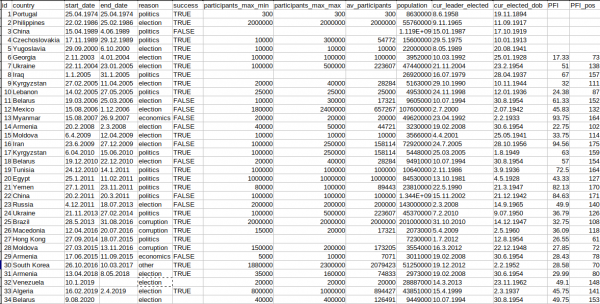
Dataset
All 33 color revolutions were taken (the term is what it is. The author continues to use this term, including for failed color coups and coups), according to the source, which served , for lack of a better one.
The following categories were taken:
- a country [country]
- Start [start_date] and end [end_date]. The beginning of the protests themselves was taken as a basis, without taking into account the preludes.
- Cause [reason] - the category is subjective, proceeded from the context: dissatisfaction with the policy pursued [politics], election results [election], economic aspects [economics], corruption [corruption]
- The success of the revolution [success] — whether the revolution was successful. Binary value
- The number of protesters. Estimating the number of participants can vary greatly. In this regard, the maximum value was taken from the minimum (usually the official estimate)[participants_max_min], the highest possible rating (usually the rating of independent media or protesters) [participants_max_max] and their geometric mean [av_participants]. This is what was taken into account later.
- The population of the country in the year the protests began [population]
- Date of election of the new leader of the country [cur_leader_elected]. Initially, I used the date of inauguration, but it turned out that a number of protests took place even before this or that leader took office.
- Commander's date of birth [cur_elected_dob]
- The lack of freedom of the press index in the year the protests began [press_freedom_index (PFI)]. The higher, the more unfree
- The position of the country in the index of lack of freedom of the press in the year the protests began [press_freedom_index_pos (PFI_pos)]
Generation of new features/categories.
It is quite easy to calculate the duration of protests in days [duration], time in power in years [days_since_1st_election], the age of the lookout at the moment the movement starts [years_since_dob], as well as the proportion of protesters from the population of the country [protest_ratio].
let's go
The article contains some statistical calculations. There is not much data, but there is a lot. The author asks in advance to understand-forgive
The graphs will show only three categories of reasons for the protests (politics, elections, economics) as the most interesting.
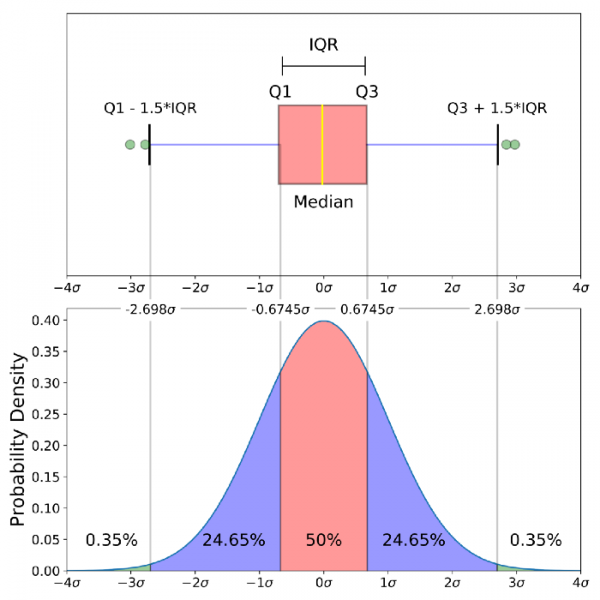
boxplot
Box plot, or “box with a mustache”, can be clearly illustrated with this figure:
Duration of protests
The first thing the author decided to study was the duration of the protests that took place.
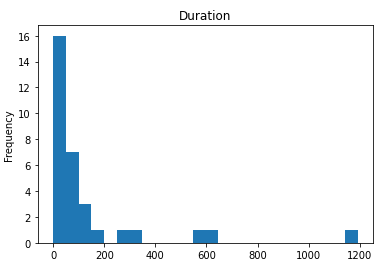
Based on the histogram, the main duration of the protests lasts up to 200 days. It is of interest how long successful and unsuccessful protests lasted, depending on the cause of occurrence:
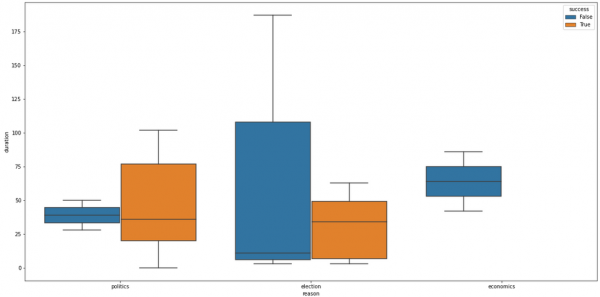
The distribution of the categories politics and election differ significantly. Due to the fact that the protests in Belarus were caused by the results of the elections, let's take a closer look at this table and this chart:
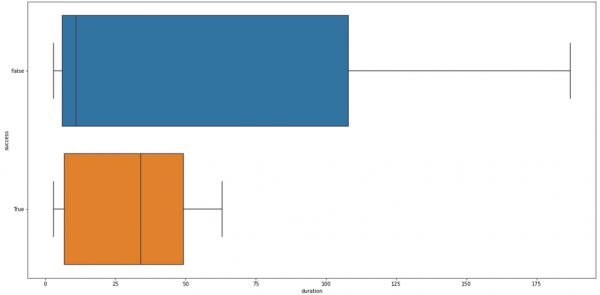
Based on the available data, it can be concluded that the "golden time" of a successful protest is approximately 6-8 weeks. A political scientist would probably point out that the low False median is due to the fact that some of the protests were quickly crushed in the bud. In the event that this could not be done, the best strategy was to wait and drag out the protest. The author separately analyzed that no one puts elections at the beginning of summer (June, July).
The situation in Belarus at the time of publication (31.08.2020/21/3) — XNUMX days have passed since the beginning of the protests aka XNUMX weeks.
Time in office
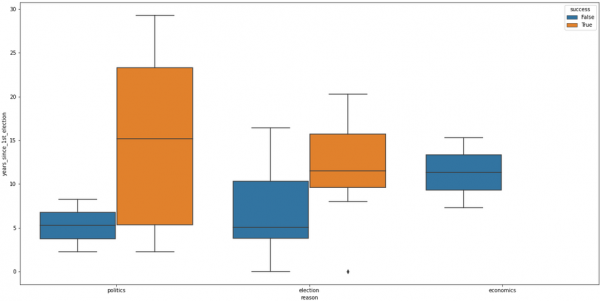
As you can see from the boxplot above, the longer you are in power, the more difficult it is to keep it as a result of the color revolution. Let's take a closer look at the situation around the elections:
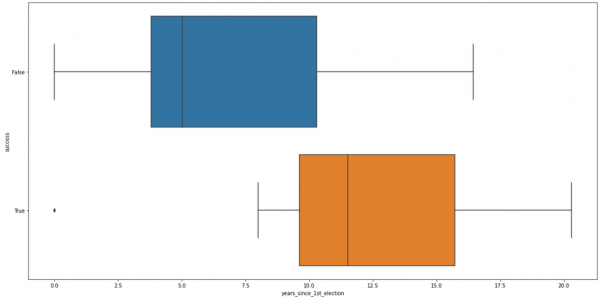
From the graph, you can see that the cup of patience of the people is about 2 terms and the quartiles practically do not overlap each other.
The situation in Belarus is unique in its way. There has not yet been a color revolution in a country where the ruler was in power for 26 years and went to the 6th term. On the other hand, it is quite easy for the author to present the result of a decision tree algorithm for which this question will not cause problems.
Age of power holder
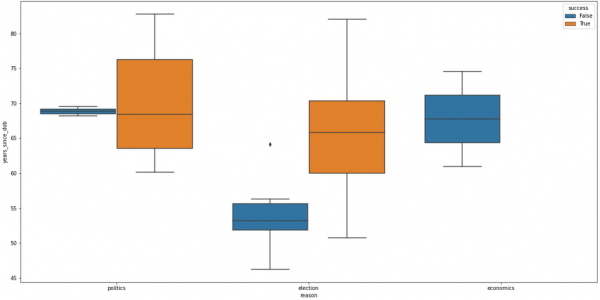
This graph shows how different distributions take place (no wonder with such and such amount of data). Let's take a closer look at the election schedule:
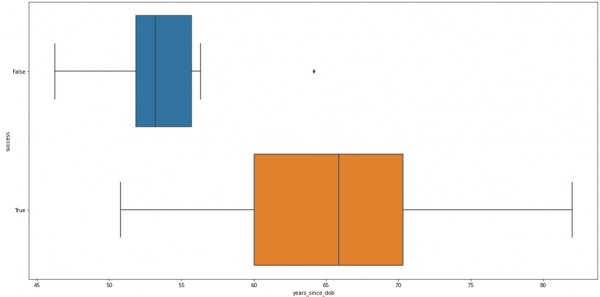
As in the example above, the quartiles of these boxplots do not overlap. Perhaps this is due to the fact that young and energetic politicians under 55 have more strength to resist colored protests. Or with how much they got power and how reluctantly they will part with it. Who knows?
The current president of Belarus turned 66 yesterday (or today?). In this case, the numbers are not in his favor.
(In)Press Freedom Index
According to the statements of people much smarter than the author, the lack of freedom of the press can serve as a signal of dictatorial tendencies. The Press Freedom Index is compiled by Reporters Without Borders. The higher the index, the worse things are with freedom of the press, according to this organization.
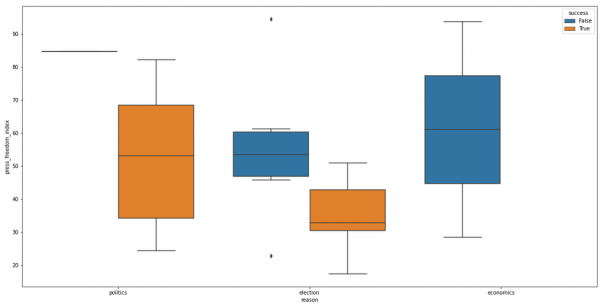
Based on these graphs, the freedom of the press has a bad effect on the retention of power. This can be understood, since the role of the press and TV, although weakening, still plays a rather important role. Consider the election situation:
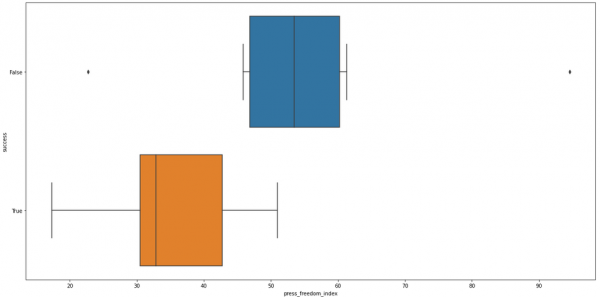
As in the previous cases, the quartiles did not overlap. The arrival of various social networks has changed the picture and the influence of media resources quite a lot, in this regard, it seems to the author to put 1986 in the Philippines and 2020 in Belarus on a par, but it is difficult.
In Belarus, the press freedom index is 49.25 for 2020. This is the most borderline value of all the samples that are presented in this article. And it is on the information fields that the main battles of the current revolution take place. Some employees of TV and radio companies are on strike. Komsomolskaya Pravda writes about the protests in Belarus, but cannot be printed due to a machine breakdown and so on. Russian political technologists are coming to Belarus at the invitation of the president, while the opposition is actively using Western social technologies. The scales are likely to outweigh each other more than once.
Share of protesters
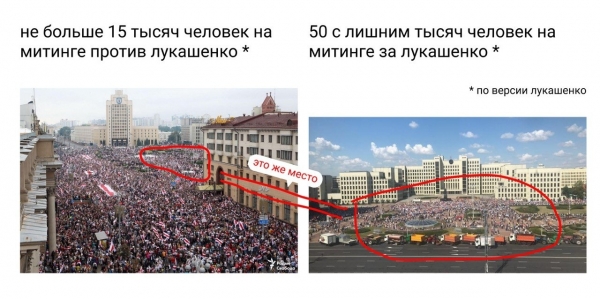
Perhaps one of the most difficult parameters. It seems that at rock concerts or other public events, the media and the authorities estimate the number of participants approximately the same.
But when information appears about protests in different countries, it seems that they were in different places. Or from different ends looked through binoculars. One way or another, the data were considered the same for everyone, so it is likely that they are comparable.
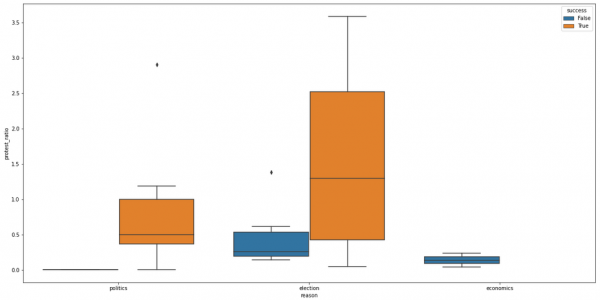
The graphs show that the larger the proportion of protesters, the more difficult it is to retain power. expected. Rather, the numbers themselves are of interest, including for the situation related to the elections:
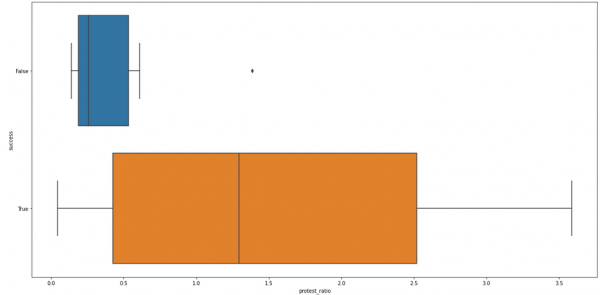
According to the boxplot, the critical mass is 0.5%. There was only a single case, regarded as an outlier, when almost 1.4% did not reach their goal (Armenia, 2008).
In Belarus, at the moment, according to the calculated formula, 1.33% participate in the protests. This figure also does not play into the hands of the current government.
Implications for the economy
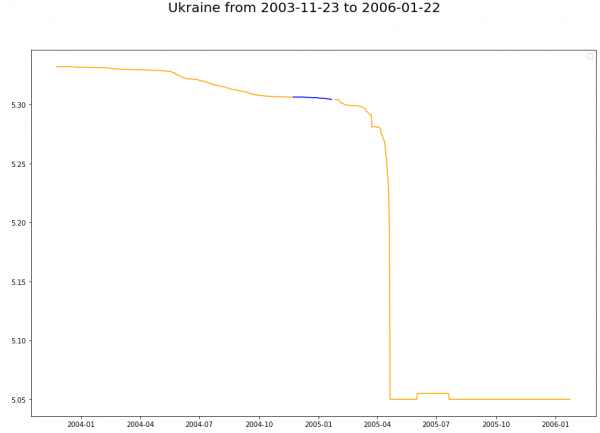
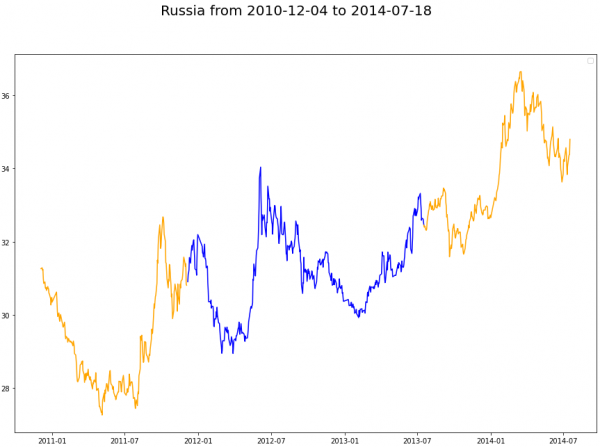
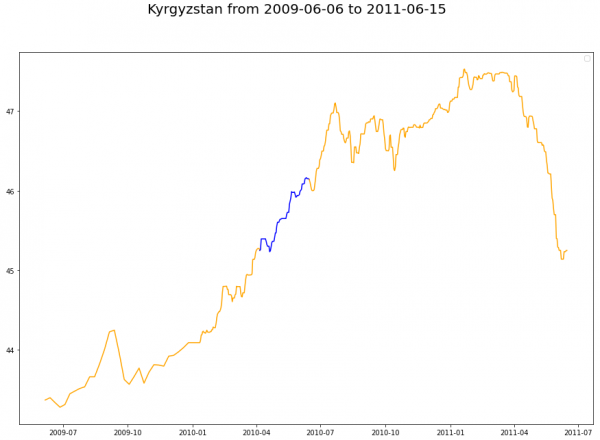
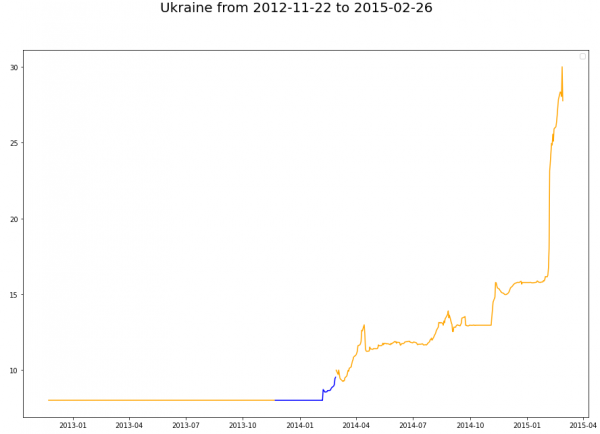
What will be lower can hardly be called the economy. The author did not find a better parameter for comparisons, how to study the volatility of the exchange rate of the national currency according to the National Bank against the US dollar. To complete the picture, a period of a year from the beginning of the protests and a year after the end was taken. The protest time on the charts is highlighted in blue.
The national currency is strengthening against the dollar
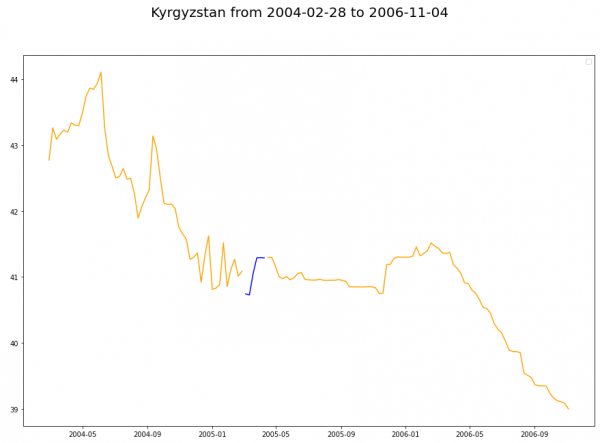
A similar scenario was observed several times in the countries of the former union. All things being equal, salaries in American rubles grew later.
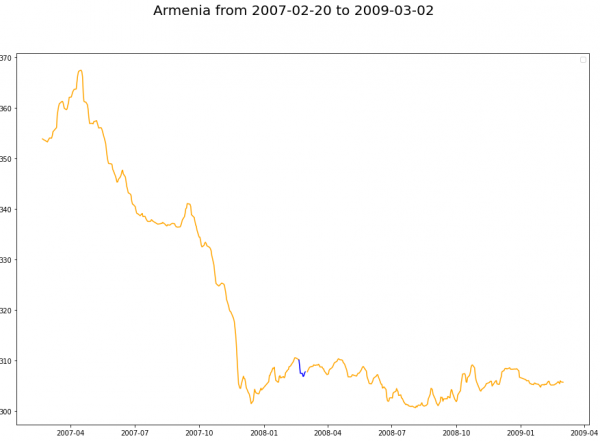
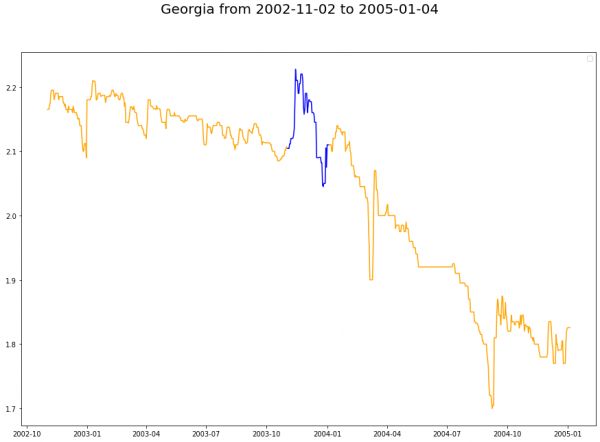
The national currency is relatively stable against the dollar
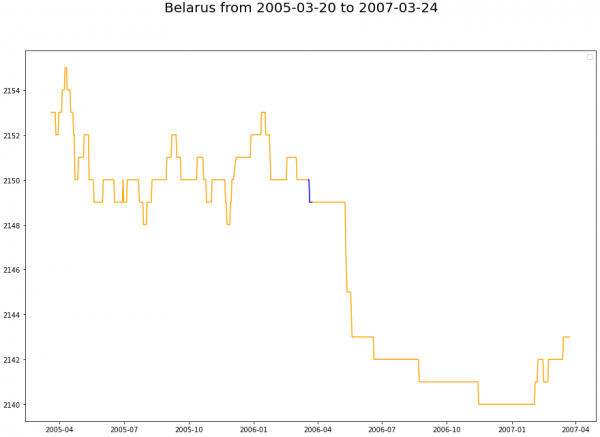
The stable qualities of national currencies were also noted in some of the color scenarios of the revolutions of the countries of the former union. In these cases, the exchange rate of the dollar changed relatively little.
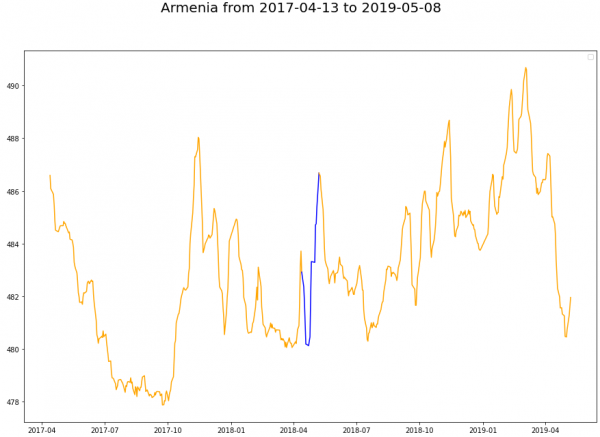
The national currency fell against the dollar
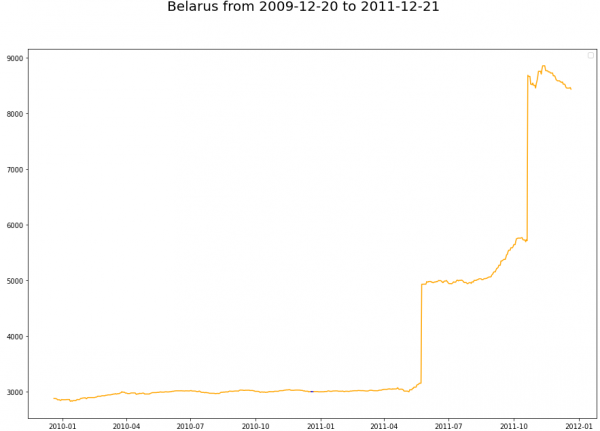
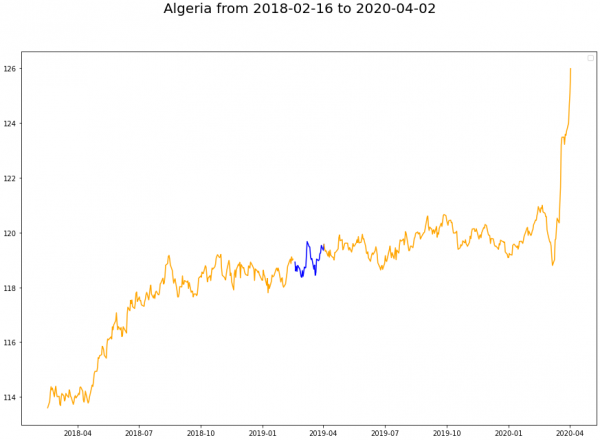
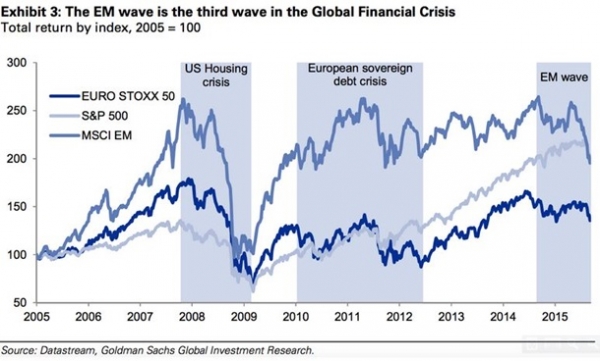
A year after the end of some of the protests, one could see an extremely deplorable situation regarding the national currency. Perhaps the last two phases of the 2008 economic crisis have contributed. The situation with Algeria is quite fresh - the local dinar was knocked down by COVID-19.
Current situation in Belarus
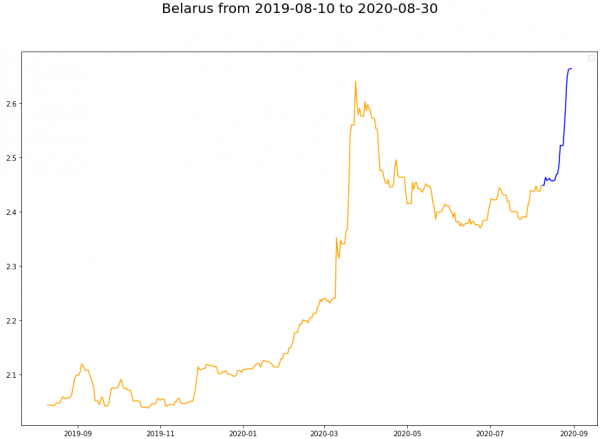
The situation in Belarus is quite difficult - earlier during the period of protests, only in Russia in 2012, the rate fell sharply by more than 10%. However, this took place far from the first days of the protests and during the passage of the 2nd phase of the global financial crisis. The author does not have any valuable knowledge in the field of economics and does not want to mislead people about the causes and consequences of the current situation.
dry residue
Although there are few data, they are quite convergent, which cannot but rejoice. Some observations and patterns are easy to interpret, some are a little more difficult.
The situation in Belarus is changing every other day, and what will happen next is clear only to a few.
Finally, I will give a t-SNE chart of color revolutions. All dates, non-numeric parameters and the result of revolutions were removed from the dataset.
Successful revolutions are marked in green, unsuccessful ones in red. Venezuela is marked in blue, the current situation in Belarus is marked in gray. The black dot marks the position where Belarus will be in 2 weeks, with other data fixed.
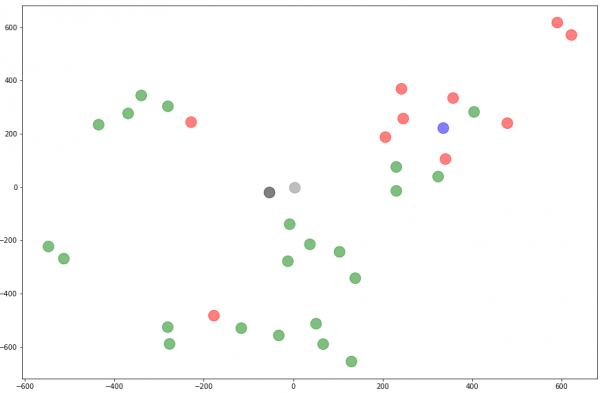
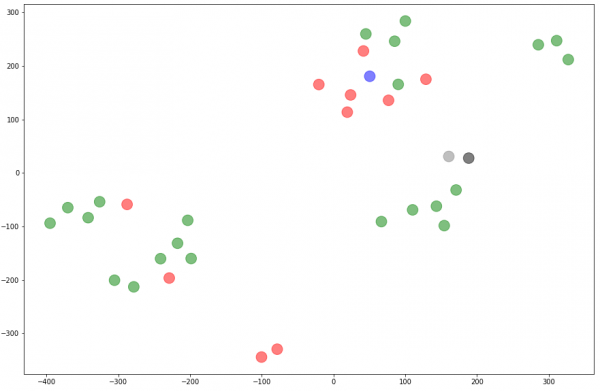
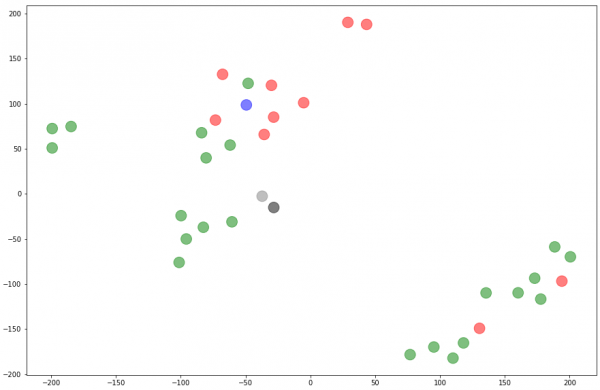
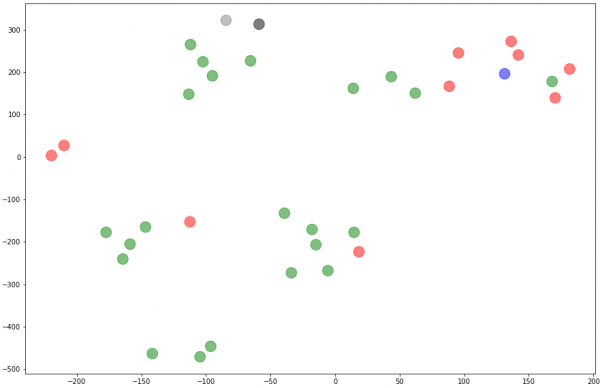
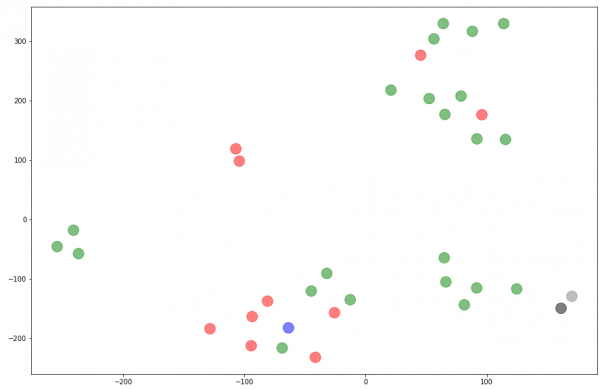
Clustering here smells a little and you can try to classify on coffee grounds. In this case, if we mark the area of red dots as a 'cluster' of failed revolutions, it can be seen that in the case of Venezuela, the dot is more red than green, which is confirmed by international opinion of political scientists. Belarus, represented by gray (current) and black (in 2 weeks), is heading to the camp of green brothers.
You can pay attention to the fact that in the neighborhood of Belarus there is a cluster of 5 green dots. The recent revolutions in Armenia (2018) и Algiers (2019), Georgia (2003). In the same cluster, a little further, there is a revolution on Philippines (1986) and South Korea (2016).
Epilogue
The author tried to objectively, as far as possible, present the situation with color revolutions in graphs. The situation in Belarus does not look in favor of the current autocrat, and only time will tell whether the author is right in his forecast.
If you have ideas for new categories or topics - write, we will study together.
“There are three types of lies: lies, blatant lies and statistics” (M. Twain)
Source: habr.com
