


Scalability is a key requirement for cloud applications. With Kubernetes, scaling an application is as simple as increasing the number of replicas for the corresponding deployment or ReplicaSet — but this is a manual process.
Kubernetes allows for automatic scaling of applications (that is, Pods in a deployment or ReplicaSet) declaratively using the Horizontal Pod Autoscaler specification. By default, the criteria for automatic scaling are CPU usage metrics (resource metrics), but you can also integrate custom metrics and metrics provided externally.
The command translated an article on how to use external metrics for automatic scaling of a Kubernetes application. To demonstrate how it all works, the author uses metrics from HTTP access requests, which are collected with Prometheus.
Instead of horizontal pod autoscaling, Kubernetes Event Driven Autoscaling (KEDA) is applied — an open-source Kubernetes operator. It integrates initially with the Horizontal Pod Autoscaler to provide seamless scaling (including to/from zero) for event-driven workloads. The code is available at .
A brief overview of the system operation
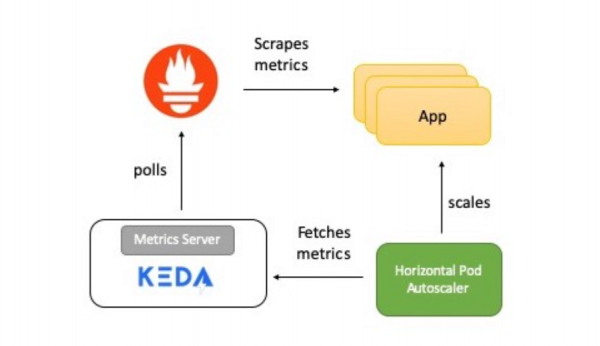
The diagram provides a brief description of how everything works:
- The application provides metrics on the number of HTTP requests in Prometheus format.
- Prometheus is set up to collect these metrics.
- The Prometheus scaler in KEDA is configured to automatically scale the application based on the number of HTTP requests.
Now I will detail each element.
KEDA and Prometheus
Prometheus is an open-source monitoring and alerting toolkit, part of . It collects metrics from various sources and stores them as time series data. Visualization tools such as or other visualization tools that work with the Kubernetes API can be used for data visualization.
KEDA supports the concept of a scaler — it acts as a bridge between KEDA and an external system. The implementation of the scaler is specific to each target system and extracts data from it. Then KEDA uses this data to manage automatic scaling.
Scalers support multiple data sources, such as Kafka, Redis, and Prometheus. This means KEDA can be applied for automatic scaling of Kubernetes deployments by using Prometheus metrics as criteria.
Test Application
The test Golang application provides HTTP access and performs two important functions:
- It uses the Prometheus Go client library for instrumenting the application and providing the http_requests metric, which contains a count of requests. The endpoint where the Prometheus metrics are available is located at the URI
/metrics.var httpRequestsCounter = promauto.NewCounter(prometheus.CounterOpts{ Name: "http_requests", Help: "number of http requests", }) - In response to a request
GETthe application increments the value of the key (access_count) in Redis. This is a simple way to perform the work as part of the HTTP handler, while also checking the Prometheus metrics. The metric value should match the valueaccess_countin Redis.func main() { http.Handle("/metrics", promhttp.Handler()) http.HandleFunc("/test", func(w http.ResponseWriter, r *http.Request) { defer httpRequestsCounter.Inc() count, err := client.Incr(redisCounterName).Result() if err != nil { fmt.Println("Unable to increment redis counter", err) os.Exit(1) } resp := "Accessed on " + time.Now().String() + "nAccess count " + strconv.Itoa(int(count)) w.Write([]byte(resp)) }) http.ListenAndServe(":8080", nil) }
The application is deployed in Kubernetes via Deployment. A service is also created ClusterIP, allowing the Prometheus server to access the application's metrics.
Here .
Prometheus Server
The Prometheus deployment manifest consists of:
ConfigMap— for passing the Prometheus config;Deployment— for deploying Prometheus in the Kubernetes cluster;ClusterIP— service for accessing the Prometheus UI;ClusterRole,ClusterRoleBindingandServiceAccount— for enabling service auto-discovery in Kubernetes.
Here .
KEDA Prometheus ScaledObject
The scaler acts as a bridge between KEDA and the external system from which it needs to obtain metrics. ScaledObject — a customizable resource that needs to be deployed to synchronize the deployment with the event source, in this case, Prometheus.
ScaledObject contains information about scaling the deployment, metadata about the event source (for example, credentials for connection, queue name), polling interval, recovery period, and other data. It refers to the corresponding autoscaling resource (HPA definition) for scaling the deployment.
When the object ScaledObject is deleted, its corresponding HPA definition is cleared.
Here is the definition ScaledObject for our example, it uses a scaler Prometheus:
apiVersion: keda.k8s.io/v1alpha1
kind: ScaledObject
metadata:
 name: prometheus-scaledobject
 namespace: default
 labels:
   deploymentName: go-prom-app
spec:
 scaleTargetRef:
   deploymentName: go-prom-app
 pollingInterval: 15
 cooldownPeriod:  30
 minReplicaCount: 1
 maxReplicaCount: 10
 triggers:
 - type: prometheus
   metadata:
     serverAddress:
http://prometheus-service.default.svc.cluster.local:9090
     metricName: access_frequency
     threshold: '3'
     query: sum(rate(http_requests[2m]))
Keep the following points in mind:
- It points to
Deploymentnamedgo-prom-app. - Trigger type is
Prometheus. The Prometheus server address is mentioned along with the metric name, threshold value, and , which will be used. The PromQL query issum(rate(http_requests[2m])). - According to
pollingInterval, KEDA queries the target from Prometheus every fifteen seconds. At least one pod is supported (minReplicaCount), while the maximum number of pods does not exceedmaxReplicaCountin this example—ten.
Can be set minReplicaCount to zero. In this case, KEDA starts the deployment from zero to one, and then provides HPA for further automatic scaling. The reverse order is also possible, i.e., scaling from one to zero. In the example, we did not select zero since this is an HTTP service, not a demand-based system.
The magic of autoscaling
The threshold value is used as a trigger for scaling the deployment. In our example, the PromQL query sum(rate(http_requests[2m])) returns the aggregated value of the HTTP request rate (number of requests per second), measured over the last two minutes.
Since the threshold value is three, there will be one pod while the value sum(rate(http_requests[2m])) is less than three. If the value increases, an additional pod is added each time it sum(rate(http_requests[2m])) increases by three. For example, if the value goes from 12 to 14, the number of pods is four.
Now let's try to set it up!
Pre-setup
All you need is a Kubernetes cluster and the configured utility kubectl. This example uses a cluster minikube, but you can use any other. For cluster installation, there is .
Install the latest version on Mac:
curl -Lo minikube
https://storage.googleapis.com/minikube/releases/latest/minikube-linux-amd64
&& chmod +x minikube
sudo mkdir -p /usr/local/bin/
sudo install minikube /usr/local/bin/
Install , to access the Kubernetes cluster.
Install the latest version on Mac:
curl -LO
"https://storage.googleapis.com/kubernetes-release/release/$(curl -s https://storage.googleapis.com/kubernetes-release/release/stable.txt)/bin/darwin/amd64/kubectl"
chmod +x ./kubectl
sudo mv ./kubectl /usr/local/bin/kubectl
kubectl version
Installing KEDA
You can deploy KEDA in several ways, which are listed in . I am using a monolithic YAML:
kubectl apply -f
https://raw.githubusercontent.com/kedacore/keda/master/deploy/KedaScaleController.yaml
KEDA and its components are installed in the namespace keda. The command to check:
kubectl get pods -n keda
Wait for the KEDA Operator pod to start — change to Running State. And then continue.
Installing Redis using Helm
If you do not have Helm installed, use this . The command to install on Mac:
brew install kubernetes-helm
helm init --history-max 200
helm init initializes the local command line interface and also installs Tiller in the Kubernetes cluster.
kubectl get pods -n kube-system | grep tiller
Wait for the Tiller pod to go to the Running state.
Translator's Note: The author uses Helm@2, which requires the installation of the server component Tiller. Helm@3 is current, and it does not require a server component.
After installing Helm, you can start Redis with just one command:
helm install --name redis-server --set cluster.enabled=false --set
usePassword=false stable/redis
Make sure Redis has started successfully:
kubectl get pods/redis-server-master-0
Wait for the Redis pod to go to the state of Running.
Deploying the Application
The command for deployment:
kubectl apply -f go-app.yaml

//output
deployment.apps/go-prom-app created
service/go-prom-app-service created
Check that everything has started:
kubectl get pods -l=app=go-prom-app
Wait for Redis to go to the state of Running.
Deploying the Prometheus Server
The Prometheus manifest uses . It allows dynamically discovering application pods based on the service label.
kubernetes_sd_configs:
   - role: service
   relabel_configs:
   - source_labels: [__meta_kubernetes_service_label_run]
     regex: go-prom-app-service
     action: keep
For deployment:
kubectl apply -f prometheus.yaml

//output
clusterrole.rbac.authorization.k8s.io/prometheus created
serviceaccount/default configured
clusterrolebinding.rbac.authorization.k8s.io/prometheus created
configmap/prom-conf created
deployment.extensions/prometheus-deployment created
service/prometheus-service created
Check that everything has started:
kubectl get pods -l=app=prometheus-server
Wait until the Prometheus pod goes to the state of Running.
Use kubectl port-forward to access the Prometheus user interface (or API server) at .
kubectl port-forward service/prometheus-service 9090
Deploying the KEDA autoscaling configuration
The command to create ScaledObject:
kubectl apply -f keda-prometheus-scaledobject.yaml
Check the logs of the KEDA operator:
KEDA_POD_NAME=$(kubectl get pods -n keda
-o=jsonpath='{.items[0].metadata.name}')
kubectl logs $KEDA_POD_NAME -n keda
The result looks something like:
time="2019-10-15T09:38:28Z" level=info msg="Watching ScaledObject:
default/prometheus-scaledobject"
time="2019-10-15T09:38:28Z" level=info msg="Created HPA with
namespace default and name keda-hpa-go-prom-app"
Check under the applications. There should be one instance running, as minReplicaCount equal to 1:
kubectl get pods -l=app=go-prom-app
Verify that the HPA resource is created successfully:
kubectl get hpa
You should see something like:
NAME                   REFERENCE                TARGETS     MINPODS   MAXPODS   REPLICAS   AGE
keda-hpa-go-prom-app   Deployment/go-prom-app   0/3 (avg)   1         10        1          45s
Health check: accessing the application
To access the REST endpoint of our application, run:
kubectl port-forward service/go-prom-app-service 8080
Now you can access the Go application using the address : To do this, execute the command:
curl http://localhost:8080/test
The result looks something like:
Accessed on 2019-10-21 11:29:10.560385986 +0000 UTC
m=+406004.817901246
Access count 1
At this stage, also check Redis. You will see that the key access_count has increased to 1:
kubectl exec -it redis-server-master-0 -- redis-cli get access_count
//output
"1"
Make sure the metric value http_requests is the same:
curl http://localhost:8080/metrics | grep http_requests
//output
# HELP http_requests number of http requests
# TYPE http_requests counter
http_requests 1
Generating load
We will use — a tool for generating load:
curl -o hey https://storage.googleapis.com/hey-release/hey_darwin_amd64
&& chmod a+x hey
You can also download the tool for or .
Run it:
./hey http://localhost:8080/test
By default, the tool sends 200 requests. You can verify this using Prometheus metrics and Redis.
curl http://localhost:8080/metrics | grep http_requests
//output
# HELP http_requests number of http requests
# TYPE http_requests counter
http_requests 201
kubectl exec -it redis-server-master-0 -- redis-cli get access_count
//output
201
Confirm the actual metric value (returned by the PromQL query):
curl -g
'http://localhost:9090/api/v1/query?query=sum(rate(http_requests[2m]))'
//output
{"status":"success","data":{"resultType":"vector","result":[{"metric":{},"value":[1571734214.228,"1.686057971014493"]}]}}
In this case, the actual result equals 1,686057971014493 and is displayed in the field value. This is not enough for scaling since the threshold we set is 3.
More load!
In a new terminal, monitor the number of application pods:
kubectl get pods -l=app=go-prom-app -w
Let's increase the load with the command:
./hey -n 2000 http://localhost:8080/test
After a while, you will see that the HPA scales the deployment and starts new pods. Check the HPA to confirm:
kubectl get hpa
NAME                   REFERENCE                TARGETS         MINPODS   MAXPODS   REPLICAS   AGE
keda-hpa-go-prom-app   Deployment/go-prom-app   1830m/3 (avg)   1         10        6          4m22s
If the load is variable, the deployment will scale down to the point where only one pod is running. If you want to check the actual metric (returned by the PromQL query), use the command:
curl -g
'http://localhost:9090/api/v1/query?query=sum(rate(http_requests[2m]))'
Clear
//Delete KEDA
kubectl delete namespace keda
//Delete the app, Prometheus server and KEDA scaled object
kubectl delete -f .
//Delete Redis
helm del --purge redis-server
Conclusion
KEDA enables automatic scaling of your Kubernetes deployments (up/down to zero) based on data from external metrics. For example, based on Prometheus metrics, queue length in Redis, or consumer lag in a Kafka topic.
KEDA integrates with external sources and provides their metrics through the Metrics Server for the Horizontal Pod Autoscaler.
Good luck!
What else to read:
- .
- .
- .
Source: habr.com
