

In large cloud systems, the issue of automatic load balancing or distribution of computational resources is particularly acute. This concern has also been addressed by Tionix (a developer and operator of cloud services, part of the Rostelecom group of companies).
And since our main development platform is OpenStack, and we, like all humans, are lazy, it was decided to find some ready-made module that is already part of the platform. We chose Watcher, which we decided to use for our needs.
First, let's clarify the terms and definitions.
Terms and Definitions
The goal — a human-readable, observable, and measurable end result that needs to be achieved. For each goal, one or more strategies are available. A strategy is the implementation of an algorithm capable of finding a solution to this goal.
Action (Action) — is a basic task that changes the current state of the managed resource in the OpenStack cluster, such as: migrating a virtual machine (migration), changing the power state of a node (change_node_power_state), changing the state of a nova service (change_nova_service_state), resizing (resize), registering a NOP message (nop), absence of actions for a specified duration — pause (sleep), migrating a disk (volume_migrate).
Action Plan (Action Plan) — a specific sequence of actions carried out in a certain order to achieve a specific Goal. The action plan also contains an assessed overall effectiveness with a set of performance indicators. The action plan is generated by Watcher after a successful audit, resulting in the chosen strategy finding a solution to achieve the goal. The action plan consists of a list of sequential actions.
Audit (Audit) — is a request for optimization of the cluster. Optimization is carried out to achieve one Goal within this cluster. For each successful audit, Watcher generates an Action Plan.
Audit Scope (Audit Scope) — is a set of resources within which an audit is conducted (availability zone(s), node aggregators, individual compute nodes, or storage nodes, etc.). The audit area is defined in each template. If the audit area is not specified, the entire cluster is audited.
Audit Template — a saved set of settings for running an audit. Templates are necessary for repeatedly running audits with the same settings. The template must contain the purpose of the audit; if strategies are not specified, the most suitable existing strategies are chosen.
Cluster — is a set of physical machines that provide computing resources, storage resources, and networking resources and are managed by the same OpenStack management node.
Cluster Data Model (CDM) — is a logical representation of the current state and topology of resources managed by the cluster.
Efficacy Indicator — an indicator that shows how well a solution created using this strategy is performing. Efficacy indicators are specific to particular goals and are typically used to calculate the overall effectiveness of the resulting action plan.
Efficacy Specification — is a set of specific features related to each Goal, which defines various efficacy indicators that the strategy ensuring the achievement of the corresponding goal must provide in its solution. Indeed, each solution proposed by the strategy will be checked for compliance with the specification before calculating its overall efficacy.
Scoring Engine — is an executable file that has clearly defined inputs, clearly defined outputs, and performs a purely mathematical task. Thus, the calculation does not depend on the environment in which it is executed — it will yield the same result anywhere.
Watcher Planner — part of the decision-making mechanism of Watcher. This module takes a set of actions generated by the strategy and creates a workflow plan that defines how to schedule these various actions over time and what the prerequisites are for each action.
Goals and Strategies of Watcher
The goal
Strategies
Dummy goal
Dummy Strategy
Dummy Strategy using sample Scoring Engines
Dummy strategy with resize
Saving Energy
Saving Energy Strategy
Server Consolidation
Basic Offline Server Consolidation
VM Workload Consolidation Strategy
Workload Balancing
Workload Balance Migration Strategy
Storage Capacity Balance Strategy
Workload stabilization
Noisy Neighbor
Noisy Neighbor
Thermal Optimization
Outlet temperature based strategy
Airflow Optimization
Uniform airflow migration strategy
Hardware maintenance
Zone migration
Unclassified
Actuator
Dummy goal — a reserved goal that is used for testing purposes.
Related strategies: Dummy Strategy, Dummy Strategy using sample Scoring Engines, and Dummy strategy with resize. Dummy strategy is a placeholder strategy used for integration testing through Tempest. This strategy provides no beneficial optimization; its sole purpose is to run Tempest tests.
Dummy strategy using sample Scoring Engines is similar to the previous one, differing only by the use of a sample ‘scoring engine’ that counts using machine learning methods.
Dummy strategy with resize is similar to the previous one, differing only by the use of flavor changes (migration and resizing).
Not used in production.
Saving Energy — to minimize energy consumption. The strategy of this goal, Saving Energy Strategy, works in conjunction with VM Workload Consolidation Strategy (Server Consolidation) to perform dynamic power management (DPM) functions, saving electricity through the dynamic consolidation of workloads even during periods of low resource utilization: virtual machines are moved to fewer nodes, and unnecessary nodes are powered off. After consolidation, the strategy offers a solution for powering nodes on/off according to specified parameters: “min_free_hosts_num” — the number of free powered-on nodes waiting for load, and “free_used_percent” — the percentage ratio of free powered-on nodes to the number of nodes occupied by machines. For the strategy to work, Ironic must be enabled and configured to work with power on/off states of the nodes.
Strategy parameters
parameter
post. You can draw a conditional analogy: an index is a database, while a type is a table in that database. Each type has its own schema —
default
description
free_used_percent
Number
10.0
the ratio of the number of free compute nodes to the number of compute nodes with virtual machines
min_free_hosts_num
Int
1
minimum number of free compute nodes
There must be at least two nodes in the cloud. The method used is changing the power state of the node (change_node_power_state). The metric collection strategy does not require.
Server Consolidation — minimize the number of compute nodes (consolidation). It has two strategies: Basic Offline Server Consolidation and VM Workload Consolidation Strategy.
The Basic Offline Server Consolidation strategy minimizes the total number of servers used, as well as minimizes the number of migrations.
The basic strategy requires the following metrics:
metric
service
plugins
saying, "So how did it all end up?". In response to my detailed answer, I heard, "This deserves an article." Well, if it deserves, then there will be an article. Maybe someone will find it useful. From it, the reader will learn some facts about the design of QEMU code generation backends, as well as how to write a Just-in-Time compiler for a web application.
compute.node.cpu.percent
none
cpu_util
none
Strategy parameters: migration_attempts — the number of combinations to find potential candidates for shutdown (default 0, no limits), period — the time interval in seconds for obtaining static aggregation from the metric data source (default 700).
Methods used: migration, changing the nova service state (change_nova_service_state).
The VM Workload Consolidation Strategy is based on a first-fit heuristic algorithm that focuses on measured CPU load and attempts to minimize nodes that have either too high or too low a load, considering resource capacity constraints. This strategy provides a solution that leads to more efficient resource utilization in the cluster, using the following four phases:
- Unload phase — processing over-utilized resources;
- Consolidation phase — processing under-utilized resources;
- Solution optimization — reducing the number of migrations;
- Turning off unused compute nodes.
The strategy requires the following metrics:
metric
service
plugins
saying, "So how did it all end up?". In response to my detailed answer, I heard, "This deserves an article." Well, if it deserves, then there will be an article. Maybe someone will find it useful. From it, the reader will learn some facts about the design of QEMU code generation backends, as well as how to write a Just-in-Time compiler for a web application.
memory
none
disk.root.size
none
The following metrics are not mandatory but improve the strategy's accuracy if available:
metric
service
plugins
saying, "So how did it all end up?". In response to my detailed answer, I heard, "This deserves an article." Well, if it deserves, then there will be an article. Maybe someone will find it useful. From it, the reader will learn some facts about the design of QEMU code generation backends, as well as how to write a Just-in-Time compiler for a web application.
memory.resident
none
cpu_util
none
Strategy parameters: period — the time interval in seconds for obtaining static aggregation from the metric data source (default 3600).
Uses the same methods as the previous strategy. More details .
Workload Balancing — balance the workload between compute nodes. The goal involves three strategies: Workload Balance Migration Strategy, Workload stabilization, Storage Capacity Balance Strategy.
The Workload Balance Migration Strategy initiates virtual machine migrations based on the workload of the node's virtual machines. The decision to migrate is made whenever the CPU or RAM usage of the node exceeds a specified threshold. The migrating virtual machine should bring the node closer to the average workload of all nodes.
Requirements
- Use of physical processors;
- At least two physical compute nodes;
- An installed and configured Ceilometer component — ceilometer-agent-compute, running on each compute node, and the Ceilometer API, as well as the collection of the following metrics:
metric
service
plugins
saying, "So how did it all end up?". In response to my detailed answer, I heard, "This deserves an article." Well, if it deserves, then there will be an article. Maybe someone will find it useful. From it, the reader will learn some facts about the design of QEMU code generation backends, as well as how to write a Just-in-Time compiler for a web application.
cpu_util
none
memory.resident
none
Strategy parameters:
parameter
post. You can draw a conditional analogy: an index is a database, while a type is a table in that database. Each type has its own schema —
default
description
metrics
String
'cpu_util'
Metrics underlying: 'cpu_util', 'memory.resident'.
threshold
Number
25.0
Workload threshold for migration.
period
Number
300
Total period of Ceilometer.
The method used is migration.
Workload stabilization is a strategy aimed at stabilizing workload using live migration. The strategy is based on a standard deviation algorithm and determines whether there is an overload in the cluster and responds by initiating migrations to stabilize the cluster.
Requirements
- Use of physical processors;
- At least two physical compute nodes;
- An installed and configured Ceilometer component — ceilometer-agent-compute, running on each compute node, and the Ceilometer API, as well as the collection of the following metrics:
metric
service
plugins
saying, "So how did it all end up?". In response to my detailed answer, I heard, "This deserves an article." Well, if it deserves, then there will be an article. Maybe someone will find it useful. From it, the reader will learn some facts about the design of QEMU code generation backends, as well as how to write a Just-in-Time compiler for a web application.
cpu_util
none
memory.resident
none
The Storage Capacity Balance Strategy (implemented since Queens) migrates disks based on the load of Cinder pools. The decision to migrate is made whenever the pool usage ratio exceeds a specified threshold. The migrating disk should bring the pool closer to the average load of all Cinder pools.
Requirements and constraints
- At least two Cinder pools;
- Ability to migrate disks.
- Cluster data model — Cinder cluster data model collector.
Strategy parameters:
parameter
post. You can draw a conditional analogy: an index is a database, while a type is a table in that database. Each type has its own schema —
default
description
volume_threshold
Number
80.0
Threshold value of disks for volume balancing.
The method used is disk migration (volume_migrate).
Noisy Neighbor — identify and migrate the 'noisy neighbor' — a low-priority virtual machine that adversely affects the performance of a high-priority virtual machine in terms of IPC, excessively using the Last Level Cache. Its own strategy: Noisy Neighbor (strategy parameter used — cache_threshold (default value — 35), migration is triggered when performance drops to the specified value. For the strategy to operate, the following must be enabled LLC (Last Level Cache) metrics, the latest Intel server supporting CMT, as well as the collection of the following metrics:
metric
service
plugins
saying, "So how did it all end up?". In response to my detailed answer, I heard, "This deserves an article." Well, if it deserves, then there will be an article. Maybe someone will find it useful. From it, the reader will learn some facts about the design of QEMU code generation backends, as well as how to write a Just-in-Time compiler for a web application.
cpu_l3_cache
none
Intel required .
Cluster data model (default): Nova cluster data model collector. The method applied is migration.
Working with this goal through the Dashboard is not fully implemented in Queens.
Thermal Optimization — optimize the temperature regime. The output temperature (exhaust air) is one of the important thermal telemetry systems for measuring the state of the thermal/workload of the server. There is one strategy for this purpose — Outlet temperature based strategy, which makes decisions about moving workloads to nodes with a favorable temperature regime (the lowest outlet temperature) when the outlet temperature of the source hosts reaches a configurable threshold.
To operate the strategy, a server with the Intel Power Node Manager installed and configured is required. , as well as the collection of the following metrics:
metric
service
plugins
saying, "So how did it all end up?". In response to my detailed answer, I heard, "This deserves an article." Well, if it deserves, then there will be an article. Maybe someone will find it useful. From it, the reader will learn some facts about the design of QEMU code generation backends, as well as how to write a Just-in-Time compiler for a web application.
hardware.ipmi.node.outlet_temperature
IPMI
Strategy parameters:
parameter
post. You can draw a conditional analogy: an index is a database, while a type is a table in that database. Each type has its own schema —
default
description
threshold
Number
35.0
Temperature threshold for migration.
period
Number
30
Time interval in seconds for obtaining statistical aggregation from the data source of the metric.
The method used is migration.
Airflow Optimization — optimize ventilation mode. The proprietary strategy — Uniform Airflow using live migration. The strategy initiates the migration of a virtual machine whenever the airflow from the server's fan exceeds the specified threshold.
The following are required for the strategy to work:
- Hardware: compute nodes <with NodeManager 3.0 support;
- At least two compute nodes;
- The ceilometer-agent-compute component and Ceilometer API must be installed and configured on each compute node, which can successfully report metrics such as airflow, system power, inlet temperature:
metric
service
plugins
saying, "So how did it all end up?". In response to my detailed answer, I heard, "This deserves an article." Well, if it deserves, then there will be an article. Maybe someone will find it useful. From it, the reader will learn some facts about the design of QEMU code generation backends, as well as how to write a Just-in-Time compiler for a web application.
hardware.ipmi.node.airflow
IPMI
hardware.ipmi.node.temperature
IPMI
hardware.ipmi.node.power
IPMI
To operate the strategy, a server with the Intel Power Node Manager 3.0 or later installed and configured is necessary.
Limitations: The concept is not intended for production.
It is recommended to use this algorithm with continuous audits, as only one virtual machine migration is planned per iteration.
Live migrations are possible.
Strategy parameters:
parameter
post. You can draw a conditional analogy: an index is a database, while a type is a table in that database. Each type has its own schema —
default
description
threshold_airflow
Number
400.0
Airflow threshold for migration. Unit is 0.1CFM
threshold_inlet_t
Number
28.0
Inlet temperature threshold for migration decision
threshold_power
Number
350.0
System power threshold for migration decision
period
Number
30
Time interval in seconds for obtaining statistical aggregation from the data source of the metric.
The method used is migration.
Hardware Maintenance — hardware maintenance. The strategy related to this goal is Zone migration. This strategy serves as a tool for efficient automatic and minimum migration of virtual machines and disks when hardware maintenance is required. The strategy establishes an action plan based on weights: actions with higher weights will be scheduled before others. There are two configuration parameters: action weights (action_weights) and parallelization.
Restrictions: configuration of action weights and parallelization is required.
Strategy parameters:
parameter
post. You can draw a conditional analogy: an index is a database, while a type is a table in that database. Each type has its own schema —
default
description
compute_nodes
array
None
Compute nodes for migration.
storage_pools
array
None
Storage nodes for migration.
parallel_total
integer
6
Total number of actions that should be executed in parallel.
parallel_per_node
integer
2
Number of actions executed in parallel for each compute node.
parallel_per_pool
integer
2
Number of actions executed in parallel for each storage pool.
priority
object
None
A list of priorities for virtual machines and disks.
with_attached_volume
boolean
False
False — virtual machines will be moved after all disks have been transferred. True — virtual machines will be moved after the migration of all attached disks.
Array elements of compute nodes:
parameter
post. You can draw a conditional analogy: an index is a database, while a type is a table in that database. Each type has its own schema —
default
description
src_node
string
None
Compute node from which virtual machines are being transferred (mandatory).
dst_node
string
None
Compute node to which virtual machines are migrating.
Array elements of storage nodes:
parameter
post. You can draw a conditional analogy: an index is a database, while a type is a table in that database. Each type has its own schema —
default
description
src_pool
string
None
Storage pool from which disks are being moved (mandatory).
dst_pool
string
None
Storage pool to which disks are being moved.
src_type
string
None
Source disk type (mandatory).
dst_type
string
None
Destination disk type (mandatory).
Elements of object priority:
parameter
post. You can draw a conditional analogy: an index is a database, while a type is a table in that database. Each type has its own schema —
default
description
project
array
None
Project names.
compute_node
array
None
Names of compute nodes.
storage_pool
array
None
Names of storage pools.
compute
enum
None
Virtual machine parameters [“vcpu_num”, “mem_size”, “disk_size”, “created_at”].
storage
enum
None
Disk parameters [“size”, “created_at”].
Used methods — migration of virtual machines, migration of disks.
Unclassified — an auxiliary goal used to facilitate the strategy development process. It does not contain specifications and can be used whenever a strategy is not yet tied to an existing goal. This goal can also serve as a transitional stage. The strategy associated with this goal is Actuator.
Creating a new goal
Watcher Decision Engine has an external target plugin interface that allows integrating an external target that can be achieved using a strategy.
Before creating a new target, ensure that none of the existing targets meet your needs.
Creating a New Plugin
To create a new target, you need to: extend the target class, implement the class method get_name() to return the unique identifier of the new target you want to create. This unique identifier must match the entry point name you declare later.
Next, you need to implement the class method get_display_name() to return the translated display name of the target you want to create (do not use a variable to return the translated string so that it can be automatically assembled by the translation tool).
Implement the class method get_translatable_display_name()to return the translation key (effectively the English display name) of your new target. The returned value should match the string translated in get_display_name().
Implement its method get_efficacy_specification()to return the efficacy specification for your target. The get_efficacy_specification() method returns an instance of Unclassified(), provided by Watcher. This efficacy specification is useful during the development of your target, as it corresponds to an empty specification.
→
Watcher Architecture (more details ).
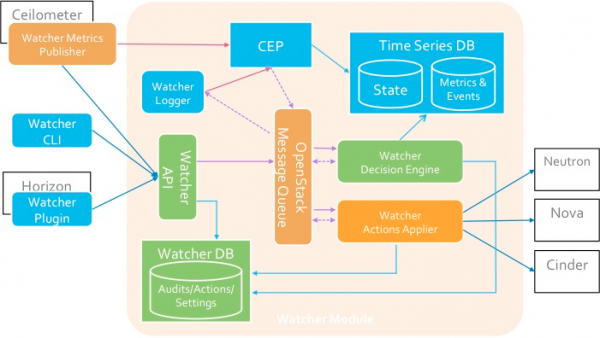
Components
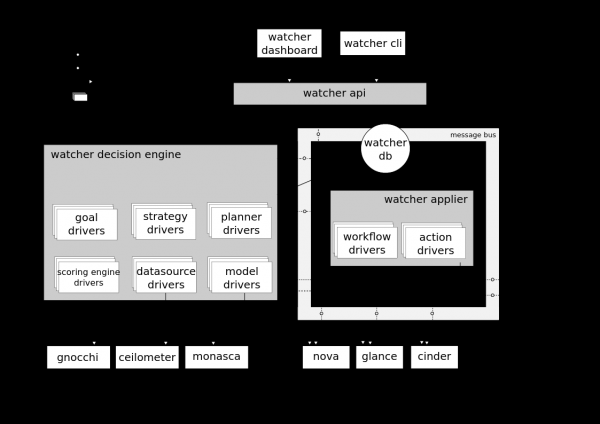
Watcher API — a component implementing the REST API provided by Watcher. Interaction mechanisms: CLI, Horizon plugin, Python SDK.
Watcher DB — the Watcher database.
Watcher Applier — a component that implements the execution of the action plan created by the Watcher Decision Engine component.
Watcher Decision Engine — a component responsible for calculating a set of potential optimization actions to execute for the audit target. If no strategy is specified, the component selects the most appropriate one on its own.
Watcher Metrics Publisher — a component that collects and computes some metrics or events and publishes them to the CEP endpoint. The component's functionality can also be provided by the Ceilometer publisher.
Complex Event Processing (CEP) Engine — a comprehensive event processing engine. For performance reasons, there may be multiple instances of the CEP Engine running simultaneously, each handling a specific type of metric/event. In the Watcher system, CEP triggers two types of actions: — write the corresponding events/metrics to the time series database; — send the relevant events to the Watcher Decision Engine component when the event may impact the outcome of the current optimization strategy, as the OpenStack cluster is not a static system.
Component interaction is carried out via the AMQP protocol.
→
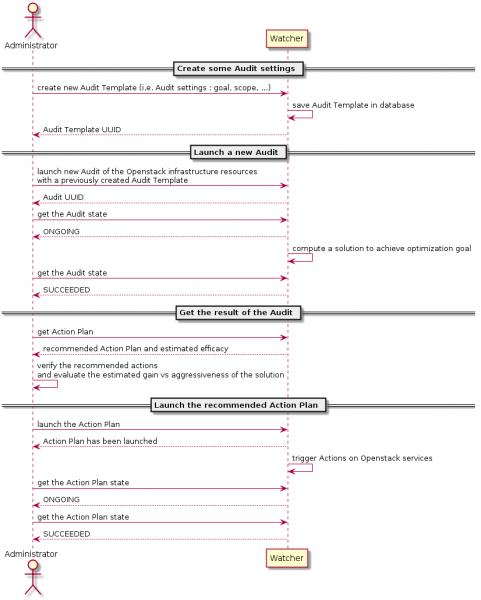
Interaction diagram with Watcher
Watcher testing results
- On the Optimization — Action plans page, a 500 error occurs (both on clean Queens and on the stand with Tionix modules), appearing only after the audit is initiated and an action plan is generated; a blank page opens normally.
- In the Action details tab, errors occur, failing to retrieve the audit target and strategy (both on clean Queens and on the stand with Tionix modules).
- Audits with the target Dummy (test) are created and initiated normally, action plans are generated.
- Audits with the target Unclassified are not created, as the target is non-functional and intended for intermediate configuration when developing new strategies.
- Audits with the target Workload Balancing (Storage Capacity balance strategy) are created successfully, but an action plan is not generated. No optimization of storage pools is required.
- Audits with the target Workload Balancing (Workload Balance Migration Strategy) are created successfully, but an action plan is not generated.
- Audits with the target Workload Balancing (Workload Stabilization Strategy) finish with an error.
- Audits with the target Noisy Neighbor are created successfully, but an action plan is not generated.
- Audits with the target Hardware maintenance are created successfully, but the action plan is not fully generated (performance metrics are generated, but the action list itself is not).
- Changes in nova.conf configs (in the default section compute_monitors = cpu.virt_driver) on the compute and control nodes do not fix the errors.
- Audits with the target Server Consolidation (Basic strategy) also finish with an error.
- Audits with the target Server Consolidation (VM workload consolidation strategy) finish with an error. The logs show an error obtaining the source data. Discussion of the error, in particular, .
We tried to specify in the Watcher config file (it didn't help — as a result, errors on all Optimization pages, reverting to the original content of the config file doesn't fix the situation):[watcher_strategies.basic]
datasource = ceilometer, gnocchi - Audits aimed at Saving Energy are ending with an error. According to the logs, the issue is indeed the absence of Ironic; it will not work without the baremetal service.
- Audits aimed at Thermal Optimization are ending with an error. The traceback is the same as for Server Consolidation (VM workload consolidation strategy) (input data error)
- Audits aimed at Airflow Optimization are ending with an error.
The following audit completion errors are also encountered. The traceback is in the logs decision-engine.log (cluster state undefined).
→ Discussion of the error
Conclusion
The result of our two-month investigation is a clear conclusion that to achieve a fully functional load balancing system, we will need to closely engage in improving the tools for the Openstack platform.
Watcher has proven to be a serious and rapidly developing product with immense potential, for full utilization of which significant and serious work will be required.
But more on this in the next articles of the series.
Source: habr.com
