


Hello everyone! My name is Dmitry Samsonov, and I work as a lead system administrator at "Odnoklassniki." We have over 7,000 physical servers, 11,000 containers in our cloud, and 200 applications that form 700 different clusters in various configurations. The overwhelming majority of servers run on CentOS 7.
On August 14, 2018, information was published about the FragmentSmack vulnerability.
() and SegmentSmack (). These are vulnerabilities with a network attack vector and a relatively high severity rating (7.5), which poses a risk of denial of service (DoS) due to resource exhaustion (CPU). At that time, there was no fix for FragmentSmack in the kernel, and moreover, it was released significantly later than the publication of the vulnerability information. To mitigate SegmentSmack, updating the kernel was recommended. The update package was released on the same day; it just needed to be installed.
No, we are not against updating the kernel at all! However, there are nuances…
How we update the kernel in production
Actually, it's not complicated:
- Download the packages;
- Install them on a number of servers (including the servers hosting our cloud);
- Ensure that nothing has broken;
- Confirm that all default kernel settings have been applied without errors;
- Wait a few days;
- Check the performance metrics of the servers;
- Switch the deployment of new servers to the new kernel;
- Update all servers across data centers (one data center at a time to minimize impact on users in case of issues);
- Reboot all servers.
Repeat for all branches of the kernels we have. Currently, they are:
- Stock CentOS 7 3.10 — for the majority of regular servers;
- Vanilla 4.19 — for our , because we need BFQ, BBR, etc.;
- Elrepo kernel-ml 5.2 — for , because 4.19 behaved unstably earlier, but we need the same features.
As you might guess, the most time-consuming task is rebooting thousands of servers. Since not all vulnerabilities are critical for all servers, we only reboot those that are directly accessible from the internet. In the cloud, to maintain flexibility, we do not bind externally accessible containers to individual servers with a new kernel, but reboot all hosts without exception. Fortunately, this process is simpler there than with traditional servers. For example, stateless containers can simply move to another server during the reboot.
Nonetheless, the work is still extensive, and it can take several weeks, or even months if there are any issues with the new version. Malicious actors are well aware of this, so a 'Plan B' is necessary.
FragmentSmack/SegmentSmack. Workaround
Fortunately, for some vulnerabilities, such a 'Plan B' exists, and it is called Workaround. More often than not, this involves changing kernel/application settings that allow for minimizing the potential impact or entirely eliminating the exploitation of vulnerabilities.
In the case of FragmentSmack/SegmentSmack You can change the default values of 4MB and 3MB in net.ipv4.ipfrag_high_thresh and net.ipv4.ipfrag_low_thresh (and their equivalents for ipv6 net.ipv6.ipfrag_high_thresh and net.ipv6.ipfrag_low_thresh) to 256 kB and 192 kB respectively or lower. Tests show a small to significant drop in CPU usage during an attack depending on the hardware, settings, and conditions. However, there may be some performance impact due to ipfrag_high_thresh=262144 bytes, as only two 64K fragments can fit in the reassembly queue at a time. For example, there is a risk that applications handling large UDP packets may break.
«The parameters themselves».
are described in the kernel documentation We do not have production services for large UDP traffic. There is no fragmented traffic in LAN, but there is some in WAN, though not significant. Nothing foreshadows — we can apply the Workaround!
ipfrag_high_thresh - LONG INTEGER
     Maximum memory used to reassemble IP fragments.
ipfrag_low_thresh - LONG INTEGER
     Maximum memory utilized to reassemble IP fragments before the kernel
     starts to eliminate incomplete fragment queues to free up resources.
     The kernel continues to accept new fragments for defragmentation.
FragmentSmack/SegmentSmack. The first blood
FragmentSmack/SegmentSmack. First blood
The first problem we encountered was that the cloud containers sometimes applied new settings only partially (only ipfrag_low_thresh) and sometimes did not apply them at all — they simply crashed on startup. We could not reproduce the problem consistently (all settings applied without any issues when done manually). Understanding why the container crashes on startup is also not straightforward: no errors were detected. One thing was known for sure: rolling back the settings resolves the issue with container crashes.
Why is it not enough to apply Sysctl on the host? The container operates in its own isolated network namespace, so at least within the container may differ from the host.
How are Sysctl settings applied in the container? Since our containers are unprivileged, it is not possible to change any Sysctl settings from within the container — permissions are insufficient. At that time, our cloud used Docker to run containers (now it is already ). Parameters for the new container, including the required Sysctl settings, were passed to Docker via the API.
During the version testing, it became clear that the Docker API did not return all errors (at least in version 1.10). When attempting to start a container with 'docker run', we finally saw something:
write /proc/sys/net/ipv4/ipfrag_high_thresh: invalid argument docker: Error response from daemon: Cannot start container : [9] System error: could not synchronise with container process.
The parameter value is invalid. But why? And why is it only sometimes invalid? It turned out that Docker does not guarantee the order of applying Sysctl parameters (the last checked version is 1.13.1), which is why sometimes ipfrag_high_thresh attempted to set to 256K when ipfrag_low_thresh was still 3M, meaning the upper limit was lower than the lower one, leading to the error.
At that point, we already had our mechanism for reconfiguring the container post-start (freezing the container via and executing commands in the container's namespace via ), and we added the specification of Sysctl parameters to this part as well. The problem was resolved.
FragmentSmack/SegmentSmack. The First Blood 2
Just as we were figuring out how to apply the Workaround in the cloud, we began receiving the first rare complaints from users. By that time, several weeks had passed since the Workaround was implemented on the initial servers. An initial investigation revealed that the complaints were related to specific services and not all servers hosting those services. The problem once again became highly ambiguous.
First and foremost, we naturally attempted to revert the Sysctl settings, but this had no effect. Various manipulations with the server and application settings were also unhelpful. A reboot did the trick. Rebooting for Linux is as unnatural as it was a normal condition for working with Windows in the past. Nevertheless, it worked, and we attributed everything to a 'glitch in the kernel' when applying the new settings in Sysctl. How naïve that seemed…
Three weeks later, the problem reoccurred. The configuration of these servers was quite simple: Nginx in proxy/load balancer mode. The traffic was minimal. A new input: the number of 504 errors on clients is increasing day by day (). The graph shows the number of 504 errors per day for this service:
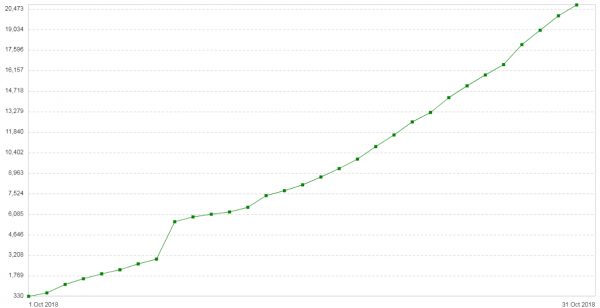
All errors pertain to the same backend — the one located in the cloud. The memory consumption graph related to packet fragments on this backend looked as follows:
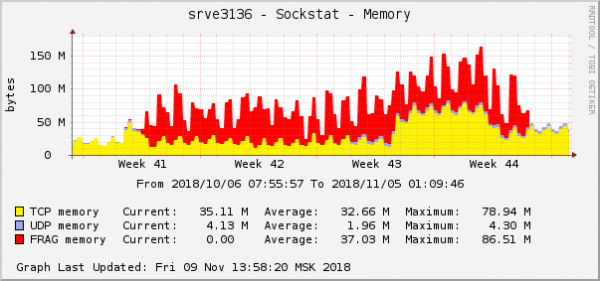
This is one of the most vivid manifestations of the problem on the operating system graphs. Around the same time, another network issue regarding QoS settings (Traffic Control) was fixed in the cloud. The memory consumption graph related to packet fragments looked exactly the same:
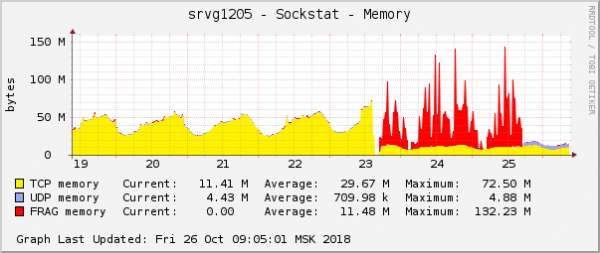
The assumption was simple: if they look the same on the graphs, their cause must also be the same. Moreover, issues with this type of memory occur extremely rarely.
The essence of the fixed problem was that we were using the fq packet scheduler in QoS with default settings. By default, it allows 100 packets to be queued for a single connection, and in situations where bandwidth is insufficient, some connections were filling the queue to capacity. In this case, packets are dropped. This can be seen in the tc statistics (tc -s qdisc) as follows:
qdisc fq 2c6c: parent 1:2c6c limit 10000p flow_limit 100p buckets 1024 orphan_mask 1023 quantum 3028 initial_quantum 15140 refill_delay 40.0ms
  Sent 454701676345 bytes 491683359 pkt (dropped 464545, overlimits 0 requeues 0)
  backlog 0b 0p requeues 0
   1024 flows (1021 inactive, 0 throttled)
   0 gc, 0 highprio, 0 throttled, 464545 flows_plimit
"464545 flows_plimit" refers to the packets dropped due to exceeding the queue limit of a single connection, while "dropped 464545" is the total of all packets dropped by this scheduler. After increasing the queue length to 1,000 and restarting the containers, the issue no longer appeared. You can lean back in your chair and enjoy a smoothie.
FragmentSmack/SegmentSmack. The last blood
First of all, several months after the announcement of vulnerabilities in the kernel, a fix for FragmentSmack finally appeared (reminding you that with the announcement in August, a fix was released only for SegmentSmack), which allowed us to abandon the workaround that caused quite a bit of trouble. During this time, we had already managed to migrate some servers to the new kernel, and now we had to start over. Why did we update the kernel without waiting for the FragmentSmack fix? The thing is, the process of protecting against these vulnerabilities coincided (and merged) with the process of updating CentOS itself (which takes even longer than just updating the kernel). Also, SegmentSmack is a more dangerous vulnerability, and its fix appeared right away, so there was a reason in any case. However, we could not simply update the kernel on CentOS because the FragmentSmack vulnerability, which emerged during the CentOS 7.5 period, was only fixed in version 7.6, so we had to stop the update to 7.5 and restart everything with the update to 7.6. It happens.
Secondly, we received rare user complaints about issues. Now we know for sure that all of them are related to client file uploads on some of our servers. Moreover, through these servers, there was a very small number of uploads compared to the total.
As we recall from the previous account, rolling back Sysctl did not help. Rebooting helped, but only temporarily.
Suspicions about Sysctl were not lifted, but this time we needed to gather as much information as possible. Additionally, we severely lacked the ability to reproduce the upload issue on the client side to study more specifically what was happening.
Analyzing all available statistics and logs did not bring us closer to understanding what was happening. We severely lacked the ability to reproduce the issue in order to 'grasp' the specific connection. Finally, developers managed to achieve stable reproduction of the problems on a test device when connecting via Wi-Fi on a special version of the application. This was a breakthrough in the investigation. The client connected to Nginx, which proxied to the backend that was our Java application.
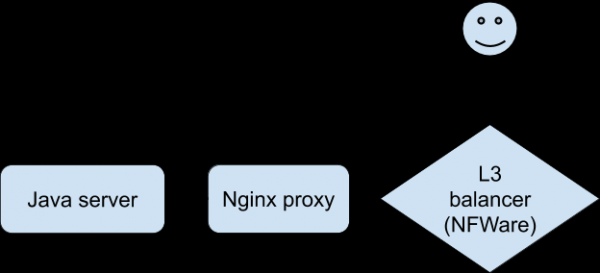
The dialogue during the issues was as follows (recorded on the Nginx proxy side):
- Client: request for information on file download.
- Java server: response.
- Client: POST with file.
- Java server: error.
The Java server logs that it received 0 bytes of data from the client, while the Nginx proxy logs that the request took more than 30 seconds (30 seconds is the timeout for the client application). Why the timeout and why 0 bytes? From an HTTP perspective, everything is working as it should, but the POST with the file seems to vanish from the network. Moreover, it disappears between the client and Nginx. It’s time to arm ourselves with Tcpdump! But first, we need to understand the network configuration. The Nginx proxy is behind an L3 load balancer. . Tunneling is used to deliver packets from the L3 load balancer to the server, which adds its own headers to the packets:
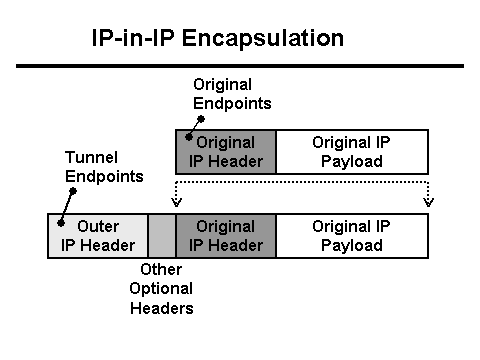
The network to this server arrives as VLAN-tagged traffic, which also adds its fields to the packets:
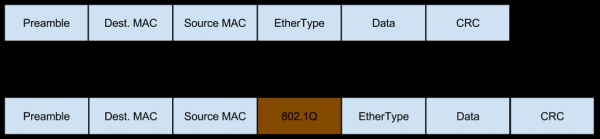
Additionally, this traffic can be fragmented (the small percentage of incoming fragmented traffic we mentioned when assessing the risks from the Workaround), which also changes the contents of the headers:
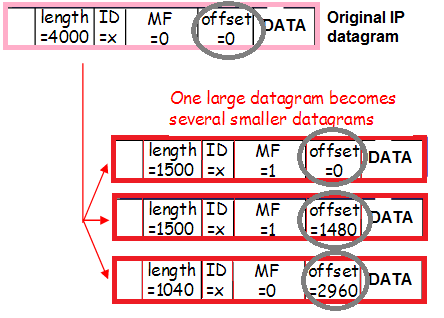
Once again: packets are encapsulated with a VLAN tag, encapsulated in a tunnel, and fragmented. To better understand how this happens, let’s trace the path of a packet from the client to the Nginx proxy.
- The packet hits the L3 load balancer. For correct routing within the data center, the packet is encapsulated in a tunnel and sent to the network card.
- Since the packet + tunnel headers do not fit in the MTU, the packet is split into fragments and sent into the network.
- The switch after the L3 load balancer, upon receiving the packet, adds a VLAN tag to it and sends it further.
- The switch before the Nginx proxy sees (based on port settings) that the server is expecting a VLAN-encapsulated packet, so it sends it as is, without removing the VLAN tag.
- Linux receives fragments of individual packets and stitches them into one large packet.
- Next, the packet goes to the VLAN interface, where the first layer — VLAN encapsulation — is removed.
- Then Linux sends it to the Tunnel interface, where yet another layer — Tunnel encapsulation — is removed.
The difficulty lies in passing all of this as parameters to tcpdump.
Let's start with the end: are there clean (without additional headers) IP packets from clients, with VLAN and Tunnel encapsulation removed?
tcpdump host
No, there were no such packets on the server. Therefore, the problem must lie earlier. Are there packets with only VLAN encapsulation removed?
tcpdump ip[32:4]=0xx390x2xx
0xx390x2xx is the client's IP address in hex format.
32:4 is the address and length of the field where the SCR IP is recorded in the Tunnel packet.
The field address had to be determined through trial and error, as the internet mentions 40, 44, 50, 54, but there was no IP address there. You can also look at one of the packets in hex (using the -xx or -XX parameters in tcpdump) and calculate the address of the known IP.
Are there packet fragments without VLAN and Tunnel encapsulation removed?
tcpdump ((ip[6:2] > 0) and (not ip[6] = 64))
This magic will show us all fragments, including the last one. Probably, it can be filtered by IP as well, but I didn’t try since there aren't many such packets, and I easily found the ones I needed in the general flow. Here they are:
14:02:58.471063 In 00:de:ff:1a:94:11 ethertype IPv4 (0x0800), length 1516: (tos 0x0, ttl 63, id 53652, offset 0, flags [+], proto IPIP (4), length 1500)
     11.11.11.11 > 22.22.22.22: truncated-ip - 20 bytes missing! (tos 0x0, ttl 50, id 57750, offset 0, flags [DF], proto TCP (6), length 1500)
     33.33.33.33.33333 > 44.44.44.44.80: Flags [...], seq 0:1448, ack 1, win 343, options [nop,nop,TS val 11660691 ecr 2998165860], length 1448
         0x0000: 0000 0001 0006 00de fb1a 9441 0000 0800 ...........A....
         0x0010: 4500 05dc d194 2000 3f09 d5fb 0a66 387d E.......?....f8}
         0x0020: 1x67 7899 4500 06xx e198 4000 3206 6xx4 .faEE.....@.2.m.
         0x0030: b291 x9xx x345 2541 83b9 0050 9740 0x04 .......A...P.@..
         0x0040: 6444 4939 8010 0257 8c3c 0000 0101 080x dDI9...W.......
         0x0050: 00b1 ed93 b2b4 6964 xxd8 ffe1 006a 4578 ......ad.....jEx
         0x0060: 6966 0000 4x4d 002a 0500 0008 0004 0100 if..MM.*........
14:02:58.471103 In 00:de:ff:1a:94:11 ethertype IPv4 (0x0800), length 62: (tos 0x0, ttl 63, id 53652, offset 1480, flags [none], proto IPIP (4), length 40)
11.11.11.11 > 22.22.22.22: ip-proto-4
0x0000: 0000 0001 0006 00de fb1a 9441 0000 0800 ...........A....
0x0010: 4500 0028 d194 00b9 3f04 faf6 2x76 385x E..(....?....f8}
0x0020: 1x76 6545 xxxx 1x11 2d2c 0c21 8016 8e43 .faE...D-,.!...C
0x0030: x978 e91d x9b0 d608 0000 0000 0000 7c31 .x............|Q
0x0040: 881d c4b6 0000 0000 0000 0000 0000 ..............
These are two fragments of one packet (the same ID 53652) with a hint (the word Exif is visible in the first packet). Due to the fact that at this level the packets exist, while they do not appear as stitched in the dumps — the problem is clearly with the assembly. Finally, there is documentary evidence for this!
The packet decoder did not reveal any issues preventing assembly. I tried here: Initially, when trying to push something there, the decoder didn't like the packet format. It turned out that there were some extra two octets between Srcmac and Ethertype (not related to the fragment information). After their removal, the decoder started working. However, it didn't show any problems.
No matter how you look at it, apart from those Sysctl settings, nothing else was found. The next step was to find a way to identify the problematic servers to understand the scale and make decisions on further actions. A necessary counter was found quickly:
netstat -s | grep "packet reassembles failed”
It is also present in snmpd under OID=1.3.6.1.2.1.4.31.1.1.16.1 ().
«The number of failures detected by the IP re-assembly algorithm (for whatever reason: timed out, errors, etc.).»
Among the group of servers where the issue was studied, on two, this counter increased rapidly, on two it increased slowly, and on two it didn't increase at all. Comparing the dynamics of this counter with the dynamics of HTTP errors on the Java server revealed a correlation. Therefore, the counter could be set for monitoring.
Having a reliable indicator of problems is crucial to accurately determine whether rolling back Sysctl helps, as from the previous account we know that this cannot be immediately understood through the application. This indicator would allow identifying all problematic areas in production before users notice them.
After rolling back Sysctl, the monitoring errors stopped, thus confirming the cause of the problems, as well as that the rollback helps.
We rolled back the fragmentation settings on other servers where new monitoring was triggered, and on some, we even allocated more memory for fragments than was previously done by default (this was udp statistics, the partial loss of which was not noticeable against the overall background).
The most important questions
Why are packets being fragmented on our L3 load balancer? Most of the packets arriving from users to the load balancers are SYN and ACK. The sizes of these packets are small. However, since the share of such packets is very high, we didn't notice the presence of larger packets that started to be fragmented.
The cause was a broken configuration script On servers with VLAN interfaces (there were very few servers with tagged traffic in production at that time). Advmss allows relaying the information to the client that the packets inbound must be smaller in size so that after the tunnel headers are attached, they do not need to be fragmented.
Why did rolling back Sysctl not help, while rebooting did? Rolling back Sysctl changed the amount of memory available for packet reassembly. However, apparently, the very fact that memory for fragments was overflowing caused connection slowdowns, leading to fragments being delayed in the queue for a long time. In other words, the process became cyclic.
Rebooting reset the memory, and everything returned to normal.
Could the workaround have been avoided? Yes, but there is a significant risk of leaving users without service in the event of an attack. Of course, applying the workaround ultimately led to various issues, including slowdowns of one of the services for users, but nevertheless we believe the actions were justified.
Huge thanks to Andrey Timofeyev () for assisting in the investigation, and to Alexey Krenev () — for the titanic work on updating Centos and kernels on the servers. A process that had to be started from scratch several times in this case, causing it to stretch over many months.
Source: habr.com
