


Hello, colleagues! Today, I would like to discuss a very relevant topic for many Check Point administrators: "Optimization of CPU and RAM". It is not uncommon for the gateway and/or management server to unexpectedly consume a lot of these resources, and I would like to understand where they are "leaking" and how to use them more effectively.
1. Analysis
For analyzing CPU load, the following commands are useful, which are entered in expert mode:
top shows all processes, the amount of CPU and RAM resources consumed in percentages, uptime, process priority, and in real time.and
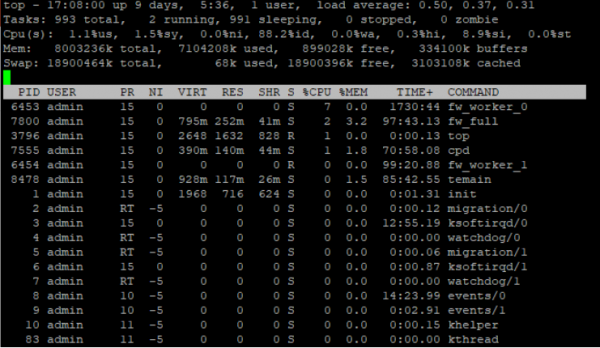
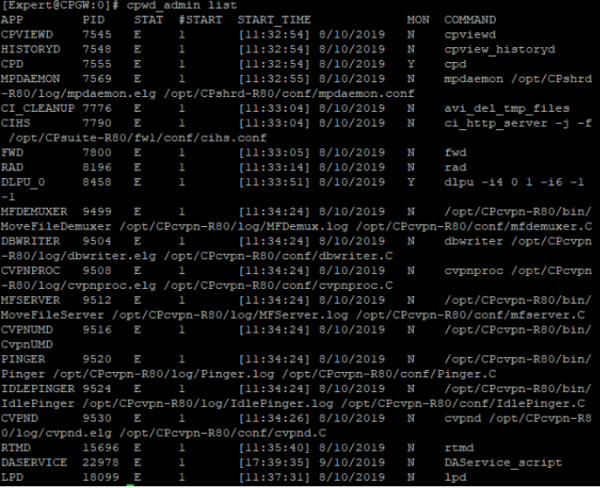
cpwd_admin list Check Point WatchDog Daemon, which displays all appliance modules, their PID, status, and the number of launches.
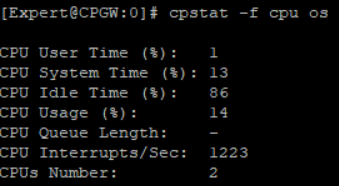
cpstat -f cpu os CPU usage, their count, and the distribution of processor time in percentages.
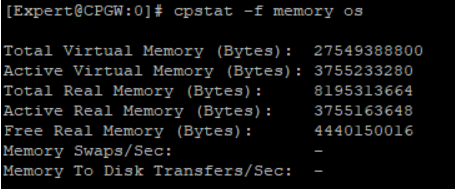
cpstat -f memory os usage of virtual RAM, how much total active, free RAM, and more.
It is correct to note that all cpstat commands can be viewed using the utility cpview.To do this, simply enter the cpview command from any mode in the SSH session.
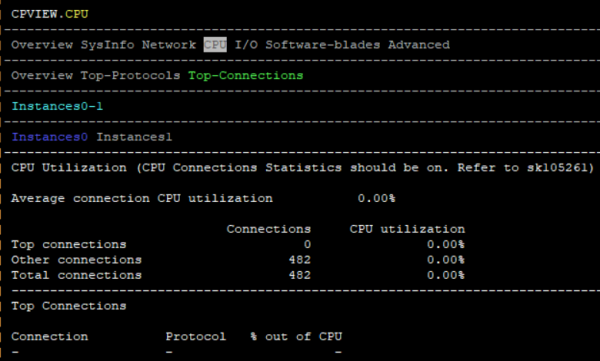
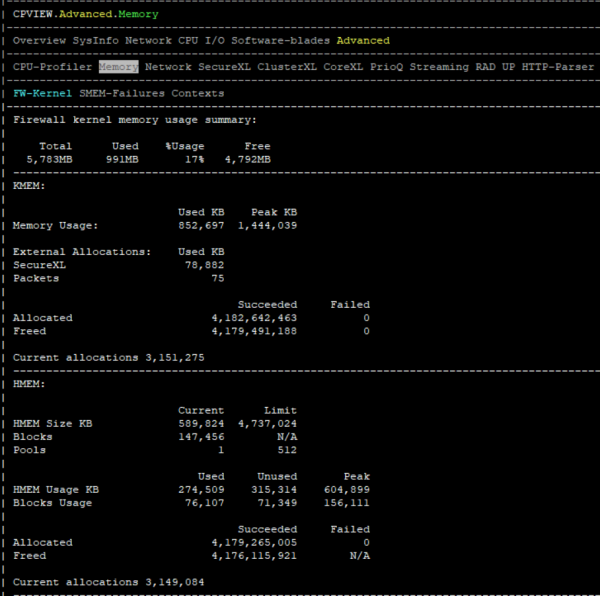
ps auxwf a long list of all processes, their IDs, the virtual memory occupied, and memory in RAM, CPU.
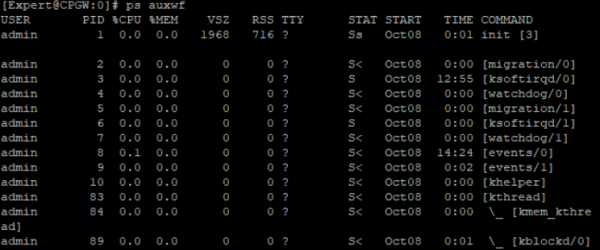
Another variation of the command:
ps -aF will show the most resource-intensive process.

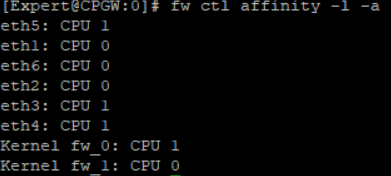
fw ctl affinity -l -a distributing cores for different instances of the firewall, i.e., CoreXL technology.
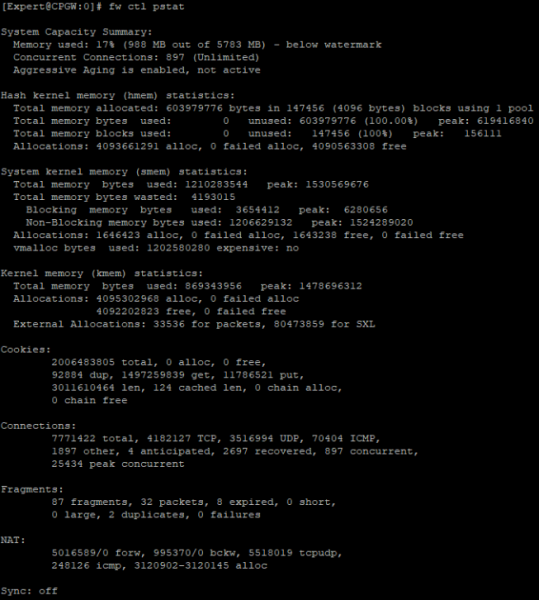
fw ctl pstat analyzing RAM and general connection statistics, cookies, NAT.
free -m RAM buffer.

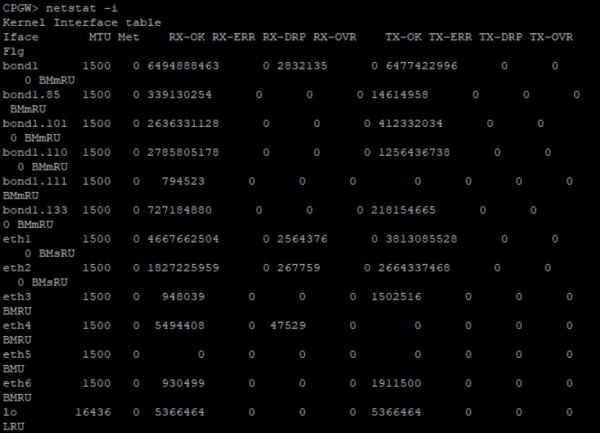
The command deserves special attention netstat and its variations. For example, netstat -i can help solve the monitoring buffer issue. The parameter, RX dropped packets (RX-DRP) in the output of this command usually increases by itself due to drops of illegitimate protocols (IPv6, Bad / Unintended VLAN tags, and others). However, if drops occur for another reason, it is worth using this , to start an investigation and understand why this network interface is dropping packets. Once the reason is identified, the operation of the appliance can also be optimized.
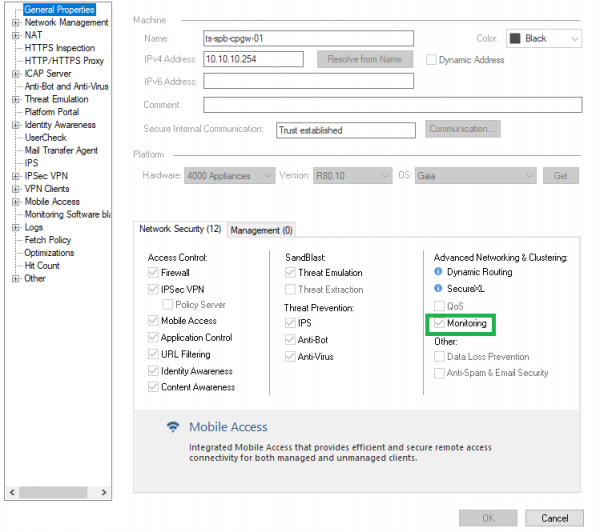
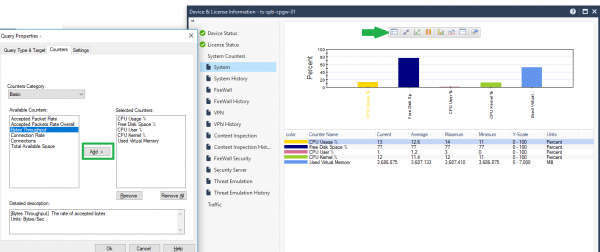
If the Monitoring blade is enabled, you can view these indicators graphically in SmartConsole by clicking on the object and selecting the "Device & License Information" option.
It is not recommended to keep the Monitoring blade enabled permanently, but it can certainly be turned on for a day for testing purposes.
Moreover, it is possible to add more parameters for monitoring, one of which is very useful — Bytes Throughput (appliance throughput).
If there is any other monitoring system, for example, free , based on SNMP, it will also be suitable for identifying these issues.
2. RAM 'leak' over time
The question often arises that over time the gateway or management server starts to consume more and more RAM. I want to reassure you: this is a normal situation for Linux-like systems.
By looking at the output of commands free -m and cpstat -f memory os in the appliance’s expert mode, you can count and view all parameters related to RAM.
Currently available memory on the gateway Free Memory + Buffers Memory + Cached Memory = +-1.5 GB, as a rule.
As the SR says, over time the gateway/management server optimizes and uses more memory, reaching about 80% usage, and then halting. You can reboot the device, and then the indicator will reset. 1.5 GB of free RAM is definitely enough for the gateway to perform all tasks, and management rarely reaches such threshold values.
Also, the outputs of the mentioned commands will show how much you have Low memory (RAM in user space) and High memory (RAM in kernel space) used.
Kernel processes (including active modules, such as Check Point kernel modules) use only Low memory. However, user processes can use both Low and High memory. Moreover, Low memory is approximately equal to Total Memory.
You should only be concerned if logs show errors ‘modules reboot or processes being killed to reclaim memory due to OOM (Out of memory)’. In that case, you should restart the gateway and contact support if the reboot does not help.
A complete description can be found in and .
3. Optimization
Below are the questions and answers regarding CPU and RAM optimization. It's important to answer them honestly and heed the recommendations.
3.1. Was the appliance selected correctly? Was there a pilot project?
Despite proper sizing, the network could simply have grown, and this equipment just can't handle the load. The second option is that there was no sizing at all.
3.2. Is HTTPS inspection enabled? If so, is the technology configured according to Best Practices?
Refer to , if you are our client, or to .
The order of rules in the HTTPS inspection policy plays a significant role in optimizing the opening of HTTPS sites.
Recommended order of rules:
- Bypass rules with categories/URLs
- Inspect rules with categories/URLs
- Inspect rules for all other categories
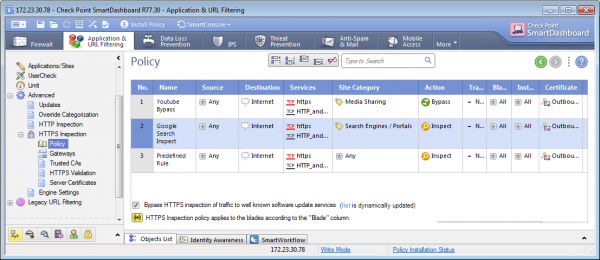
Similar to firewall policy, Check Point checks packet matches from top to bottom, so bypass rules are better placed at the top, as the gateway will not waste resources going through all rules if the packet needs to be skipped.
Are address-range objects used?
Address range objects, such as the network 192.168.0.0-192.168.5.0, consume significantly more RAM than 5 network objects. Overall, it is considered good practice to delete unused objects in SmartConsole, as each time policy is enforced, the gateway and management server spend resources and, most importantly, time verifying and applying the policy.
How is the Threat Prevention policy configured?
First and foremost, Check Point recommends separating IPS into its own profile and creating separate rules for that blade.
For instance, the administrator believes the DMZ segment should be protected solely by IPS. Therefore, to prevent the gateway from using resources to process packets with other blades, a rule needs to be created specifically for that segment with a profile that only includes IPS.
Regarding profile settings, it is recommended to configure it according to best practices in this (pages 17-20).
How many signatures are in Detect mode in IPS settings?
It is recommended to work thoroughly on signatures in the sense that unused ones should be disabled (for example, signatures exploiting Adobe products require a lot of computational power, and if the client does not have such products, it makes sense to disable these signatures). Furthermore, set Prevent instead of Detect where possible, because the gateway uses resources to process the entire connection in Detect mode; in Prevent mode, it immediately drops the connection and does not spend resources on full packet processing.
Which files are processed by the Threat Emulation, Threat Extraction, and Anti-Virus blades?
It makes no sense to emulate and analyze file extensions that your users do not download, or that you consider unnecessary in your network (for example, bat and exe files can easily be blocked using the Content Awareness blade at the firewall level, thereby reducing gateway resource expenditure). Moreover, in the Threat Emulation settings, you can choose the Environment (operating system) for emulating threats in the sandbox, so setting Environment to Windows 7 when all users are on version 10 is also pointless.
3.7. Are firewall rules and Application level rules located according to best practices?
If a rule has many hits (matches), it is recommended to place it at the top, while rules with few hits should be at the bottom. The main thing is to ensure they do not overlap or conflict with each other. The recommended architecture for firewall policy is:
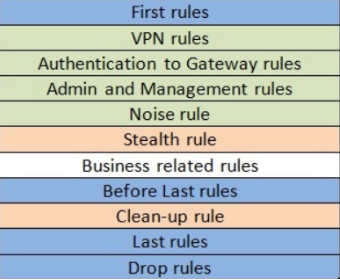
Explanations:
First Rules — this is where the rules with the highest number of matches are placed
Noise Rule — a rule for discarding parasitic traffic, such as NetBIOS
Stealth Rule — prohibits access to gateways and management by everyone except those sources specified in the Authentication to Gateway Rules
Clean-Up, Last, and Drop Rules are generally combined into a single rule to deny everything that has not been previously allowed
The best practice data is described in .
3.8. What settings are in place for services created by administrators?
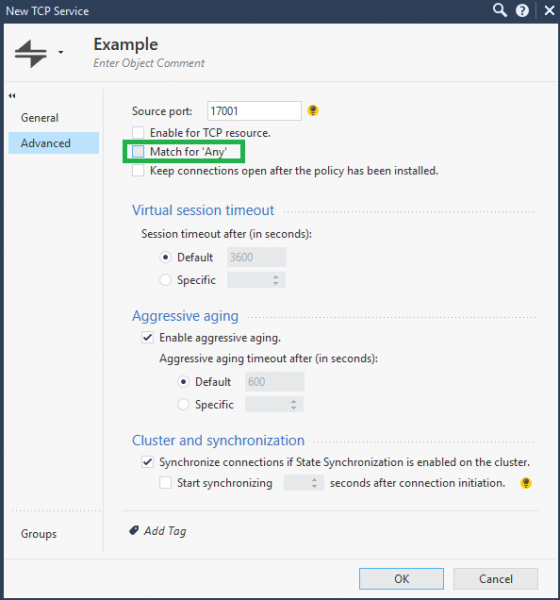
For example, if a TCP service is created on a specific port, it makes sense in the Advanced service settings to uncheck the 'Match for Any' option. In this case, the service will specifically apply to the rule in which it is mentioned and will not participate in rules where 'Any' is listed in the Services column.
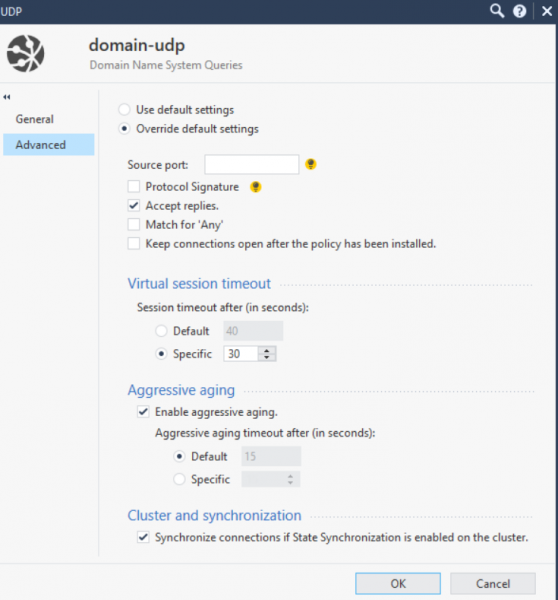
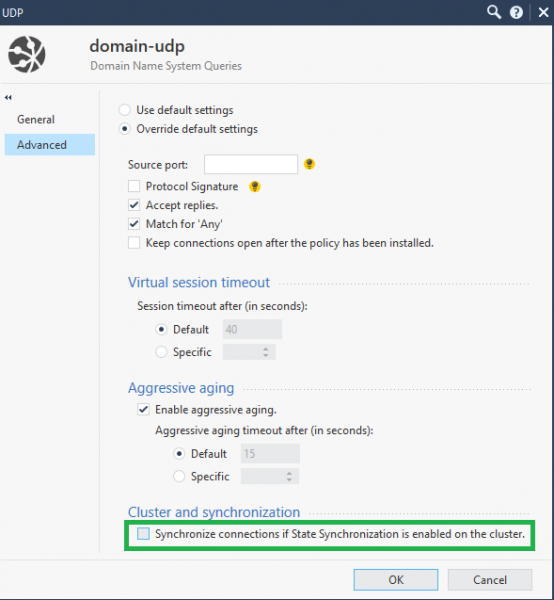
Speaking of services, it’s important to mention that sometimes it is necessary to fine-tune timeouts. This setting will allow for better gateway resource management by not maintaining unnecessary TCP/UDP session timeouts for protocols that do not require a long timeout. For instance, in the screenshot below, I adjusted the timeout for the domain-udp service from 40 seconds to 30 seconds.
3.9. Is SecureXL being used, and what is the percentage of acceleration?
The quality of SecureXL operation can be checked using basic commands in expert mode on the gateway. fwaccel stat and fw accel stats -s. Next, it is necessary to investigate what type of traffic is being accelerated and what additional templates can be created.
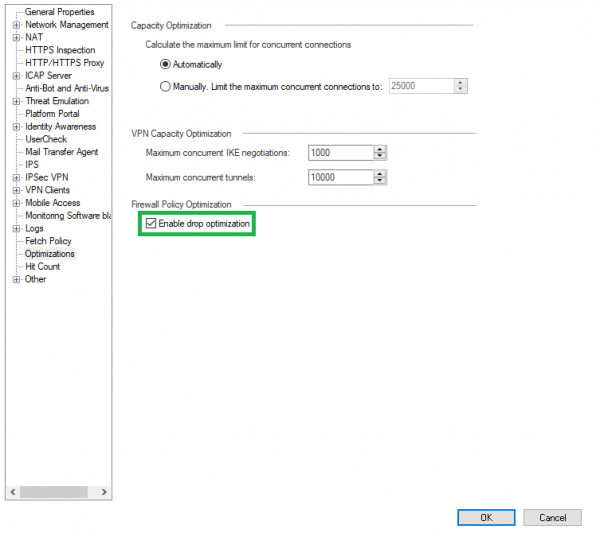
By default, Drop Templates are not enabled; enabling them will positively impact SecureXL performance. To do this, go to the gateway settings and to the Optimizations tab:
Also, when working with a cluster, to optimize CPU, you can disable the synchronization of non-critical services such as UDP DNS, ICMP, and others. To do this, go to the service settings → Advanced → Synchronize connections of State Synchronization is enabled on the cluster.
All Best Practices are described in .
3.10. How is CoreXL used?
The CoreXL technology, which allows the use of multiple CPUs for firewall instances (firewall modules), undoubtedly helps optimize device performance. First, the command fw ctl affinity -l -a will show the used firewall instances and the processors allocated for necessary SND (module that distributes traffic to firewall entities). If not all processors are utilized, they can be added with the command cpconfig on the gateway.
Another good practice is to install a to enable Multi-Queue. Multi-Queue solves the issue where the processor with SND is utilized at a high percentage while firewall instances on other processors are idle. This would allow SND to create multiple queues for a single NIC and assign different priorities for different traffic at the kernel level. Consequently, CPU cores would be used more efficiently. The methods are also described in .
In conclusion, it should be noted that these are not all Best Practices for optimizing Check Point performance, but the most popular ones. If you would like to order an audit of your security policy or address an issue related to Check Point, please contact sales@tssolution.ru.
Thank you for your attention!
Source: habr.com
