

Hello! My name is Vadim Madison, and I lead the development of System Platform at Avito. It has been mentioned several times how we are transitioning from a monolithic architecture to microservices. It's time to share how we transformed our infrastructure to maximize the benefits of microservices without getting lost in them. Learn how PaaS assists us here, how we simplified deployment, and reduced the creation of a microservice to just one click — read on. Not everything I discuss below has been fully implemented at Avito; some aspects reflect how we are developing our platform.
(And at the end of this article, I will share the opportunity to attend a three-day seminar by microservices architecture expert Chris Richardson).

How We Transitioned to Microservices
Avito is one of the largest classifieds platforms in the world, with over 15 million new listings published daily. Our backend handles more than 20,000 requests per second. We currently have several hundred microservices.
We have been building our microservice architecture for several years. Specifically, our colleagues discuss the details in our session at RIT++ 2017. At CodeFest 2017 (see ), Sergey Orlov and Mikhail Prokoptchuk explained in detail why we needed to transition to microservices and the role Kubernetes played in this process. Now we are doing everything possible to minimize the scaling costs inherent in such architecture.
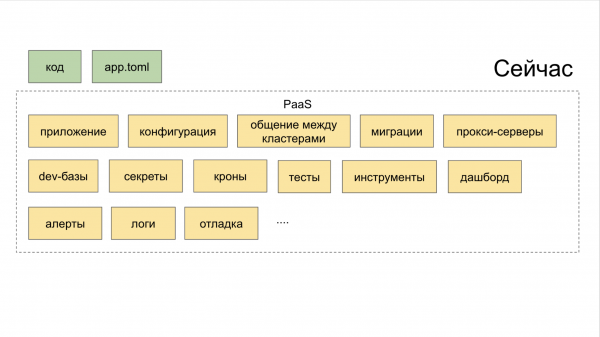
Initially, we did not create an ecosystem that comprehensively assisted us in developing and launching microservices. We simply gathered capable open-source solutions, deployed them, and asked developers to figure them out. As a result, developers frequently found themselves navigating through multiple locations (dashboards, internal services), which reinforced their inclination to code the old way in a monolithic structure. Green in the diagrams below indicates what developers handle manually, while yellow indicates automation.
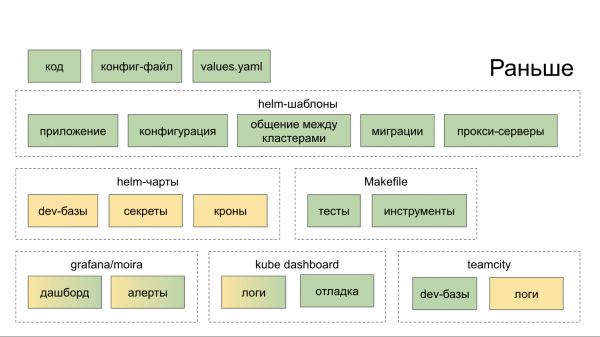
Now, in the PaaS CLI utility, a new service can be created with one command, while two additional commands add a new database and deploy it to Stage.
How to Overcome the Era of 'Microservices Fragmentation'
In a monolithic architecture, developers had to navigate their neighbors' changes for consistency in product updates. In the new architecture, the contexts of services ceased to depend on each other.
Furthermore, for a microservices architecture to be effective, it is necessary to establish numerous processes, namely:
• Logging;
• Request tracing (Jaeger);
• Error aggregation (Sentry);
• Statuses, messages, events from Kubernetes (Event Stream Processing);
• Race limit / circuit breaker (Hystrix can be used);
• Service connectivity control (we use Netramesh);
• Monitoring (Grafana);
• Building (TeamCity);
• Communication and notifications (Slack, email);
• Task tracking (Jira);
• Documentation creation.
To ensure that the system remains consistent and effective as it scales, we rethought the organization of microservices work at Avito.
How we manage microservices
A unified 'party line' among numerous Avito microservices is facilitated by:
- Infrastructure separation into layers;
- The concept of Platform as a Service (PaaS);
- Monitoring everything that happens with microservices.
The levels of infrastructure abstraction include three layers. We will go from top to bottom.
A. The top — service mesh. Initially, we tried Istio, but it turned out to use too many resources, which became excessively costly at our volumes. Therefore, senior engineer Alexander Lukyanchenkov developed a custom solution — (available as Open Source), which we currently use in production and consumes several times fewer resources than Istio (though it doesn't perform everything that Istio can boast).
B. The middle — Kubernetes. We deploy and operate microservices on it.
C. The bottom — bare metal. We do not use clouds or solutions like OpenStack, but are completely on bare metal.
All layers are unified under PaaS. This platform, in turn, consists of three parts.
I. Generators,managed through a CLI utility. This tool helps developers create microservices correctly and with minimal effort.
II. An aggregate collector with control over all tools through a common dashboard.
III. Storage.. It integrates with schedulers that automatically trigger significant actions. Thanks to this system, no task is overlooked simply because someone forgot to set a task in Jira. We use an internal tool called Atlas for this.
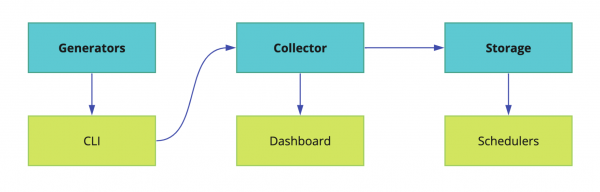
The implementation of microservices at Avito is also carried out according to a unified scheme, simplifying control over them at each stage of development and release.
How a standard microservice development pipeline works
In general terms, the chain for creating a microservice looks as follows:
CLI-push → Continuous Integration → Bake → Deployment → Artificial tests → Canary tests → Squeeze Testing → Production → Maintenance.
Let's go through it in exactly this sequence.
CLI-push
• Creating a microservice.
We struggled for a long time to teach every developer how to create microservices. We even wrote detailed instructions in Confluence. But the schemes changed and were supplemented. The result was a bottleneck at the beginning: launching microservices took much longer than allowed, and problems often arose during their creation.
In the end, we created a simple CLI utility that automates the main steps in creating a microservice. Essentially, it replaces the first git push. Here’s what it specifically does.
— Creates a service based on a template — step-by-step, in a ‘wizard’ mode. We have templates for the main programming languages used in Avito's backend: PHP, Golang, and Python.
— With a single command, it sets up a local development environment on a specific machine — Minikube is started, Helm charts are automatically generated and launched in the local Kubernetes.
— Connects the necessary database. The developer doesn’t need to know the IP, username, and password to access the required database — whether locally, in Stage, or in production. Moreover, the database is deployed immediately in a fault-tolerant configuration with balancing.
— Automatically performs live assembly. Suppose the developer made some changes in the microservice through their IDE. The utility detects changes in the file system and rebuilds the application (for Golang) and restarts it accordingly. For PHP, we simply pass the directory inside the cube, and live-reload happens ‘automatically’.
— Generates automated tests. In the form of templates, but quite usable.
• Deploy the microservice.
Deploying a microservice used to be a bit tedious. It required:
I. Dockerfile.
II. Config.
III. A Helm chart, which is cumbersome on its own and includes:
— the charts themselves;
— templates;
— specific values taking different environments into account.
We eliminated the pain of rewriting Kubernetes manifests, and now they are generated automatically. But most importantly, we simplified the deployment to the utmost. From now on, we have a Dockerfile, and the entire config is specified by the developer in a single short file app.toml.
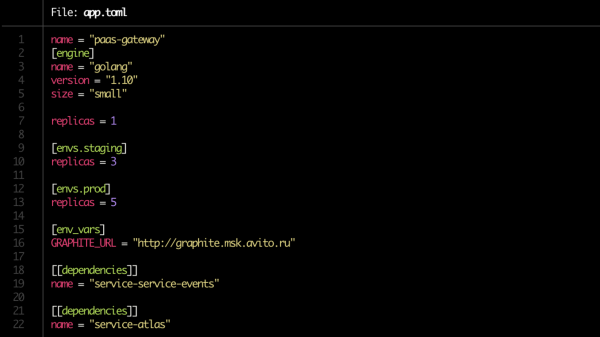
In the app.toml, it now takes just a minute. We specify how many copies of the service to run (on the dev server, on staging, in production) and list its dependencies. Note the line size = "small" in the [engine] block. This is the limit that will be allocated to the service via Kubernetes.
Based on the config, all necessary Helm charts are automatically generated, and connections to databases are created.
• Basic validation. Such checks are also automated.
We need to track:
— is there a Dockerfile;
— is there an app.toml;
— is there documentation;
— are the dependencies in order;
— are alerting rules set.
Regarding the last point: the service owner specifies which product metrics to monitor.
• Preparing documentation.
This remains a problematic area. It seems to be the most obvious, yet remains the most "frequently forgotten," and thus the most vulnerable link in the chain.
Documentation is needed for each microservice. It should include the following blocks.
I. A brief description of the service.. Literally a few sentences about what it does and why it is needed.
II. A link to the architecture diagram.. It is important that a quick glance at it makes it easy to understand, for example, whether you use Redis for caching or as the primary data store in persistent mode. For Avito, this is currently a link to Confluence.
III. Runbook.. A short guide on how to run the service and nuances of working with it.
IV. FAQ, where it would be good to anticipate issues that colleagues might encounter while working with the service.
V. Description of endpoints for the API.If you haven't specified the destinations, your colleagues whose microservices are connected to yours will almost certainly bear the cost. Currently, we use Swagger and our solution called brief for this.
VI. LabelsOr markers that indicate which product, functionality, or structural division of the company the service belongs to. They help quickly understand, for example, whether you are duplicating functionality that your colleagues rolled out for the same business unit a week ago.
VII. Service Owner(s)In most cases, it can be automatically determined using PaaS, but for safety, we require the developer to specify them manually as well.
Finally, a good practice is to conduct documentation reviews, similar to code reviews.
Continuous Integration.
- Preparation of repositories.
- Creating a pipeline in TeamCity.
- Setting permissions.
- Finding service owners. Here, a hybrid scheme is used — manual labeling and minimal automation from PaaS. A fully automated scheme fails when transferring services to support another development team or, for example, if the service developer has resigned.
- Registering the service in Atlas (see above). With all its owners and dependencies.
- Checking migrations. We check for potentially dangerous migrations among them. For example, one might contain an alter table statement or something else that could disrupt data schema compatibility between different versions of the service. In this case, the migration will not be executed and will be put on hold — PaaS should notify the service owner when it is safe to apply it.
Bake
The next stage is packaging services before deployment.
- Building the application. Traditionally — in a Docker image.
- Generating Helm charts for the service itself and related resources. Including for databases and caches. They are created automatically according to the app.toml configuration formed at the CLI-push stage.
- Creating tickets for admins to open ports (when required).
- Running unit tests and calculating code coverage.If the code coverage is below the specified threshold, the service is unlikely to pass the deployment stage. If it is on the verge of being acceptable, the service will receive a 'pessimizing' coefficient: in this case, without improvements in the metric over time, the developer will be notified that there has been no progress on testing (and they should address this).
- Accounting for memory and CPU constraintsWe primarily write microservices in Golang and run them in Kubernetes. This leads to a nuance related to the characteristics of the Golang language: by default, all cores on the machine are engaged during execution unless the GOMAXPROCS variable is explicitly set. When multiple such services are run on one machine, they compete for resources, interfering with each other. The graphs below show how execution time changes when the application is run without competition and in resource race mode. (The source code for the graphs is available ).
Execution time, less is better. Maximum: 643ms, minimum: 42ms. The image is clickable.
Time per operation, less is better. Maximum: 14091 ns, minimum: 151 ns. The image is clickable.
At the build preparation stage, this variable can be explicitly set or the library can be used from the folks at Uber.
Deploy
• Checking conventions. Before deploying service builds to designated environments, the following need to be checked:
— API endpoints.
— Compliance of API endpoint responses with the schema.
— Log format.
— Setting headers when making requests to the service (currently handled by netramesh)
— Setting the owner marker when sending messages to the event bus. This is necessary for tracking the connectivity of services through the bus. The bus can be used to send both idempotent data that do not enhance service connectivity (which is good) and business data that strengthen service connectivity (which is very bad!). When this connectivity becomes a problem, understanding who writes to and reads from the bus helps correctly separate services.
Currently, there are not many conventions at Avito, but their pool is expanding. The more such agreements exist in a format that is clear and convenient for the team, the easier it is to maintain consistency between microservices.
Synthetic tests
• Testing in a closed loop. For this, we are currently using the open-source First, it records the actual load on the service, then, in a closed loop, it emulates it.
• Load testing. We strive to optimize the performance of all services. Every version of each service must undergo load testing — this allows us to understand the current performance and the difference compared to previous versions of the same service. If the performance drops by one and a half times after a service update, it is a clear signal for its owners: they need to delve into the code and fix the situation.
We rely on the collected data, for example, to properly implement auto scaling and, ultimately, to understand how scalable the service is.
During load testing, we check if resource consumption meets the established limits. We focus primarily on the extremes.
a) We look at the overall load.
— If it’s too low — something is likely not working at all if the load suddenly drops several times.
— If it’s too high — optimization is required.
b) We look at the cutoff by RPS.
Here we look at the difference between the current and previous version, as well as the total number. For example, if the service delivers 100 rps — it is either poorly written or it's its nature, but in any case, it's a reason to take a closer look at the service.
If the RPS is too high, then perhaps there's a bug and one of the endpoints has stopped performing its payload and is just triggering some kind of return true;
Canary tests
After synthetic tests are completed, we roll out the microservice's operation to a small number of users. We start cautiously, with a minimal fraction of the expected service audience — less than 0.1%. At this stage, it is very important to have the correct technical and product metrics set up in monitoring, which will show any issues in the service as quickly as possible. The minimum canary test duration is 5 minutes, the main one is 2 hours. For complex services, we set the time manually.
We analyze:
— metrics specific to the language, in particular, php-fpm workers;
— errors in Sentry;
— response statuses;
— response times (response time), both exact and average;
— latency;
— handled and unhandled exceptions;
— product metrics.
Squeeze Testing
Squeeze Testing is also referred to as testing through "squeeze-out". The method was introduced by Netflix. Its essence is that we first fill one instance with real traffic to the point of failure and thus establish its limit. Then, we add another instance and load these two until they reach maximum capacity; we see their ceiling and the delta from the first "squeeze". We continue to connect one instance at a time and calculate the patterns in the changes.
The data from the "squeeze-out" tests also flows into a common metrics database, where we either enrich the results of synthetic load testing with this data or completely replace the "synthetics" with it.
Production
• Scaling. When rolling out a service to production, we monitor how it scales. Monitoring only CPU metrics, in our experience, is ineffective. Auto-scaling with RPS benchmarking works in its pure form, but only for specific services, such as online streaming. Therefore, we look primarily at application-specific product metrics.
As a result, when scaling, we analyze:
— CPU and RAM metrics,
— the number of requests in the queue,
— response time,
— forecasts based on accumulated historical data.
When scaling a service, it is also important to monitor its dependencies, so that we do not end up scaling the first service in the chain while those it depends on crash under the load. To establish an acceptable load for the entire pool of services, we look at the historical data of the "nearest" dependent service (based on CPU and RAM metrics combined with app-specific metrics) and compare them with the historical data of the initializing service, and so forth through the entire "dependency chain", from top to bottom.
Maintenance
After a microservice goes live, we can attach triggers to it.
Here are typical situations in which triggers are activated.
— Potentially dangerous migrations have been detected.
— Security updates have been released.
— The service has not been updated for a long time.
— The load on the service has significantly decreased or any of its product metrics exceed normal limits.
— The service no longer meets the platform's new requirements.
Some triggers are responsible for stability, while others function as system maintenance— for example, if a certain service hasn't been deployed in a while and its base image has failed a security check.
Dashboard
In short, the dashboard is the control panel for our entire PaaS.
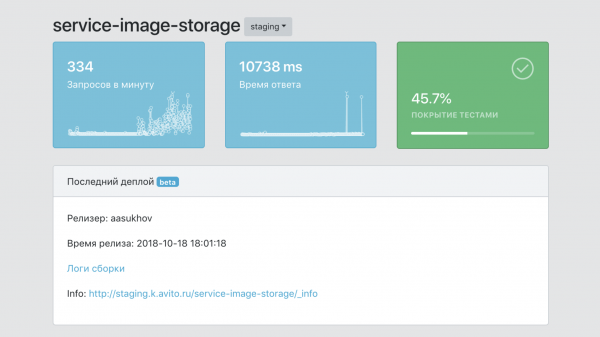
- A single information point about the service, with data on its test coverage, the number of images, production copies, versions, and so on.
- A means of filtering data by services and labels (markers related to business units, product functionality, etc.).
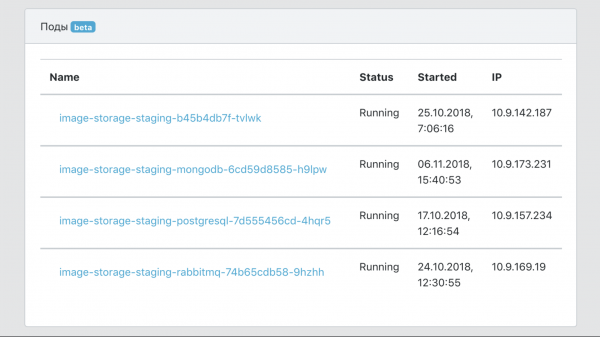
- A tool for integrating with infrastructure tools for tracing, logging, and monitoring.
- A single documentation point for services.
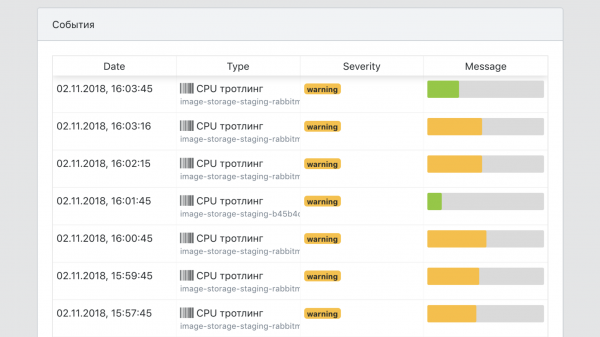
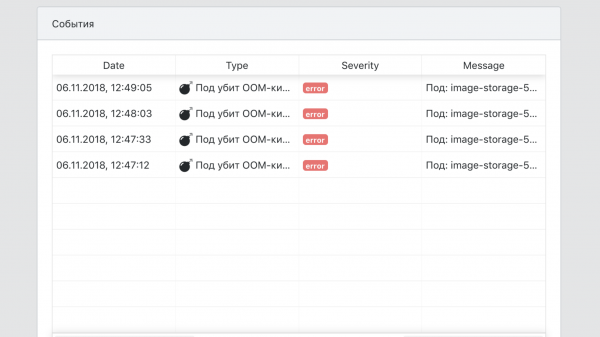
- A single overview point for all service events.
Total
Before the PaaS implementation, a new developer could spend several weeks figuring out all the tools needed to launch a microservice in production: Kubernetes, Helm, our internal aspects of TeamCity, setting up connections to databases and caches in a resilient manner, etc. Now it takes just a couple of hours—to read the quickstart and set up the service.
I made a presentation on this topic at HighLoad++ 2018, you can check it out. and .
A bonus track for those who read to the end.
At Avito, we're organizing an internal three-day training for developers by an expert in microservices architecture. We want to gift the opportunity to participate in it to one of the readers of this post. The training program is available.
The training will take place from August 5 to 7 in Moscow. These are working days that will be fully occupied. Lunch and training will be at our office, and the selected participant will cover their own travel and accommodation.
You can apply to participate . We need a response to the question of why you specifically need to attend the training and your contact information. Please respond in English, as Chris will choose the participant himself.
We will announce the name of the training participant with an update to this post and on Avito's social media for developers (AvitoTech on , , ) no later than July 19.
Source: habr.com
