

In mid-May, Zabbix 5.0 was released, and we organized a series of online meetups in various languages to demonstrate all the changes and innovations to the community. We invite you to check out the presentation by Zabbix's CEO and founder, Alexey Vladyshev, who detailed what’s new in Zabbix 5.0.

Zabbix 4.2 and Zabbix 4.4
Let's start with the changes introduced in Zabbix 4.0, related to the use of LTS versions.
The Zabbix 4.2 version, released in April 2019, introduced the following features:
- High-frequency monitoring through throttling, which provides scalability and increases NVPS, allowing for faster problem detection and alerting without putting a heavy load on Zabbix.
- Data collection using the HTTP agent.
- Support for data collection from Prometheus Pro.
- Preprocessing supports validation and JavaScript, allowing for the transformation of any collected data.
- Proxy-side preprocessing, which provides more efficient scaling via proxies.
- Enhanced tag management — meta-information at the event and issue level, which is easy to work with because tags are supported at both the template and network node levels.
Last September, Zabbix 4.4 was released, offering the following features:
- A new Zabbix agent.
- Support for Webhook for alerts and notifications, enabling integration with external systems.
- Support for TimescaleDB.
- The built-in knowledge base for metrics and triggers has become visible to Zabbix users. For example, users can use the descriptions of data items and triggers in Monitoring > Latest data.
- A new standard for templates.
Zabbix 5.0
Today, we will discuss the LTS release of Zabbix 5.0, which will be supported for 5 years. Support for version 4.4 will end in one month. The LTS release of Zabbix 3.0 will be supported for another 3.5 years.
Zabbix provides monitoring for many things, the list of which can be refined on the page , which features templates for monitoring and plugins, including for the new agent.

Available templates for monitoring and integration
Additionally, there are integration capabilities with various systems, including ticket systems, ITSM solutions, and messaging systems via Webhook.
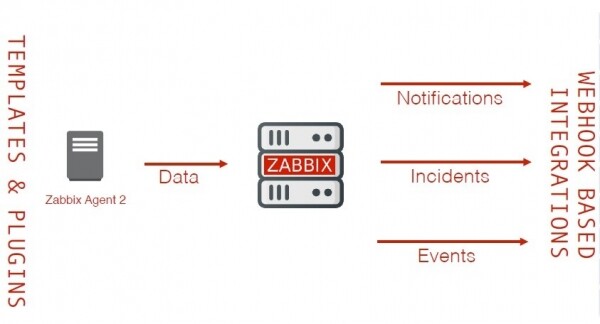
Integration Capabilities
Zabbix 5.0 has expanded built-in support for integration with various ticketing systems, as well as alerting systems:

Integration with Various Systems
The list of built-in templates for monitoring applications and devices has been expanded:
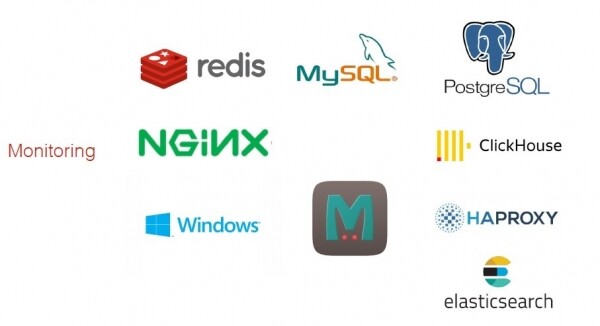
Built-in Templates for Monitoring Applications and Devices
All updates are available for download at .
Any user or developer can participate in Zabbix with ready-made works — templates or plugins, by following a simple procedure:
- Signing the Zabbix Contributory Agreement (ZCA) at .
- Submitting a Pull Request at .
- Reviewing the application by the development team. If the plugin or template meets Zabbix standards, it is included in the product, and the work of such a developer will be officially supported by the Zabbix team.
Zabbix is open-source software, available for viewing, studying, and modifying. Users are given the opportunity to freely use the product, participate in refining the program, or use the code for their new software. On the other hand, the Zabbix team strives to make Zabbix easy to install on various platforms.
Zabbix developers offer packages for almost all of the most popular distributions and various virtualization platforms. Additionally, Zabbix can be installed in the public cloud with just one click. Zabbix is also available on Red Hat Openshift or OpenStack platforms.
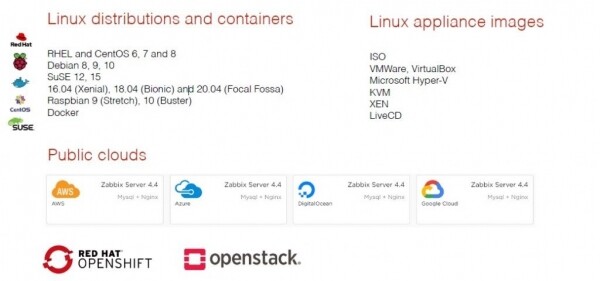
Zabbix Packages for Distributions and Platforms
Support for Zabbix Agent 2 for Windows and Linux
The new Zabbix Agent 2 is one of the best solutions on the market.
- It offers a plugin-based architecture and supports scripts for data collection that can run for hours.
- It supports parallel active checks and persistent connections to external systems, which is useful, for example, for effective database monitoring.
- It supports traps and events, which is important for monitoring, for example, MQTT devices.
- The new version of the agent is easy to install (since the new agent supports all previous functionalities).
Additionally, Zabbix 5.0 introduces support for persistent data storage for the new agent. Previously unsent information was only stored in the agent's memory, but this new version allows for the configuration of data storage on disk.
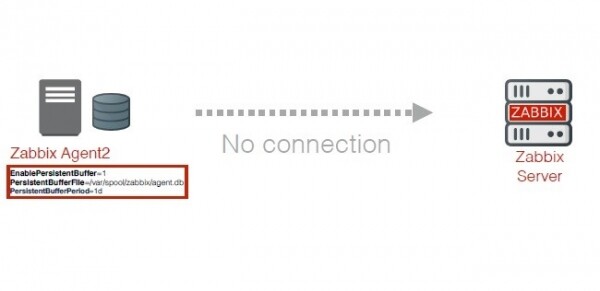
Persistent Data Storage
This is important when monitoring critical systems and unreliable communications, as a large amount of vital data is preserved before being sent to the Zabbix server. This option is also beneficial for satellite connections that may be unavailable for long periods.
IMPORTANT! Zabbix 5.0 retains support for Zabbix Agent 1.
Changes in Security System in Zabbix 5.0
1. The new version supports an HTTP proxy for webhooks, allowing connections from the Zabbix server to external alerting systems in a more secure and manageable manner.
If integration of the Zabbix server within a local network with an external system is necessary, for example, JIRA in the cloud, a connection can be maintained through an HTTP proxy, which enhances manageability and reliability of the connection.
2. For both the old and new agents, it's possible to choose which specific checks should be available on a particular agent. For instance, you can limit the number of checks by effectively creating whitelists and blacklists, determining supported keys.
- Whitelist for MySQL related checks
AllowKey=mysql[*] DenyKey=* - Blacklist to deny all shell scripts
DenyKey=system.run[*] - Blacklist to deny access to /etc/password
DenyKey=vfs.file.contents[/etc/passwd,*]
3. It's possible to choose encryption algorithms for all Zabbix components to avoid using unsafe ciphers for TLS connections. This is crucial for monitoring environments that adhere to certain security standards.
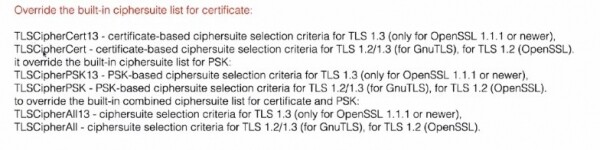
Choosing encryption algorithms for TLS connections
4. Zabbix 5.0 has introduced support for encrypted connections to databases. Currently, only encrypted connections to PostgreSQL and MySQL are available.
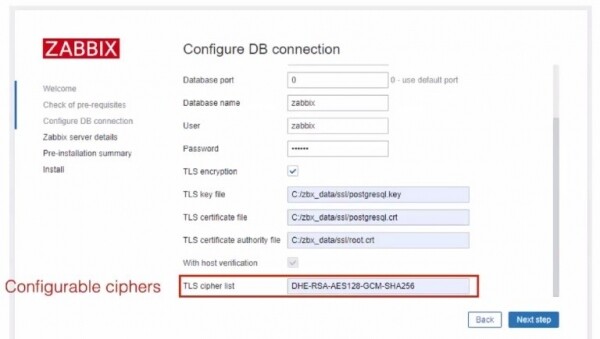
Encrypted connections to databases
5. Zabbix 5.0 has transitioned from MD5 to SHA256 for storing user password hashes in the database since this is the most secure algorithm available at present.
6. Zabbix 5.0 supports secret user macros for storing any sensitive information, such as passwords and API tokens, that are not accessible to end users.
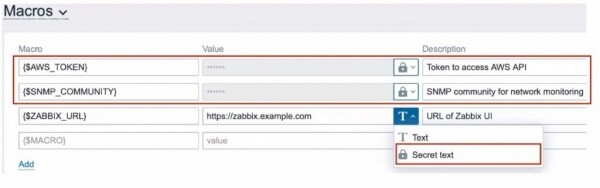
Secret macros
7. All Zabbix connections to external systems and internal connections to agents are secure. Encryption is supported using TLS certificates or pre-shared key encryption for connections to agents and proxies, or via HTTPS. Agent-side security can be enhanced using whitelists and blacklists. The interface operates over HTTPS.
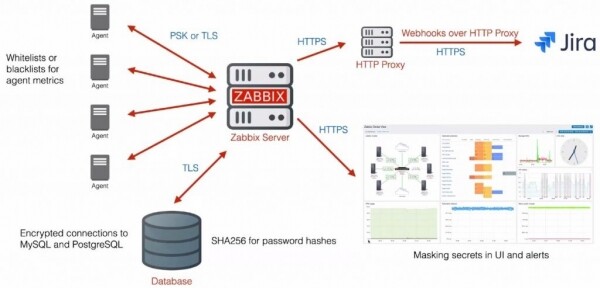
Secure connections
8. SAML support for single sign-on with a trusted identity provider, ensuring that user credentials do not leave the firewall boundaries.
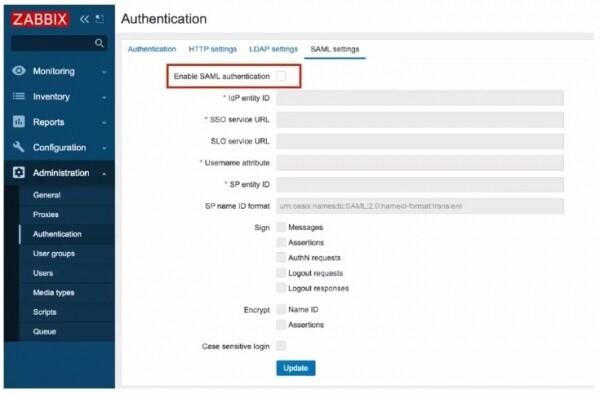
SAML authentication
SAML support allows integrating Zabbix with various on-premises and cloud-based identity providers, such as Microsoft ADFS, OpenAM, SecurAuth, Okta, Auth0, as well as Azure, AWS, or Google Cloud Platform.
Usability of Zabbix 5.0
1. User interface optimized for widescreens. We moved the menu from the top, where there is always a space issue, to the left side of the screen. The menu remains available in full, minimal, and hidden modes.
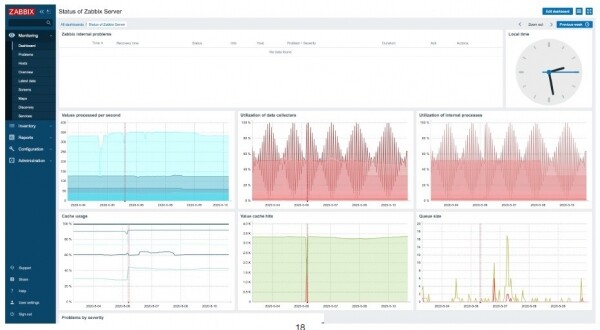
Interface optimized for widescreen
2. Copying widgets from panels allows for very quick creation of new PANELS. To do this, you need to select the desired widget in the PANEL, press Copy
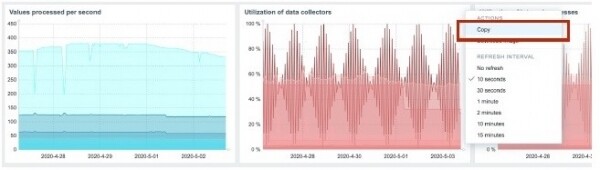
Copying a widget
and paste the widget into the desired panel.
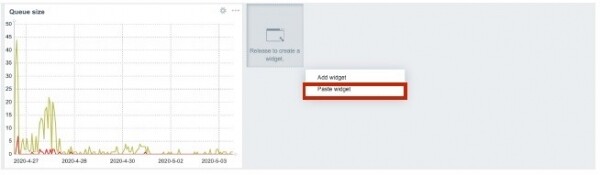
Pasting the copied widget
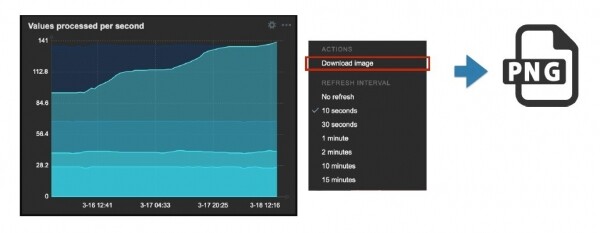
3. Exporting graphs. To copy a graph and send it, for example, via email, you can obtain the graph in PNG format by selecting the desired widget and clicking Download image.
Exporting graphs
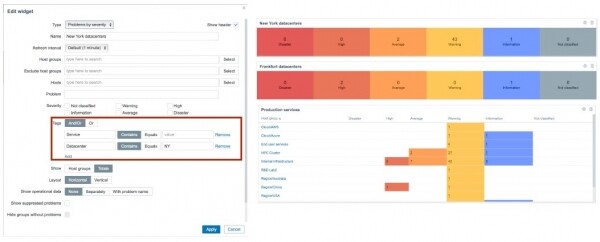
4. Filtering by tags: Problem by severity and Problem hosts. It has become possible, for example, to gather data on all issues related to a single network node within one data center.
Filtering by tags
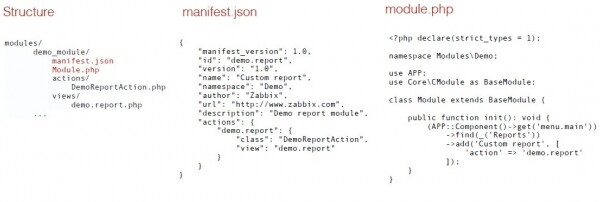
5. Support for modules to extend the Zabbix interface. To install an independent module, it needs to be copied to a specific directory. Modules allow for expanding existing interface functionality, creating new pages, and changing menu structure, for example, by adding items.
Any user can write and integrate a module. To do this, the module is copied to the modules folder, after which it becomes visible in the interface, where it can be enabled and disabled.
Adding a new module
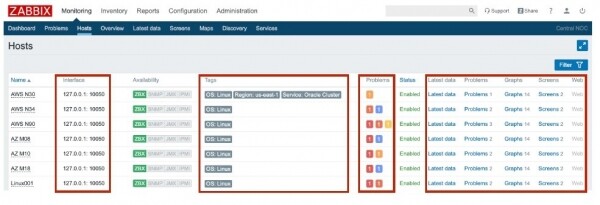
6. Ease of navigation through resources related to network nodes. In Monitoring > Hosts A list of devices monitored by Zabbix is displayed: network nodes, services, network devices, etc. Additionally, quick navigation to screens, graphs, and issues for specific devices is available.
We removed the tabs Monitoring > Graphs and Monitoring > Webs, and all navigation is done through Monitoring > Hosts. The displayed information can be filtered, including by tags, allowing the display of disabled devices
Navigation through resources related to network nodes
For example, you can select devices related to end-user services by choosing ‘Service’, as well as by specifying the severity level of these issues.
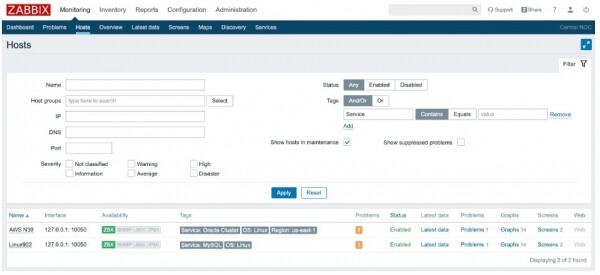
Filtering capabilities
7. New preprocessing operation — ‘Replace‘ allows performing several useful tasks that previously could only be done using regular expressions, which are quite complex for many users.
Replace allows actually replacing one string or character with others, enabling simple conversion of data obtained in text format to a numerical representation.
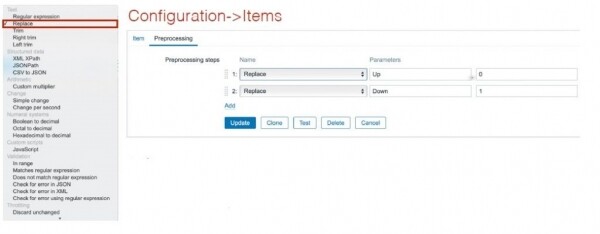
The Replace operator
8. The JSONPath operator, which allows extracting attribute names in a convenient form
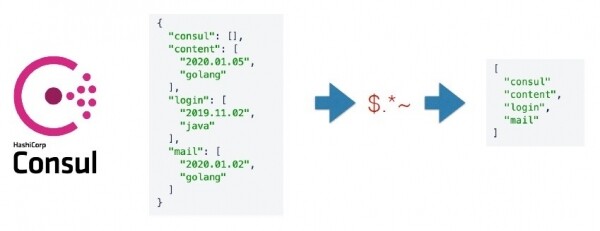
Operator for JSONPath
9. Display of Zabbix email messages. In previous versions, all email messages from Zabbix in the folder Incoming were displayed in a list. Starting with Zabbix 5.0, messages will be grouped by issues.

Grouping of Zabbix email messages
10. Support for custom macros for IPMI for username and password. If secret macros are used for username and password, access to their value will be restricted.
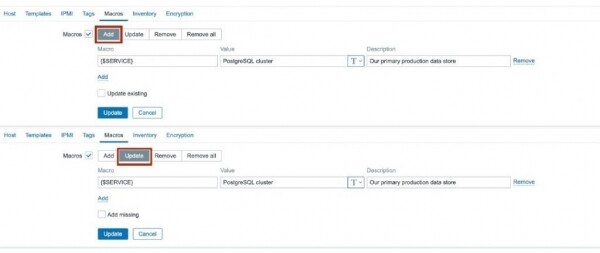
Support for custom macros
11. Bulk modification of custom macros for network nodes. In the new version, you can open the template list, select the list of network nodes, and add macros or change the values of existing macros,
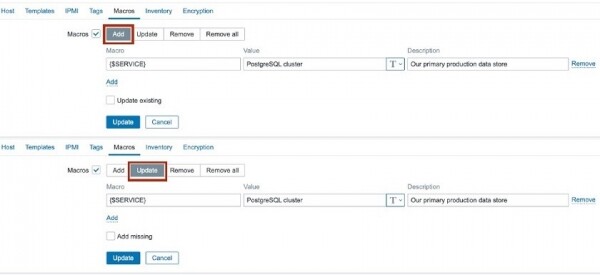
Adding and modifying custom macros
and also remove certain or all macros from the selected templates for network nodes.
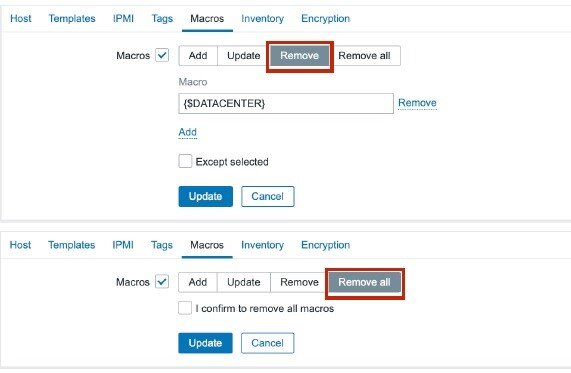
Removing individual or all user macros
12. Message format control at the notification method level. In Media types a new tab appeared Media templates with message templates.
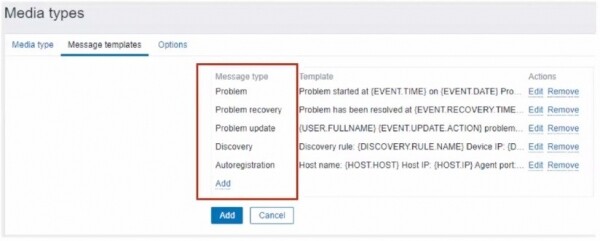
Notification method templates
Different message types can have different templates defined.
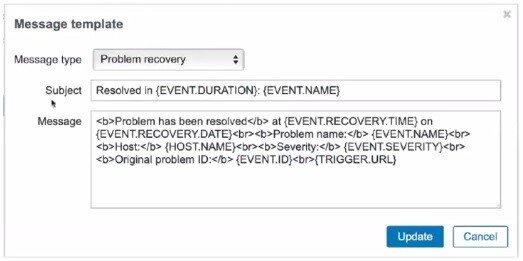
Defining a template for message types
In previous versions, it was necessary to manage these messages at the action level, defining the messages and the subject by default.
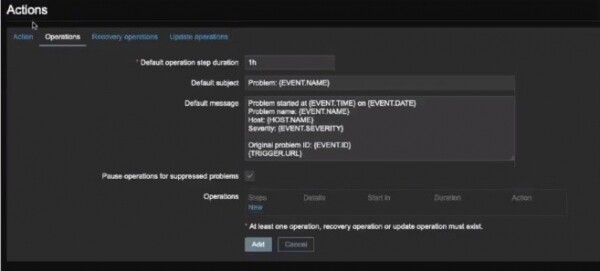
Managing templates at the action level
In the new version, everything can be defined at the global level, while at the message level — overwrite global settings.
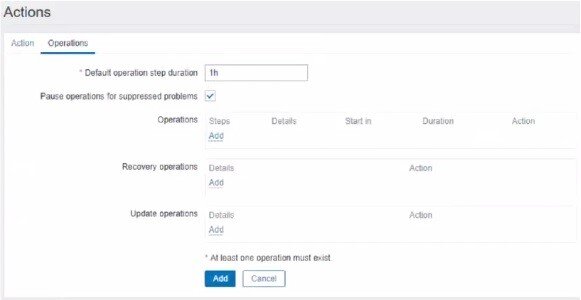
Managing templates at the global level
For most users, it is sufficient to define template formats at the notification method level. Moreover, after importing a new notification method, all corresponding template formats are already part of it.
13. Broader application of JavaScript. JavaScript is used for preprocessing scripts, Webhook, etc. It is not easy to work with JavaScript in the command line.
In Zabbix 5.0 a new utility is used — zabbix_js, which runs JavaScript that accepts data, processes it, and generates output values.
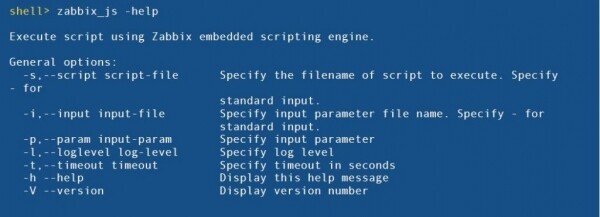
The zabbix_js utility
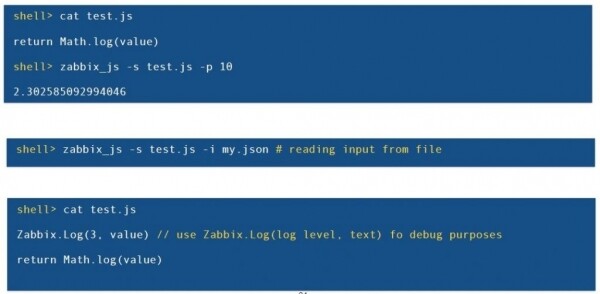
Examples of using the zabbix_js utility
14. Support for text operations with trigger expressions allows checking the versions of installed components, comparing values with some constants, where the constant can be a user macro,
{host:zabbix.version.last()}="5.0.0"
{host:zabbix.version.last()}="{$ZABBIX.VERSION}
comparing the latest value with the previous one, for example, when it comes to text data,
{host:text.last()} {host.text.prev()}or
{host:text.last(#1)} {host.text.prev(#2)}or comparing text values of different metrics.
{hostA:textA.last()}={hostB:textB.last()}15. Automation and discovery.
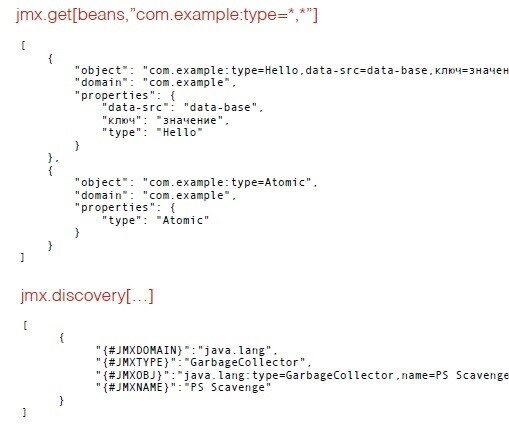
- New JMX checks are available for obtaining and discovering the list of JMX counters, which is very useful, for example, for monitoring Java applications, as well as for automating the creation of monitoring items, metrics, triggers, and graphs.
jmx.get[]and
jmx.discovery[]
JMX checks - The new version introduced a key for monitoring Windows performance counters, which is supported by both old and new agents in Russian and English, allowing for the detection of the number of processors, file systems, services, etc.

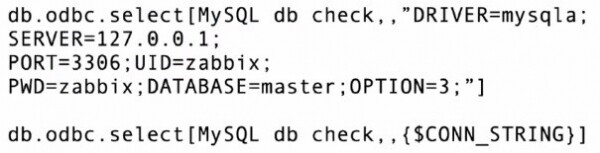
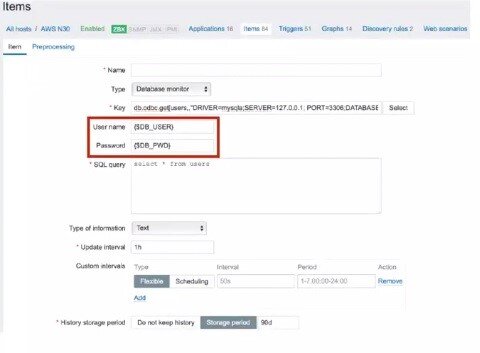
Monitoring Windows performance counters using the key perf_counter - ODBC monitoring has become much simpler. Previously, all parameters for ODBC monitoring had to be described in an external file /etc/odbc.ini, which was inaccessible from the Zabbix interface. In the new version, almost all parameters can be part of the metric key.

Metric key with parameter descriptionsIn the new version, you can specify the server name and port at the metric level, and the username and password for access using secret macros for security.

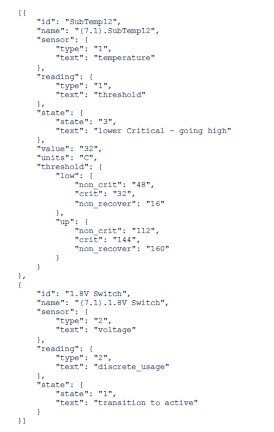
Using secret macros - When using the IPMI protocol for equipment monitoring, the ability to create simpler templates for automation using ipmi.get.

ipmi.get

16. Testing data items from the interface. Zabbix 5.0 introduced the ability to test certain data items and, more importantly, data item templates from the interface.
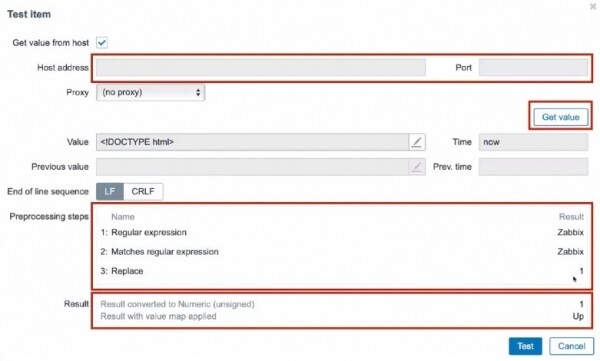
Testing data items
Any problems that arise are displayed in the interface.
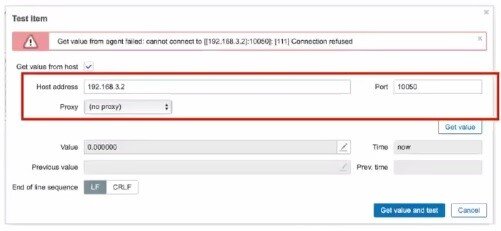
Displaying problems in the interface
A similar algorithm is used for data item templates. Additionally, if any data item is not supported, to find out the cause of the failure, you simply need to click Test.
17. Testing notification methods, which was introduced in Zabbix 4.4, is preserved, which is important when integrating Zabbix with other systems, such as ticketing systems.
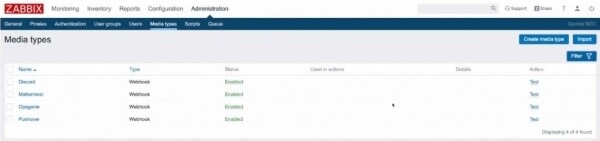
Testing notification methods
18. Support for custom macros for data item prototypes. To determine the values of custom macros, you can use LLD macros.
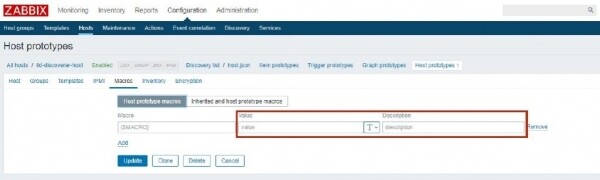
Using LLD macros to determine custom macro values
19. Support for Float64 data, which is primarily required for monitoring very large values, is needed in Zabbix to support data received from Prometheus agents.
When installing Zabbix 5.0, automatic data migration to the standard Float64 does not occur. Users can still use the old data types. Migration scripts for Float64 are run manually and change the data types in historical tables. Automatic replacement is not used as it takes a very long time.
20. Improved Scalability of Zabbix 5.0: interface optimization and elimination of bottlenecks
- Dropdown lists have been removed, for example, for selecting network nodes, as this feature does not scale.
- There are now 'built-in' limits for table sizes Overview.
- New capabilities have appeared in Monitoring > Hosts > Graphs.
- The paging function has been added (Monitoring > Hosts > Web) where it was previously unavailable.
21. Enhanced Compression
Compression in Zabbix is based on the extension for PostgreSQL — TimescaleDB (starting from Zabbix 4.4). TimescaleDB provides automatic database partitioning and improves its performance since the performance of TimescaleDB is largely independent of the database size.
In Zabbix 5.0 in Administration > General > Housekeeping you can configure, for example, data compression older than 7 days. This significantly reduces the required disk space (by almost ten times, according to user reports), improving disk space savings and boosting performance.
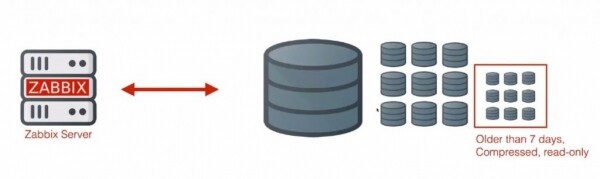
Compression with TimescaleDB
22. SNMP Configuration at the Interface Level. In Zabbix 5.0, only one type of data item is used instead of three — SNMP agent. All SNMP attributes have been moved to the network node interface level, simplifying templates, switching between SNMP versions, etc.
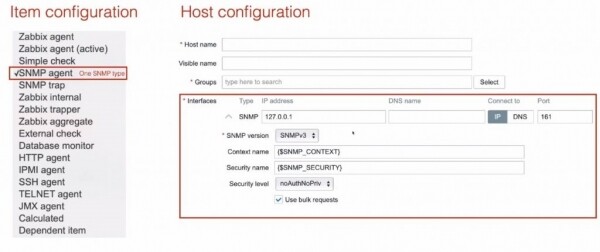
SNMP Configuration at the Interface Level
23. Dependency of Monitoring Network Node Availability on Proxy Availability allows displaying proxy availability issues as a priority in case of network node unavailability when monitoring using a trigger with the function nodata:
{HostA:item.nodata(1m)}=1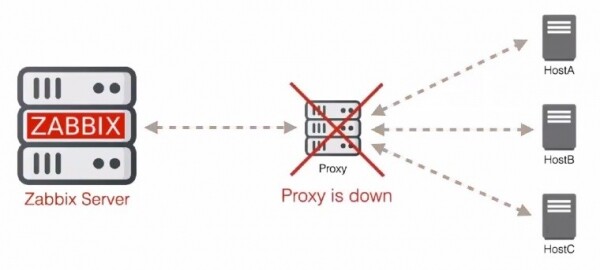
Network node availability is determined by proxy availability
Function nodata by default takes proxy availability into account. For a stricter check that does not consider proxy availability, a second parameter is used — type manipulations,:
{HostA:item.nodata(1m,strict)}=124. Management of Low-Level Discovery Rules. Zabbix 5.0 introduced an LLD filter that allows for viewing unsupported discovery rules.
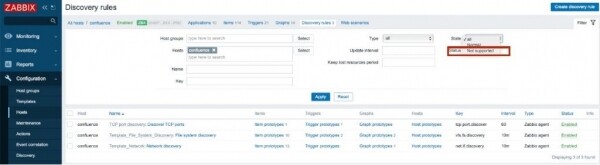
LLD filter
25. The ability to unacknowledge an issue) allows for correcting mistakes and is useful when creating workflows dependent on issue acknowledgment.
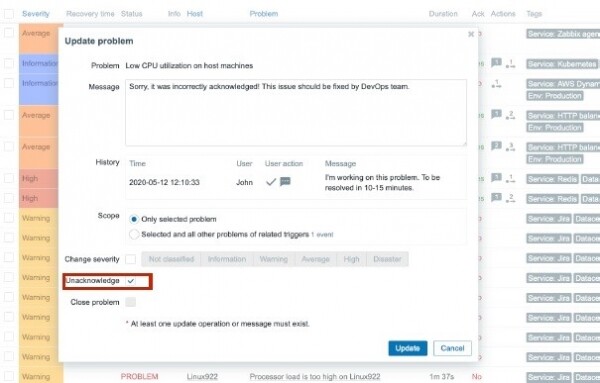
Unacknowledging an issue
26. Changes to low-level discovery rules —the ability to add exceptions when discovering objects as a result of monitoring file systems, which enables the creation or non-creation of specific objects, triggers, items, etc., during low-level discovery, changing the severity of issues, adding tags for specific objects, excluding objects such as temporary file systems from the search, changing the data update interval, etc.
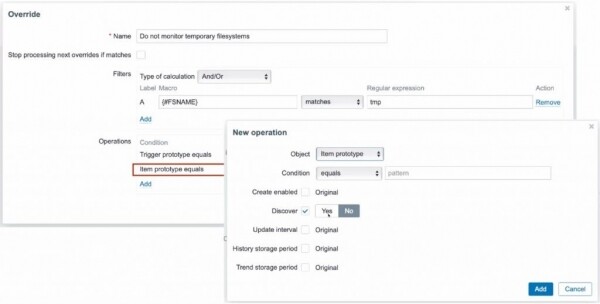
Excluding temporary file systems from low-level discovery
For example, it is possible to change the priority level of triggers for discovered Oracle file systems while maintaining the priority level of triggers for other file systems unchanged.
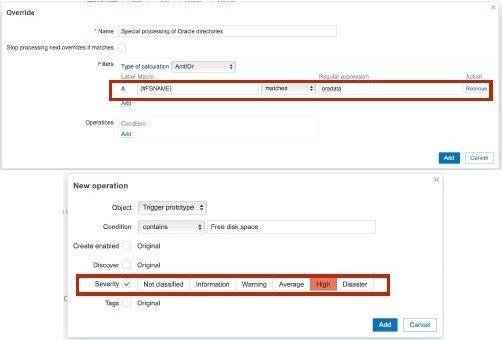
Changing the priority level of triggers for individual file systems
27. New macros in Zabbix 5.0 improve monitoring quality.
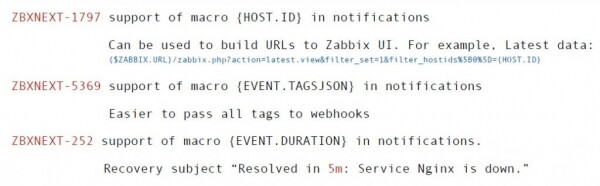
New macros in Zabbix 5.0
28. Other innovations in Zabbix 5.0:
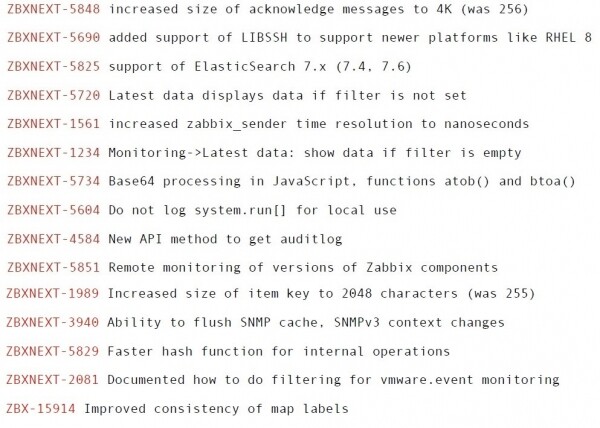
Improvements in Zabbix 5.0
29. Discontinuation of support
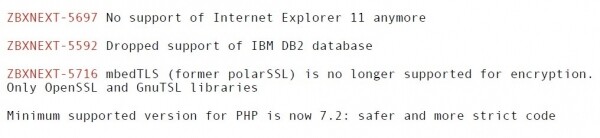
Unsupported functionality
Conclusion
Upgrading to Zabbix 5.0 is very simple! Install and run the new server binary and frontend files, and the server will automatically update your database.
Information about the Zabbix upgrade procedure is available at:
IMPORTANT!
- Updating historical data to Float64 format is not mandatory.
- TimescaleDB data is read-only.
- Minimum required version is PHP 7.2.
- DB2 is not supported as a backend for the Zabbix server.
(!) You can watch the video and slides from the presentations by Alexey Vladyshev and other speakers from the Zabbix Meetup Online (Russian). .
Source: habr.com
