I suggest that you familiarize yourself with the transcript of the 2017 report by Igor Strykhar "ClickHouse - Visually Fast and Visual Data Analysis in Tabix".
Web interface for ClickHouse in the Tabix project.
Key features:
- Works with ClickHouse directly from the browser, without the need to install additional software;
- Query editor with syntax highlighting;
- Command completion;
- Tools for graphical analysis of query execution;
- Color schemes to choose from.


I am the technical director of media2. We are a news exchange news aggregator. We store a lot of data that we receive from our partners and register it in ClickHouse - about 30 requests per second.
These are data such as:
- News clicks.
- Showing news in the aggregator.
- Displaying banners in our network.
- And we register events from our own counter, which is similar to Yandex.Metrics. This is our own microanalytics.
We had a very hectic life before ClickHouse. We suffered a lot, trying to store this data somewhere and somehow analyze it.
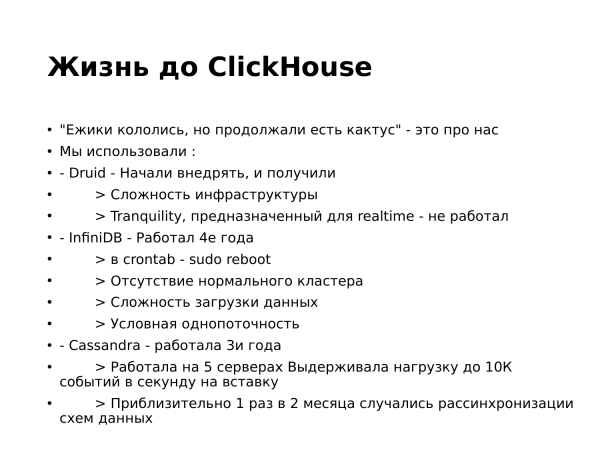
Life before ClickHouse - infiniDB
The first thing we had was infiniDB. She lived with us for 4 years. We launched it with difficulty.
- It does not support clustering or sharding. She didn’t start any such smart things out of the box by default.
- She's having trouble loading data. Only a specific console utility that could only load CSV files and was somehow very incomprehensible.
- The database is single threaded. You could either write or read. But it allowed to process a large amount of data.
- And she also had an interesting crutch. Every night it was necessary to reboot the server, otherwise it would not work.
She worked with us until the end of 2016, when we completely switched to ClickHouse.
Life before ClickHouse - Cassandra
Since infiniDB was single-threaded, we decided that we needed some kind of multi-threaded database in which we could write a lot of threads at the same time.
We tried many interesting things. Then we decided to try Cassandra. Everything was great with Cassandra. 10 requests per second per bet. 000 requests somewhere for reading.
But she also had her own interests. Once a month or every two months, she had a database out of sync. And I had to wake up and run to fix Cassandra. Restarted the servers one by one. And everything became smooth and beautiful.
Life before ClickHouse – Druid
Then we realized that we need to write even more data. In 2016 we started watching Druid.
Druid is an open base written in Java. Very specific. And it suited clickstream when we need to store some kind of stream of events and then aggregate them or make analytical reports.
Druid had version 0.9.X.
The database itself is very hard to deploy. This is the complexity of the infrastructure. To deploy it, it was necessary to put a lot of iron. And each iron was responsible for its separate role.
To load data into it, it was necessary to apply some kind of shamanism. There is an OpenSource project - Tranquility, which lost data from us in the stream. When we loaded data into it, it lost them.
But somehow we started to implement it. We, like hedgehogs who injected themselves, but continued to eat the cactus, began to introduce it. It took us about a month to prepare the entire infrastructure for it. That is, order servers, set up roles, and fully automate deployment. That is, in the event of a cluster fall, so that the second cluster is automatically deployed.
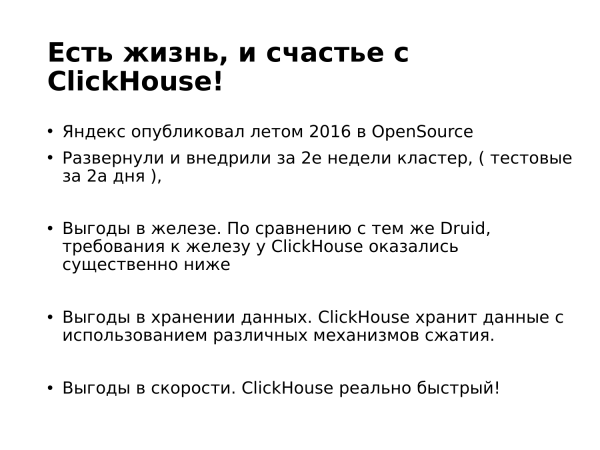
But then a miracle happened. I was on vacation and my colleagues sent me a link to , which says that Yandex decided to open ClickHouse. I say let's try.
And literally in 2 days we deployed a ClickHouse test cluster. We started loading data into it. Compared to infiniDB, this is elementary; compared to Druid, this is elementary. Compared to Cassandra, it's also elementary. Because if you load data from php into Cassandra, then this is not elementary.
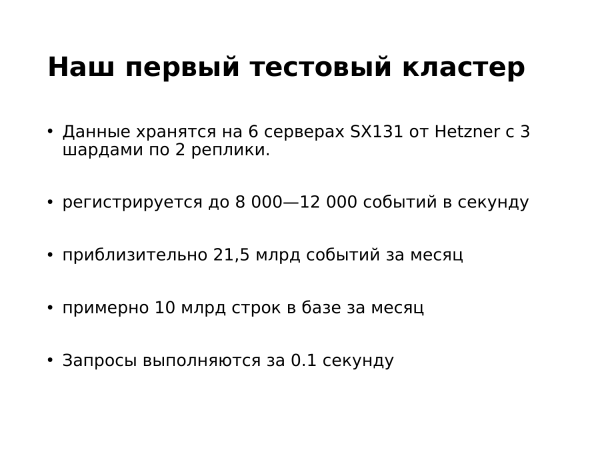
What did we get? Performance in speed. Performance in data storage. That is, much less disk space is used. ClickHouse is fast, it's very fast compared to other products.
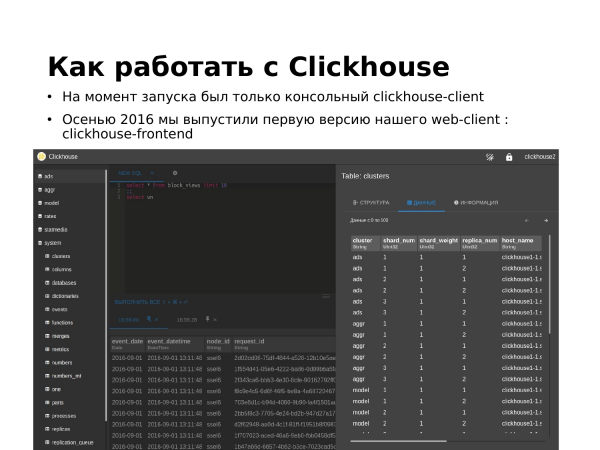
At the time of launch, when Yandex published ClickHouse in OpenSource, there was only a console client. We in our company SMI2 decided to try to make a native client for the web, so that you can open a page from a browser, write a request and get the result, because we started writing a lot of requests. Writing to the console is hard. And we made our first version.
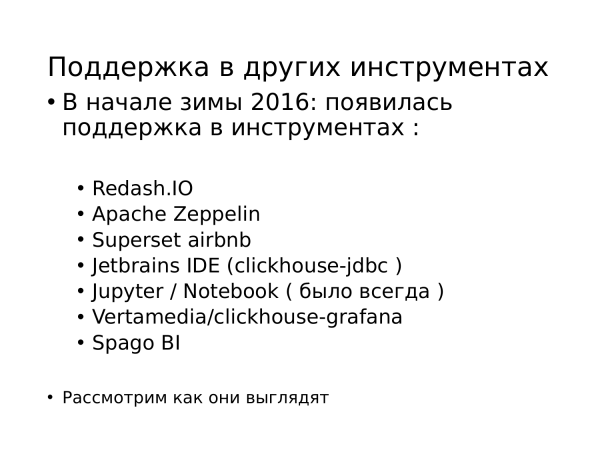
And somewhere closer to the winter of last year, third-party tools for working with ClickHouse began to appear. These are tools such as:
- .
- .
- . (Now )
- .
- .
I will review some of these tools, i.e. those that I have worked with.
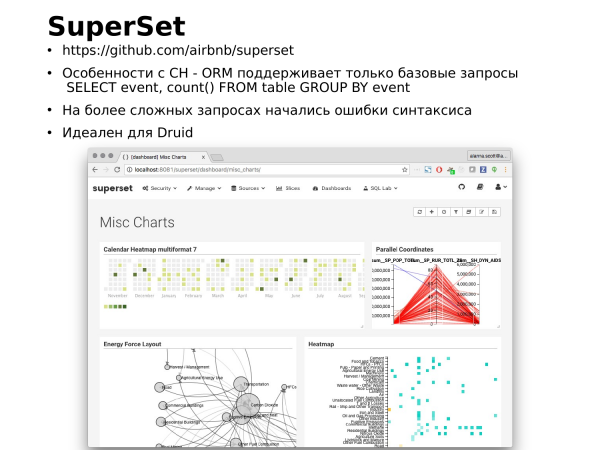
Good tool, but for Druid. When Druid was introduced, I felt SuperSet. I liked him. For a Druid, it works very fast.
It is not suitable for ClickHouse. That is, it fits, it starts, but it is ready to process only elementary queries like: SELECT event, GROUP BY event. It does not support the more complex ClickHouse syntax.
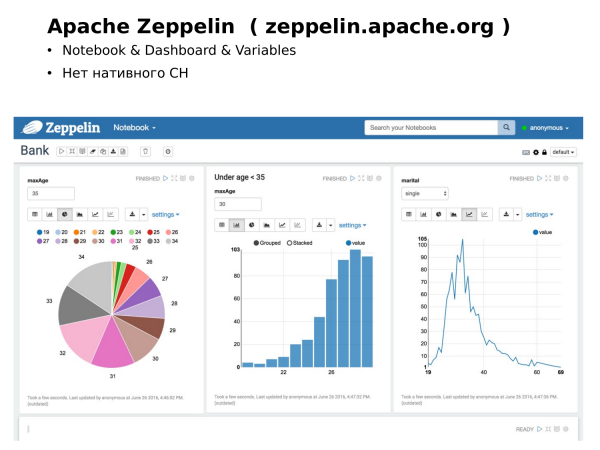
The next tool is Apache Zeppelin. This is a good and interesting thing. Works. It supports notebooks, dashboards, supports variables. I know someone from the ClickHouse community is using it.
But there is no support for the ClickHouse syntax, i.e., you will have to write queries either in the console or somewhere else. Next, check that it all works. It's just inconvenient. But he has good support for dashboarding.
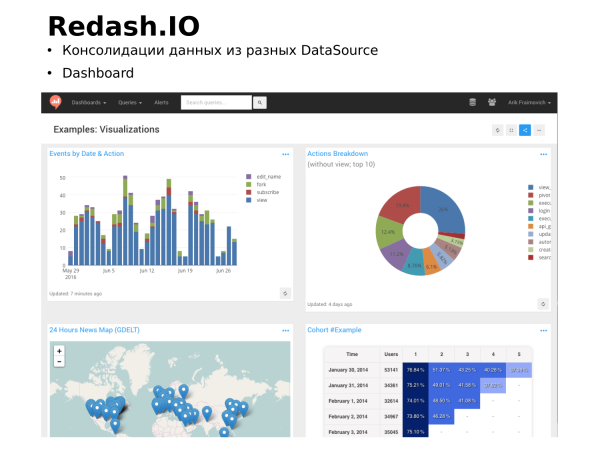
The next tool is Redash.IO. Redash is hosted on the internet. That is, unlike previous tools, it does not need to be installed. And this is such a dashboard with the ability to consolidate data from different DataSources. That is, you can upload from ClickHouse, from MySQL, from PostgreSQL, and from other databases.
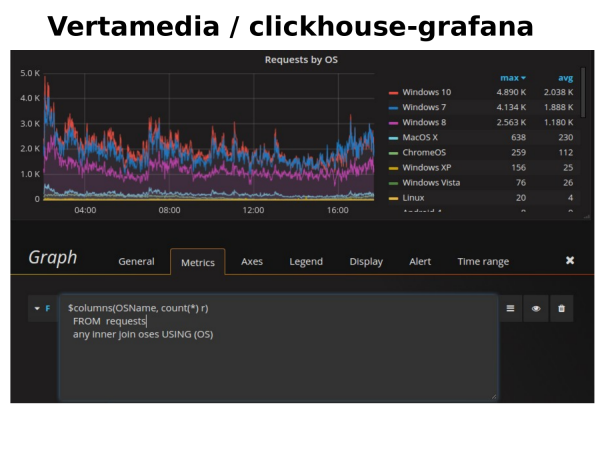
Just a month ago (in March 2017) support appeared in Grafana. When you build reports in Grafana, for example, according to the state of your hardware or according to some metrics, now you can build the same graph or some kind of panel from data from ClickHouse directly. It is very convenient, and we use it at home. This allows you to find anomalies. That is, if something happens and some hardware falls or strains, then you can see the reason if this data has managed to get into ClickHouse.
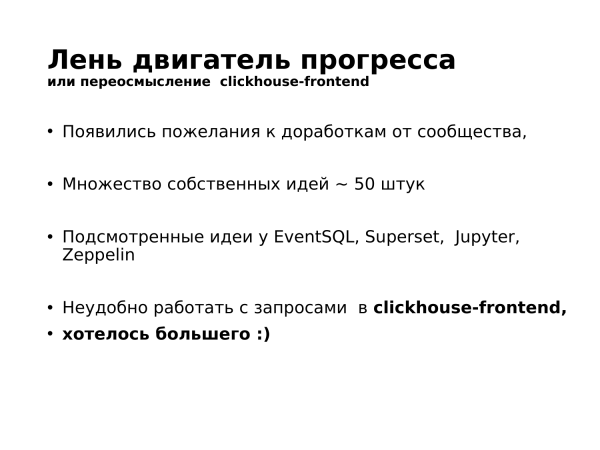
It was very uncomfortable for me to write in these tools or in the console. And I decided to finalize our first interface. And I spied the idea from EventSQL, SeperSet, Zeppelin.
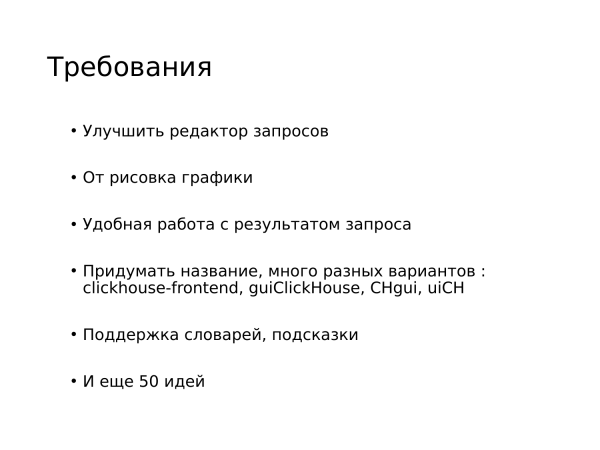
What did you want? I wanted to get graphics, an improved editor, implement support for hint dictionaries. Because ClickHouse has a great feature - it's dictionaries. But it’s hard to work with dictionaries, because you need to remember the format of the stored values, i.e. is it a number or a string, etc. And since we often use dictionaries in their different variations, it was quite difficult to write queries.
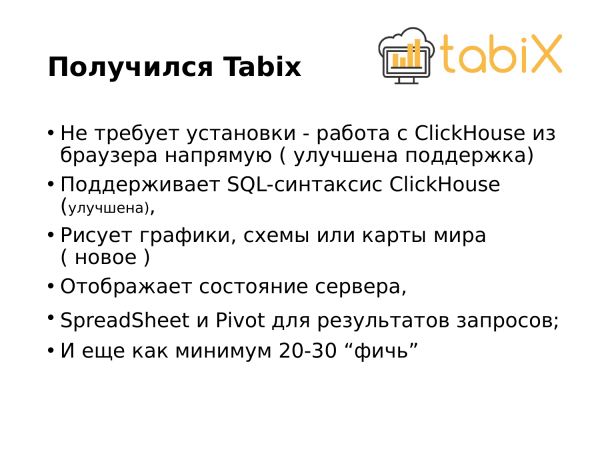
It's been 3 months since the release of our first version. I made about 330 commits to a closed branch and got Tabix.
Unlike the previous version, which was called ClickHouse-Frontend, I decided to rename it to a simple name. And it turned out Tabix.
What has appeared?
Draws graphics. Supports ClickHouse SQL syntax. Tells about functions and knows how to do a lot of interesting things.
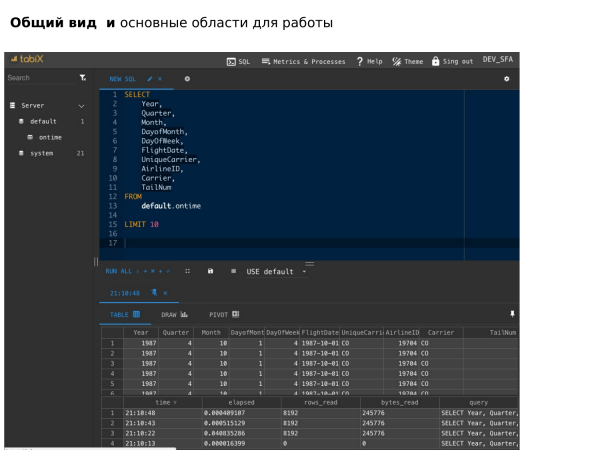
This is how the general layout of Tabix looks like. On the left is a tree. In the center is the query editor. And below is the result of this query.
Next, I will show how the query editor works.
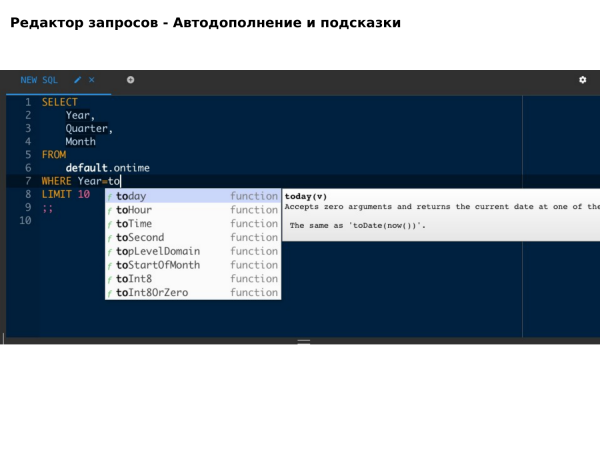
Here, autocomplete automatically worked on the table and prompts, respectively, autocomplete by fields. And feature hints. If you press ctrl enter, then the request will be executed or fall down with an error. The simplest request is sent to Tabix and the result is obtained, i.e. you can quickly work with ClickHouse.
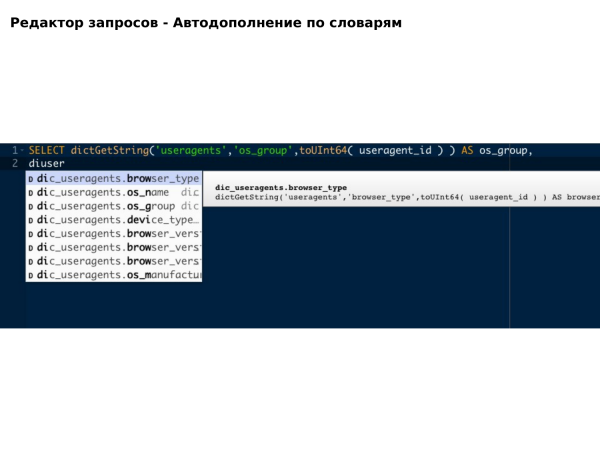
Dictionaries, as I said, are a very interesting thing with which we work a lot. And which allowed many things to be done. Suppose we store all cities in dictionaries. We store the city identifier and city name, its latitude and longitude. And in the database we store only the identifier of the city. Accordingly, we compress the data very strongly.
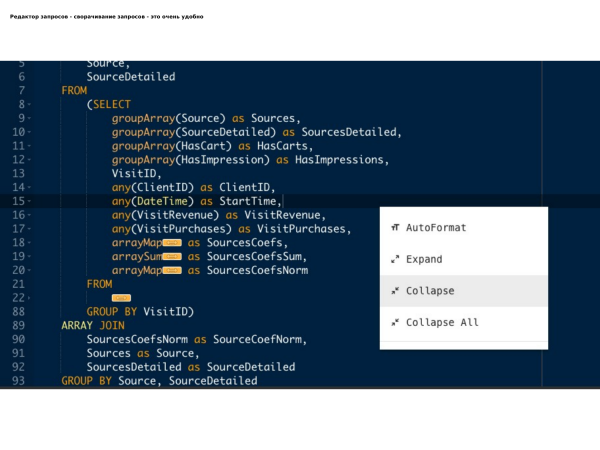
This seems to be a simple thing, but in ClickHouse it helps in a very interesting way. Due to the fact that ClickHouse only supports nested joins, the query grows down and wide enough. And when the parenthesis opens and some long expression goes, then such a fairly simple thing as query folding makes it easier to work with the query itself. Because when a request is 200-300 lines wide and it is very huge, it saves a lot by folding the request and then finding some place or somehow localizing it.
Object tree, multiqueries and tabs (Video 13:46 )
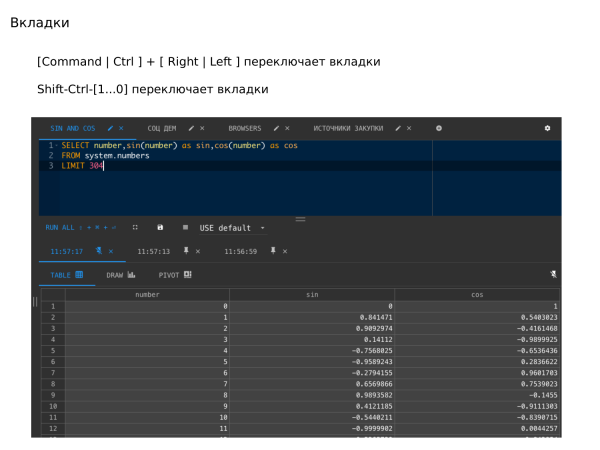
Next I will show you about the tree, tabs. On the left is a tree, on top you can create several tabs. Tabs are like a workspace. You can create multiple tabs and name each one differently. It's like a mini-system for building a report.
Tabs are automatically saved. If you restart your browser, or close or open Tabix, it will all be saved.
Hotkey is convenient (Video 14:39 )
There are hotkeys and there are a lot of them. I have included some of them here as an example. This is a tab switch, execute a request, or execute multiple requests.
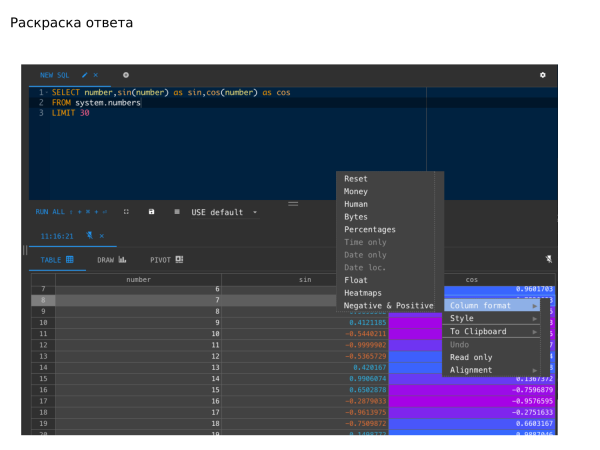
I'll show you how to work with the result. We send a request. Here I draw sin, cos and tg. You can highlight the result, i.e. draw a typical map for a column. You can highlight positive or negative values. Or just color some specific element of the table. This is convenient when the table is huge and you need to find some kind of anomaly with your eyes. When I was looking for anomalies, I highlighted some lines, some elements in green or red.
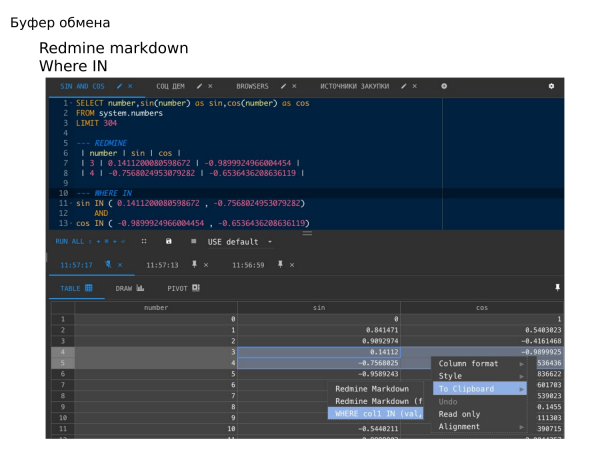
There are many interesting things there. For example, how to copy in Redmine Markdown. If you need to copy the result somewhere, it is very convenient. You can just select an area, say "Copy to Redmine" and it will copy to Redmine Markdown or create a Where query.
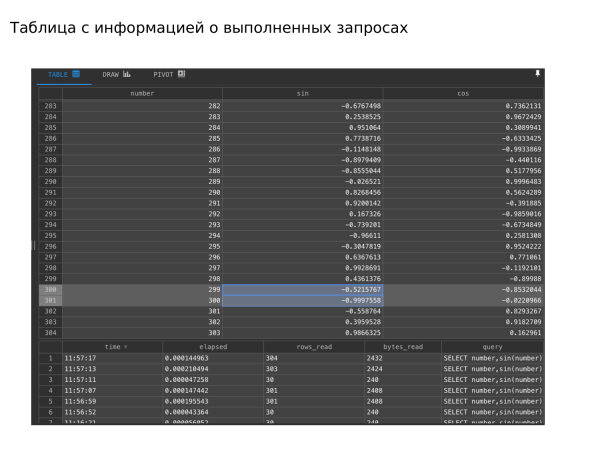
Next is query optimization. I once forgot to specify the "date" field. And my request in ClickHouse was processed not very, very quickly, but quickly, that is, less than a second. When I saw how many lines he ran through, I was scared. We do not write so many rows in this table in a day. I started to analyze the request and saw that I missed a date in one place. That is, I forgot to indicate that I do not need data for the entire table, but for a specific period.
Tabix has a “Stats” tab, which stores the entire history of sent requests, i.e. there you can see how many rows were read by this request and how long it took to run. This allows for optimization.
You can build a pivot table over the query result. You sent a request to ClickHouse and received some data. And then this data can be pulled with the mouse and build some kind of pivot table.
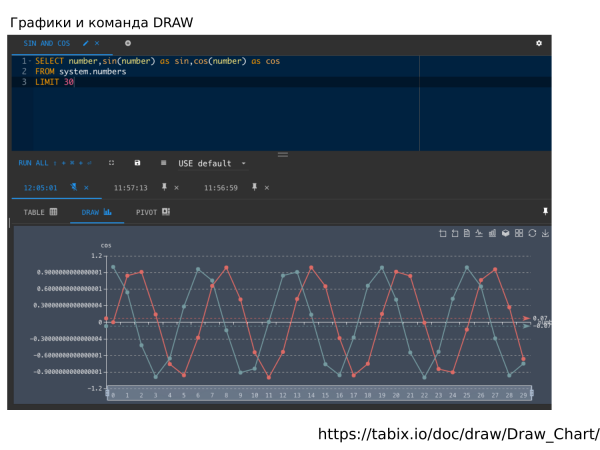
The next interesting thing is graphing. Let's say we have the following request: for sin, cos from 0 to 299. And in order to draw it, you need to select the “Draw” tab and you will get a graph with your sin and cos.
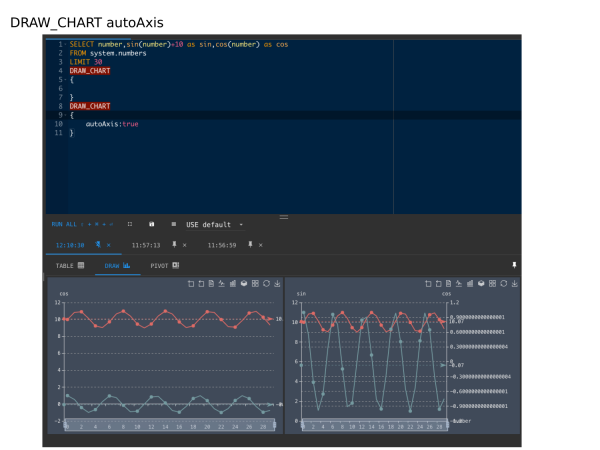
You can break it into different axes, i.e. you can draw two graphs at once side by side. Write one command and the second command.
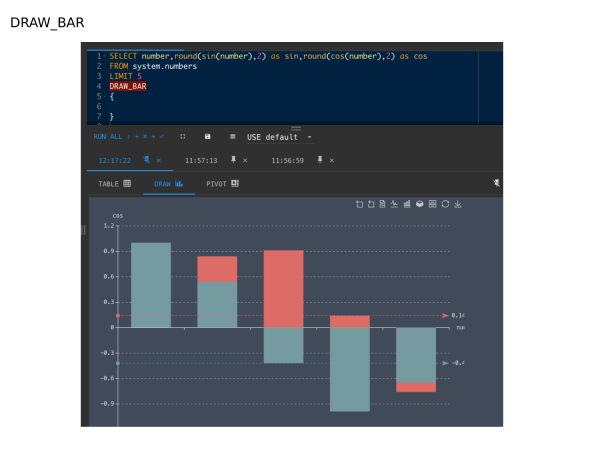
You can draw histograms.
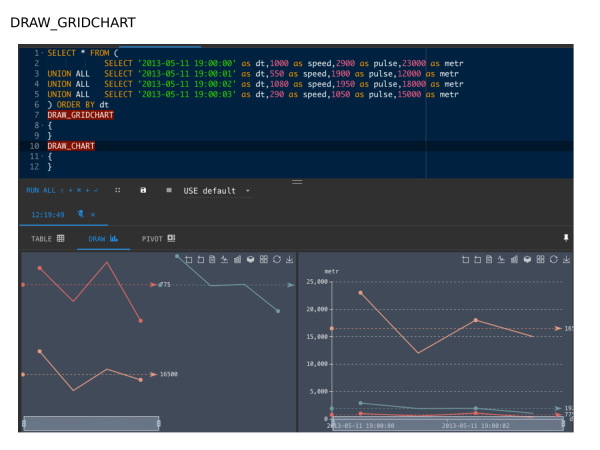
You can break it down into a matrix of graphs.
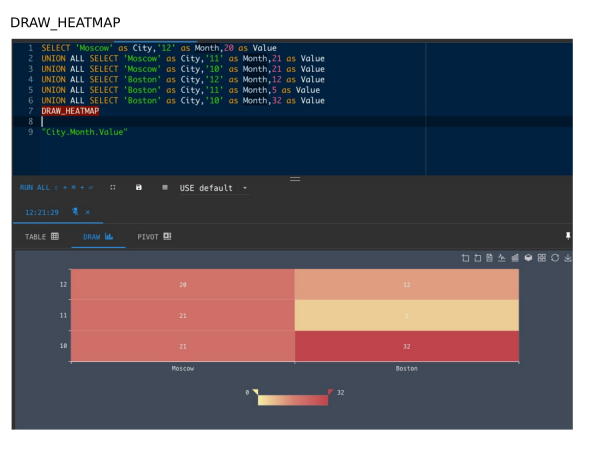
You can build a heat map.
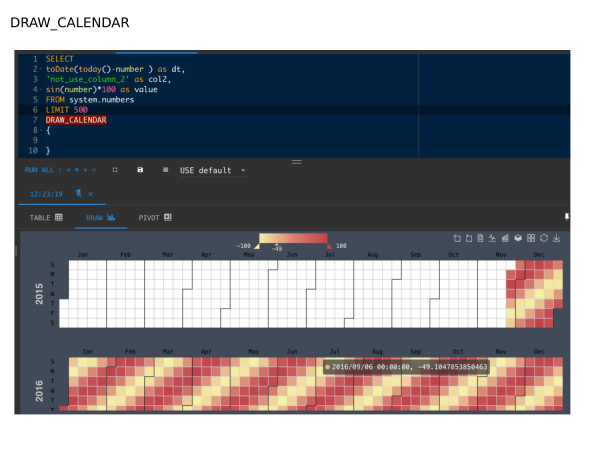
You can build a thermal calendar. By the way, a very handy thing when you need to analyze anomalies for a year, i.e., find either bursts or drops. This data visualization helped me with this.
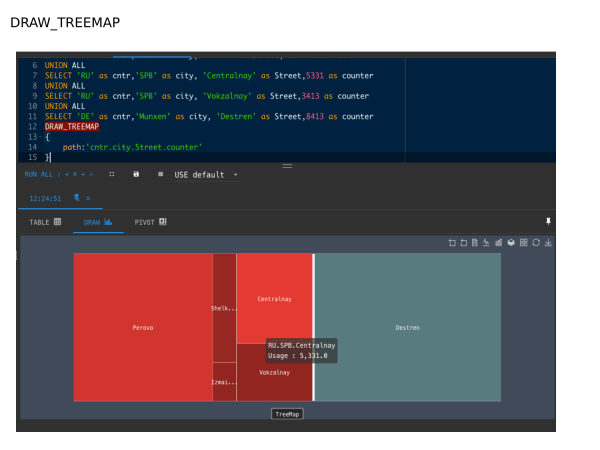
The next one is Treemap.
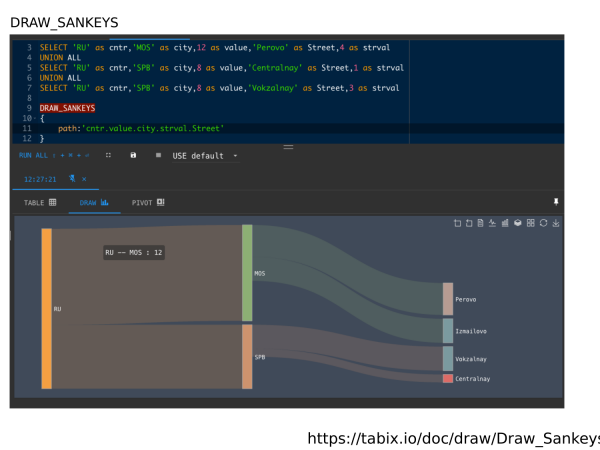
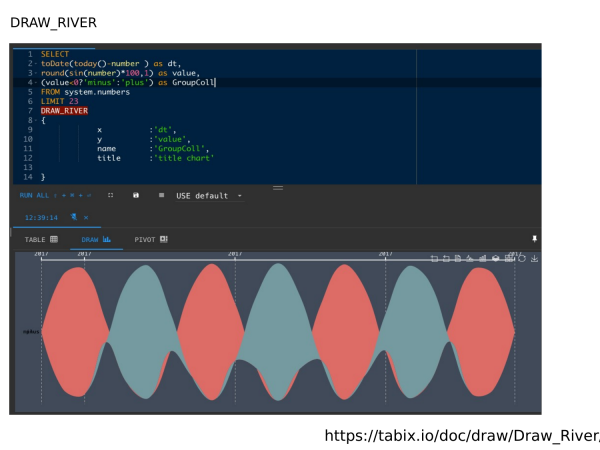
Sankeys is an interesting chart. He is either Streamgrahps or River. But I call it River. It also allows you to look for any anomalies. It is very comfortable. I recommend using it for searching.
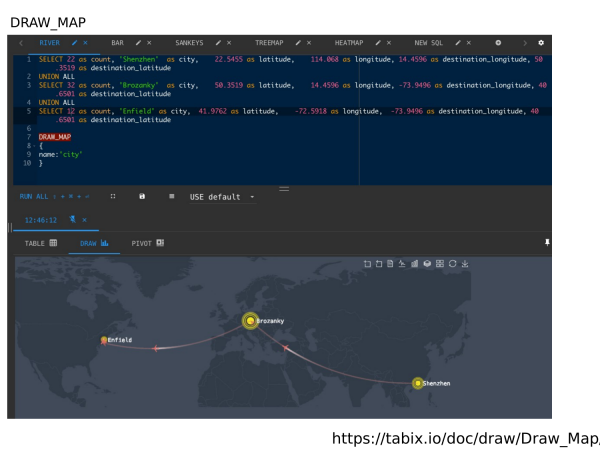
The next interesting thing is the rendering of the dynamic map. If you have latitude, longitude stored in your database and, for example, an appointment is stored, if you have, for example, trucking or planes fly, then you can draw destination paths. Also there you can set the speed, the size of these objects in which they arrive.
But the problem with this map is that it only draws a map of the world, there is no detail.
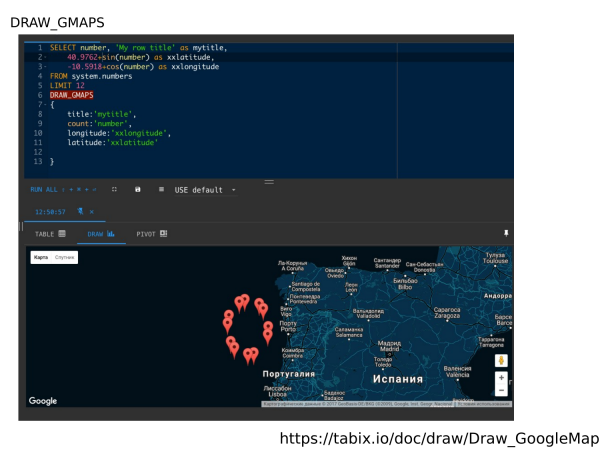
Later I added a Google map. If you store latitude, longitude, then you can draw the result on a Google map, but without airplane support.
We discussed the main functions of working with the result, with a query in Tabix.
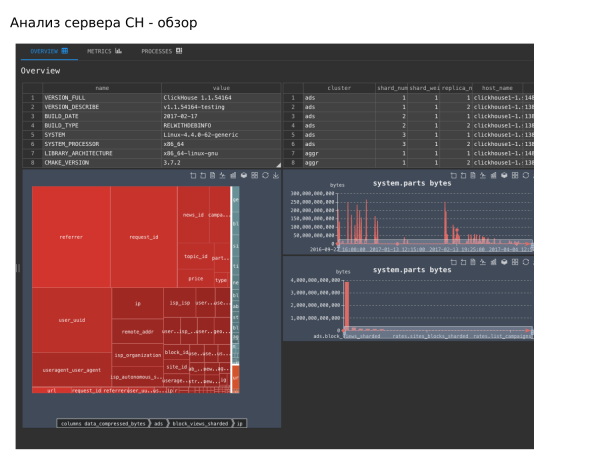
The next one is the analysis of your ClickHouse server. There is a separate "Metrics" tab where you can see the size of the stored data for each column. The screenshot shows that this “referrer” field occupies something on the order of 730 Gb. If we refuse this field, then we will save three 700 GB shards, i.e. about 2 TB, which we do not need.
We also have a "request_id" field that we store in a string. But if we start storing it in numerical form, then this field will be colossally compressed.
It also shows the server configuration and the list of nodes in your cluster.
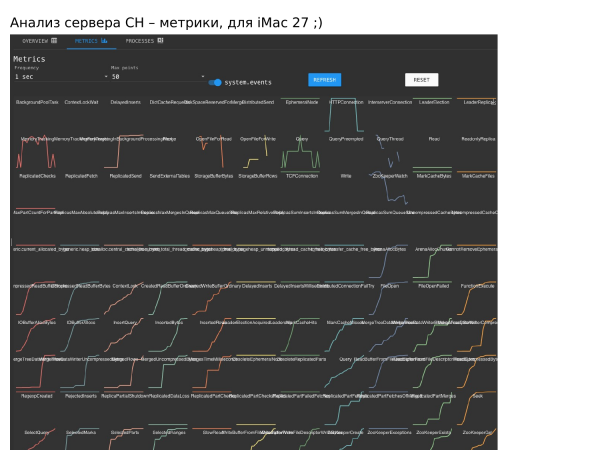
The next tab is metrics. They get into realtime from ClickHouse and simply allow you to analyze the state of the server and understand what is happening to it. This is not a replacement for the full-fledged Grafana. This is necessary in order to quickly analyze.
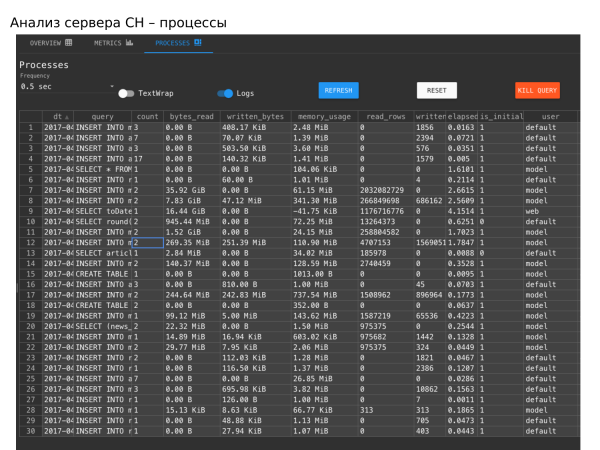
The next tab is processes. From them you can understand what is happening on the server. Understand what's going on there. I had a query that took 200 GB to read each time. I saw it thanks to this interface. Caught it and corrected it. And it turned out about 30 GB, i.e. performance at times.
Thank you! And it's in OpenSource
I finished. And by the way, it's in OpenSource, it's free and you don't even have to download it. Open in a browser and everything will work.
Questions
Igor, what's next? Where will you develop this tool?
Dashboarding will appear next, i.e., perhaps dashboarding will appear. Integration with other databases. This I have done, but have not yet published to OpenSource. It's MySQL and possibly PostgreSQL. That is, it will be possible to send requests from Tabix not only to ClickHouse, but also to other tools.
It is clear that a huge amount of work has been done. It turned out to be quite a complete idea. In the browser, it was done, apparently, in order to exclude crutches on any axes and quickly throw the whole thing. I heard that you are php work, so the easiest way is to throw in the browser and it will work everywhere. There are no questions for this. The question is. A lot has been done there indeed. How many people worked on it? And how long did it all take? Because tools for themselves usually do not have such great functionality.
One person from our team worked from summer to autumn. This was the first version. Then I did 330 commits alone. What you see, my colleague and I did it in half. For 3 months from the very first version to the last one, I did it alone for the most part. But I don't know Javascript very well. This was my only and hopefully last Javascript project I worked on. I got it, I looked - oh, horror. But I really wanted to finish the product and that's what happened.
Thanks a lot for the report! This is a great tool. WITH Instrument compared?
Thank you. That's why Tabix named it, because the first letters are the same.
Because you are competing?
There will be a lot of investment, we will compete.
How to offer to sell to internal analysts what this tool will completely replace *Tableau*? What will be the arguments?
Works natively with ClickHouse. I tried Tableau, but you can't write support for dictionaries and the like there. I know how people work with Tabix. They write a request, upload to CSV and upload to BI. And they are already doing something. But I can hardly imagine how they do it, because it is a graphical tool. It can upload 5 lines, 000 lines maximum, but no more, otherwise the browser won't survive.
That is, there are some serious restrictions on the amount of data, right?
Yes. I can’t imagine that you want to upload 10 rows to your table on the browser screen. For what?
Is it meant to be an interface for a quick view of the data? Twirl a little, twist?
Yes, quickly see how it works and just build a summary chart. And then give somewhere. We have our own reporting system, from where I just take this request. I draw in Tabix and send it to our reporting.
And another question. Cohort analysis?
If there are requests, we will add.
When you first started using ClickHouse, how long did it take to implement clickhouse and bringing to production states?
As I said, we implemented a test cluster in a very short time. We unwrapped it in two days. And we tested it for a couple more weeks. And we reached production in 3 months. But we had our own ETL, i.e. a tool for recording data. And he wrote to us in everything that is possible. He can write in MongoDB, Cassandra, MySQL. It was easy to teach him how to write in ClickHouse. We had a ready-made infrastructure for rapid implementation. For 3 months we started throwing out the first component. For 6 months, we completely abandoned everything else. We have one ClickHouse left.
Igor, thank you very much for the report. I really liked the functionality of building paths on maps. Are you planning to integrate with Yandex.Maps and, in particular, with custom Yandex.Maps?
I tried to integrate instead of Google map, but I didn't find a dark theme on Yandex.Maps. I left out one piece. I'll rewind to add.
Slide - Google map. Here there is a command "DRAW_GMAPS", which draws a map. There is a "DRAW_YMAPS" command, i.e. it can draw a Yandex.Map. But in fact, under this command is Javascript, that is, the data that you get from ClickHouse can be transferred to Javascript, which you write here. And you have an output area where it should be drawn. You can draw any chart, i.e. any chart, map, you can draw your own component. Before that, I had another library for drawing the graphs themselves.
That is, is there a tool for customizing the display functionality?
Any. You can take and recolor these points, making them not red, but blue, green.
Thanks for the report! You had a slide showing alternative query tools clickhouse for building dashboards, analytical reports. I understand that at the moment when you started working with ClickHouse, no adapters were written for these tools. And I wonder why you decided to make your own tool, instead of writing an adapter for some ready-made tool? I think tweaking the test editor is fast. Why did you choose to do so much work?
There is an interesting such moment - the fact is that I am a technical director, and not a data scientist. By the time we started implementing Druid, I had about 50% of the tasks in the roadmap - let's calculate this, or let's calculate this, or analyze this. And it turned out that we implemented ClickHouse. And he began to quickly build everything, count, quickly closed his roadmap. And by that time I realized that I lacked knowledge of Data Science, data visualization. Tabix is sort of my homework for learning data visualization. I was looking at how to complement Zeppelin. I have a slight dislike for his programming. I looked at how to add Redash, but a normal editor was enough for me. And SuperSet is also written in a language that I don't really like. And so I decided to bike, and this is what happened.
Igor, do you accept pull requests?
Yes.
Thanks a lot for the report! And two questions. First, you are not very flattering about javascript. Did you write in pure Javascript or is it some kind of framework?*
Better on bare Javascript.
So what framework?
Angular.
It's clear. And the second question. Have you considered R и *Shiny**?*
Considered. Played.
You could also just write an adapter.
He is. It seems that the community made it, but, as I answered the previous question, I wanted to feel it myself.
* No, about the visualization, there is.
You say that there is such a thing and it will draw a graph for you. I opened a data visualization book. And I thought: “Let's try to visualize this data. I’ll write it myself so that he can rebuild the data.” And I began to better understand the technology of data feed. And if I took a ready-made component, I personally would have learned how to use it worse, that is, visualization. But so - yes, I liked R, but I have not read the book "R for Dummies" yet.
Thank you!
Simple question. Are there any ways to quickly unload a plate, a graph?
Can be uploaded to CSV, to Excel.
Not data, but a ready-made table, a ready-made graph? For example, to show the authorities.
There is an "Upload" button and there is a button "Upload chart in png, in jpg".
Thank you!
PS Mini tabix installation instructions
- Download
- Unpack, copy directory
buildin nginx root_path - Set up nginx
Source: habr.com


