

Transcription of Alexey Lesovskiy's 2015 report "Deep dive into PostgreSQL internal statistics"
Disclaimer from the author of the report: I would like to note that this report dates back to November 2015 — more than 4 years have passed and a lot of time has gone by. The version discussed in the report, 9.4, is no longer supported. Over the past 4 years, 5 new releases have come out, introducing many innovations, improvements, and changes regarding statistics, and part of the material has become outdated and no longer relevant. As I review it, I have tried to highlight these places so as not to mislead you, the reader. However, I did not rewrite these sections, as there are too many of them, and it would ultimately result in a completely different report.
PostgreSQL is a massive mechanism, consisting of many subsystems, the smooth operation of which directly affects the database's performance. During operation, statistics and information about the functioning of components are collected, allowing for an assessment of PostgreSQL's effectiveness and measures to improve performance. However, there is a vast amount of information presented in a rather simplified manner. Processing and interpreting this information can often be a non-trivial task, and the "zoo" of tools and utilities can easily stump even an advanced DBA.
Good day! My name is Alexey. As Ilya mentioned, I will be talking about PostgreSQL statistics.
PostgreSQL activity statistics. PostgreSQL has two types of statistics. Activity statistics, which is what I will discuss, and planner statistics related to data distribution. I will specifically cover the activity statistics of PostgreSQL, which allow us to assess performance and find ways to improve it.
I will explain how to effectively use statistics to tackle various problems that you may encounter or may arise.

What will not be covered in the report? I will not touch upon planner statistics, as this is a separate topic for a different report on how data is stored in the database and how the query planner obtains information about the qualitative and quantitative characteristics of this data.
And there will be no tool reviews; I will not compare one product to another. There will be no advertising. Let's set that aside.
I want to show you that using statistics is beneficial. It's necessary. Using it is not scary. All we need is basic SQL and some foundational knowledge of SQL.
And we'll discuss which statistics to choose for solving problems.
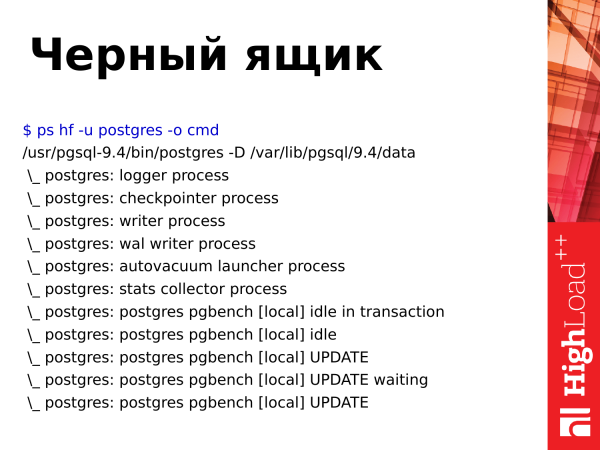
If we look at PostgreSQL and run a command in the operating system to view processes, we will see a "black box." We'll see some processes doing something, and from their names, we can roughly infer what they are doing. However, essentially, it remains a black box; we cannot see inside.
We can check CPU load in top, and we can observe memory utilization with various system utilities, but we cannot look inside PostgreSQL. For that, we need other tools.
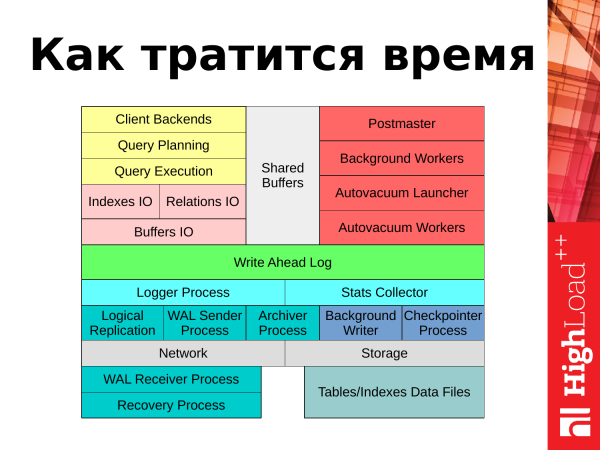
Continuing further, I will explain where time is spent. If we imagine PostgreSQL as a diagram, we can determine where time is allocated. There are two main areas: processing client requests from applications and background tasks performed by PostgreSQL to maintain its functionality.
Starting from the upper left corner, we can trace how client requests are processed. A request comes from the application, and a client session is opened for further action. The request is sent to the scheduler. The scheduler creates an execution plan. It is then dispatched for execution, which involves some block I/O associated with tables and indexes. The required data is read from disks into memory in a special area called "shared buffers." The results of the request, if they are updates or deletes, are logged in the transaction journal in WAL. Some statistical information is recorded in the log or sent to the statistics collector. The result of the request is then returned to the client. After that, the client can repeat the process with a new request.
What do we have regarding background tasks and background processes? We have several processes that ensure the database operates smoothly and maintains its normal working state. These processes will also be covered in the report: autovacuum, checkpointer, processes related to replication, and background writer. I will address each of them as we go along in the report.
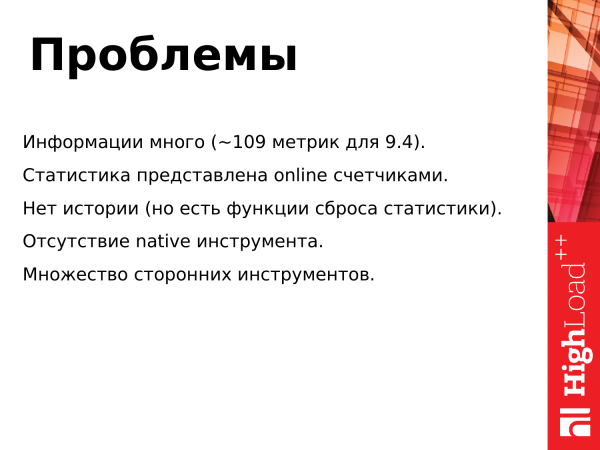
What problems exist with statistics?
- There is a lot of information. PostgreSQL 9.4 provides 109 metrics for viewing statistical data. However, if there are many tables, schemas, and databases in the database, all these metrics will have to be multiplied by the corresponding number of tables and databases. That is, the amount of information increases even more. It is very easy to get lost in it.
- The next problem is that the statistics are presented as counters. If we look at this statistics, we will see constantly increasing counters. And if a long time has passed since the last reset of the statistics, we may see values in the billions. This information doesn't tell us anything.
- There is no history. If a failure occurred 15-30 minutes ago, you won't be able to use the statistics to see what was happening at that time. This is a problem.
- The lack of a built-in tool in PostgreSQL is an issue. The core developers do not provide any utility. They have nothing like that. They simply provide the statistics in the database. You can use it, make queries to it, and do whatever you want.
- Since there is no built-in tool in PostgreSQL, this leads to another problem. Many third-party tools are available. Every company with reasonably skilled developers tries to write its own program. As a result, there are many tools in the community that can be used for working with statistics. Some tools have certain features, while others may miss those features or have some new ones. This creates a situation where you need to use two, three, or four tools that overlap with each other and have different functionalities. This is very inconvenient.
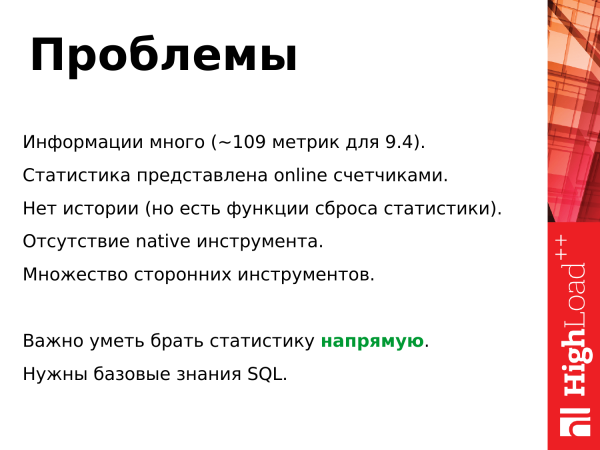
What follows from this? It is important to be able to access statistics directly, so as not to depend on programs, or to improve those programs yourself: adding certain functions to gain your advantages.
And basic SQL knowledge is needed. To retrieve data from the statistics, you need to formulate SQL queries, meaning you must know how to construct select, join.
Statistics offers us several things. They can be divided into categories.
- The first category includes events that occur within the database. This is when some event happens in the database: a query, access to a table, autovacuum, commits—these are all events. The counters corresponding to these events are incremented. We can track these events.
- The second category pertains to object properties such as tables and databases. They have properties, such as the size of the tables. We can track the growth of tables and indexes. We can observe changes over time.
- The third category is the time spent on an event. A query is an event. It has its own specific duration measure. Here it started, there it ended. We can track that. This also includes the time spent reading a block from the disk or writing. Such metrics are also monitored.
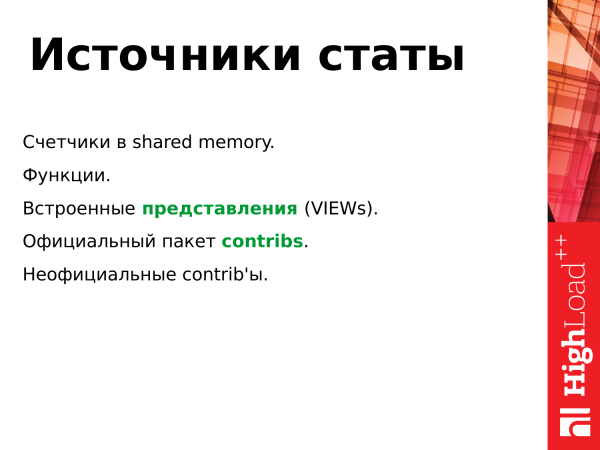
The sources of statistics are presented as follows:
- In the shared memory (shared buffers), there is a segment for storing statistical data, where those counters are located that are constantly incremented when certain events occur or specific moments arise in the operation of the database.
- All these counters are not accessible to users and not even to administrators. These are low-level elements. To access them, PostgreSQL provides an interface in the form of SQL functions. We can perform selects using these functions and obtain some metrics (or a set of metrics).
- However, using these functions is not always convenient, so the functions serve as a basis for views (VIEWs). These are virtual tables that provide statistics on a specific subsystem or set of events in the database.
- These built-in views (VIEWs) are the main user interface for working with statistics. They are available by default without any additional configuration, and you can use them right away to view and extract information. There are also contribs. The contribs are official. You can install the postgresql-contrib package (e.g., postgresql94-contrib), load the necessary module in the configuration, specify its parameters, restart PostgreSQL, and then you can use them. (Note. Depending on the distribution, in the latest versions, the contrib package is part of the main package.).
- There are unofficial contribs. They do not come with the standard PostgreSQL package. You need to either compile them or install them as a library. The options can be quite varied, depending on what the developer of this unofficial contrib has come up with.
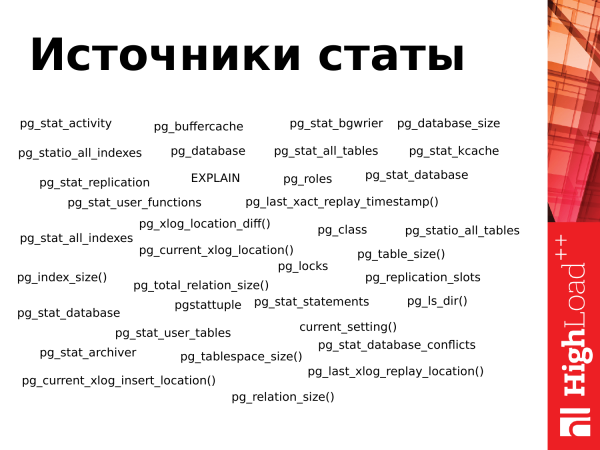
This slide presents all the views (VIEWs) and some of the functions that are available in PostgreSQL 9.4. As we can see, there are quite a few. It can be pretty easy to get confused if you've encountered this for the first time.
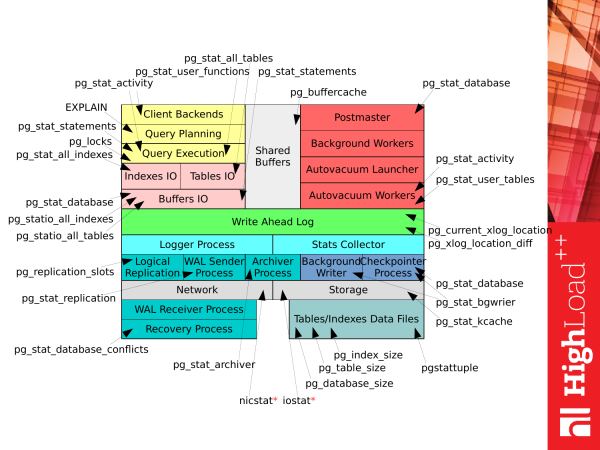
However, if we take the previous image How time is spent on PostgreSQL and match it with this list, we get this picture. Each view (VIEWs) or each function can be used for various purposes to obtain corresponding statistics while PostgreSQL is running. And we can get some information about the operation of the subsystem.
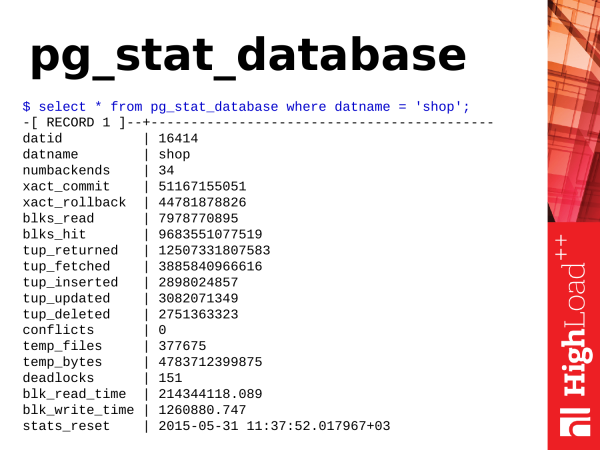
The first thing we will consider is pg_stat_database. As we can see, this is a view. It contains a lot of information. A diverse range of information. And it provides very useful insights into what is happening in the database.
What useful information can we extract from it? Let's start with the simplest things.
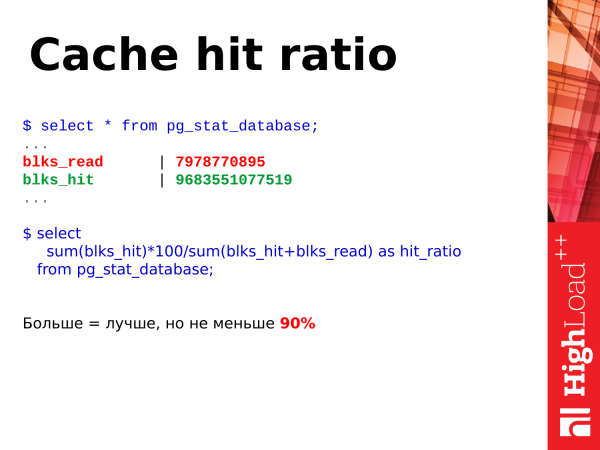
select
sum(blks_hit)*100/sum(blks_hit+blks_read) as hit_ratio
from pg_stat_database;
The first thing we can check is the cache hit percentage. The cache hit percentage is a useful metric. It allows us to assess how much data is retrieved from the shared buffers cache and how much is read from disk.
It goes without saying that the higher our cache hit rate, the better. We evaluate this metric as a percentage. For instance, if the percentage of cache hits exceeds 90%, that’s a good sign. If it drops below 90%, it means we don't have enough memory to hold the 'hot' set of data in memory. To access these data, PostgreSQL has to reach out to the disk, which is slower than reading from memory. We need to consider increasing memory: either by expanding the shared buffers or by upgrading the physical memory (RAM).
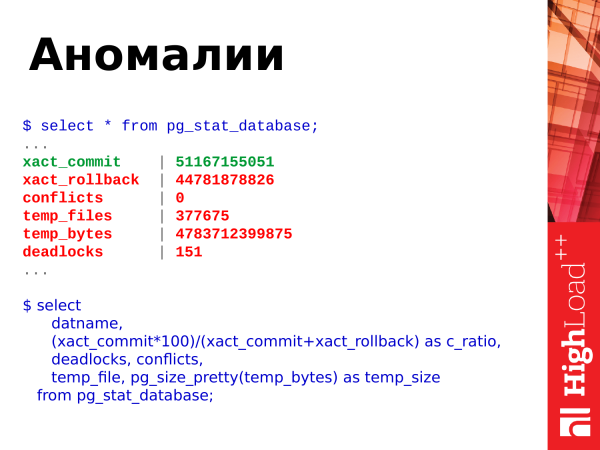
select
datname,
(xact_commit*100)/(xact_commit+xact_rollback) as c_ratio,
deadlocks, conflicts,
temp_file, pg_size_pretty(temp_bytes) as temp_size
from pg_stat_database;
What else can we gather from this view? We can analyze anomalies occurring in the database. What is shown here? There are commits, rollbacks, the creation of temporary files, their size, deadlocks, and conflicts.
We can utilize this query. This SQL is quite simple. We can also take a look at this data on our end.
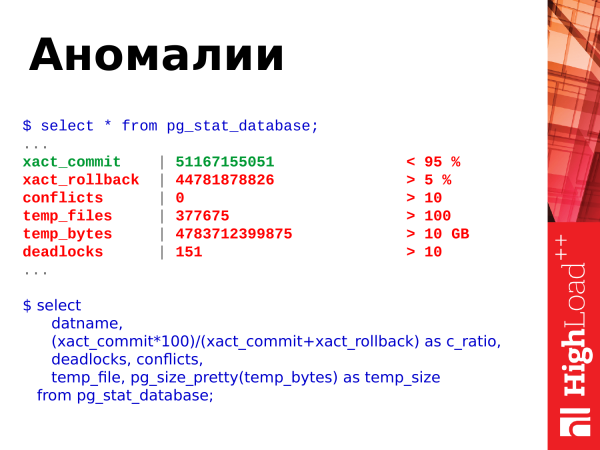
And here we have the thresholds right away. We are looking at the ratio of commits to rollbacks. Commits are successful confirmations of transactions. Rollbacks are when a transaction has done some work, stressed the database, performed calculations, and then a failure occurred, nullifying the results of the transaction. A constantly increasing number of rollbacks is bad. Therefore, we need to find ways to avoid them and modify the code to prevent such occurrences.
Conflicts are related to replication, and they should also be avoided. If you have requests running on a replica that result in conflicts, you need to analyze these conflicts and understand what is happening. Details can be found in the logs. Resolve conflicting situations so that application requests run without errors.
Deadlocks are also a problematic situation. When requests fight for resources—one request locks one resource while the second request locks another resource, and then both requests try to access each other's resources, they get blocked waiting for the neighbor to release the lock—this is also a problem that needs to be resolved by rewriting applications and serializing access to resources. If you notice that deadlocks are increasing steadily, you should check the details in the logs, analyze the situations that arise, and identify the problems.
Temporary files are also an issue. When a user request lacks memory to hold operational, temporary data, it creates a file on the disk. All operations that could be performed in memory's temporary buffer are now being executed on the disk, which is slow. This increases the execution time of the request. As a result, the client that sent the request to PostgreSQL will receive a response a bit later. If all these operations are executed in memory, Postgres will respond much faster, and the client will have to wait less.
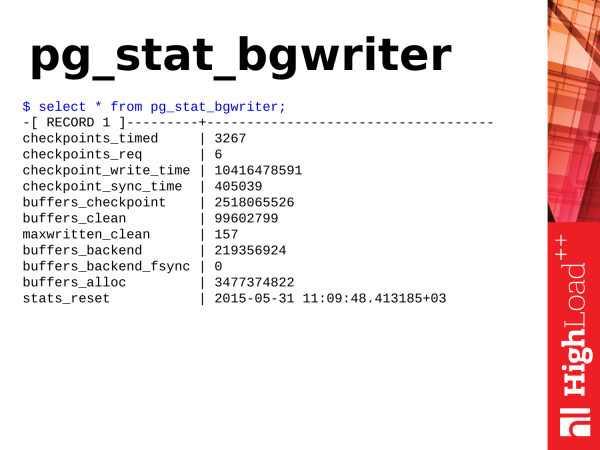
Pg_stat_bgwriter is a view that describes the functioning of two background subsystems of PostgreSQL: checkpointer and background writer.
First, let’s examine checkpoints, also known as checkpointsWhat are checkpoints? A checkpoint is a position in the transaction log that indicates all data changes recorded in the log are successfully synchronized with the data on the disk. Depending on the workload and settings, this process can be lengthy, primarily involving the synchronization of dirty pages in shared buffers with the data files on disk. Why is this necessary? If PostgreSQL accessed the disk and retrieved data for every request, as well as wrote data during each access, it would be slow. Therefore, PostgreSQL has a memory segment whose size depends on settings in the configuration. Postgres stores operational data in this memory for subsequent processing or output on requests. In cases of data modification requests, the data is altered, resulting in two versions of the data: one in memory and the other on disk. Periodically, these data need to be synchronized. We need to synchronize what has been modified in memory to disk. This is where checkpoints come in.
A checkpoint goes through the shared buffers, marking dirty pages that are needed for the checkpoint. Then it performs a second pass through the shared buffers. The pages marked for the checkpoint are then synchronized. This is how the data synchronization with the disk is executed.
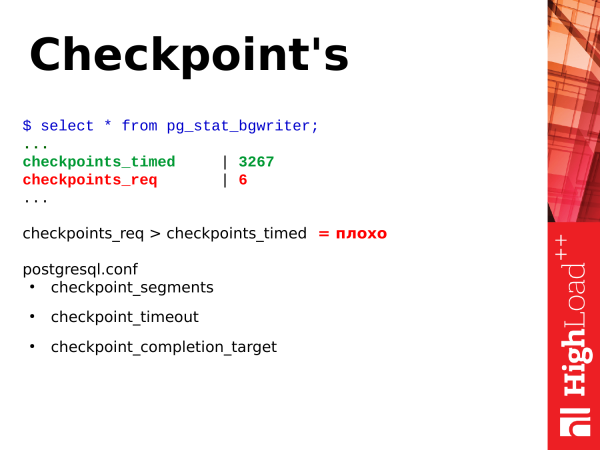
There are two types of checkpoints. One checkpoint occurs on a timeout. This is a useful and beneficial checkpoint— checkpoint_timed. And there are checkpoints on demand— checkpoint required. This type of checkpoint happens when we have a very large amount of data being written. We have recorded a lot of transaction logs. PostgreSQL determines that it needs to synchronize everything as quickly as possible, make a checkpoint, and move on.
If you viewed the statistics from pg_stat_bgwriter and saw that your checkpoint_req is much greater than checkpoint_timed, that's a bad sign. Why is this bad? It means that PostgreSQL is in a constant stressful situation where it needs to write data to disk. A timeout checkpoint is less stressful and occurs according to an internal schedule, stretching out over time. PostgreSQL has the ability to pause operations and avoid stressing the disk subsystem. This is beneficial for PostgreSQL. Queries executed during a checkpoint will not experience stress from the disk subsystem being busy.
There are three parameters for regulating the checkpoint:
checkpoint_segments.checkpoint_timeout.checkpoint_completion_target.
These allow you to control the operation of checkpoints. However, I won't dwell on them. Their impact is a separate topic.
Attention: The version discussed in the report, 9.4, is now outdated. In modern versions of PostgreSQL, the parameter checkpoint_segments has been replaced by the parameters min_wal_size and max_wal_size.
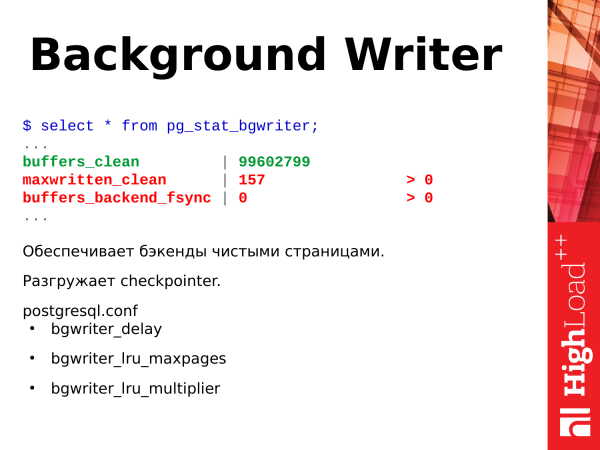
The next subsystem is the background writer — background writer. What does it do? It runs continuously in an infinite loop. It scans the pages in shared buffers and flushes the dirty pages it finds to disk. In this way, it helps the checkpointer do less work during the execution of checkpoints.
What else is it needed for? It ensures the availability of clean pages in shared buffers if they are suddenly required (in large quantities and at once) for data placement. Suppose there is a situation where clean pages are needed to execute a query, and they are already available in shared buffers. PostgreSQL simply takes them and uses them; it doesn't need to clean anything itself. But if there are no such pages, the backend pauses its work and begins searching for pages to flush to disk and retrieve for its needs — which negatively affects the time of the currently executing query. backend If you see that your parameter maxwritten_clean is high, it means that the background writer is not managing its job well and the parameters need to be increased bgwriter_lru_maxpages , so that it can do more work in one cycle and clean more pages.Another very useful metric is
buffers_backend_fsync Backends do not perform fsync because it is slow. They pass fsync up the IO stack to the checkpointer. The checkpointer has its own queue; it periodically processes fsync and synchronizes the pages in memory with the files on disk.. If the checkpointer queue is large and filled, the backend has to perform fsync itself, which slows down its operation, meaning the client will receive a response later than they could have. If you see that this value is greater than zero, it is already a problem and attention should be paid to the settings of the background writer and also assess the performance of the disk subsystem., i.e., the client will receive a response later than they could. If you notice that this value is greater than zero, it indicates a problem. It is necessary to pay attention to the background writer settings and also evaluate the performance of the disk subsystem.
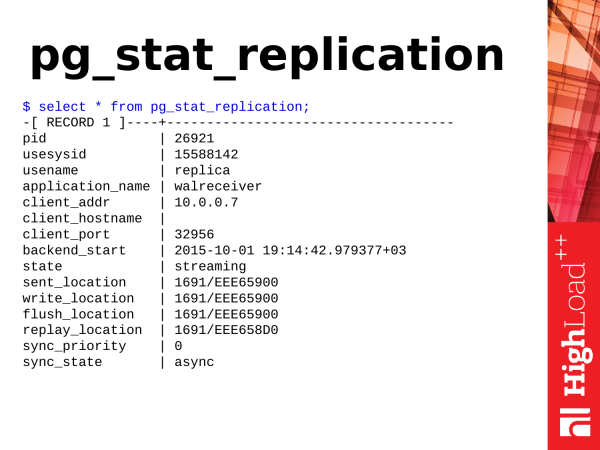
Attention: The following text describes statistical representations related to replication. Most names of views and functions were renamed in Postgres 10. The essence of the renaming was to substitute xlog to wal and location to in the names of functions/views, etc. A specific example is the function pg_xlog_location_diff() which has been renamed to pg_wal_lsn_diff() We have a lot going on here as well. But we only need the points related to location.._
If we see that all values are equal, then this is the ideal case, and the replica is not lagging behind the master.
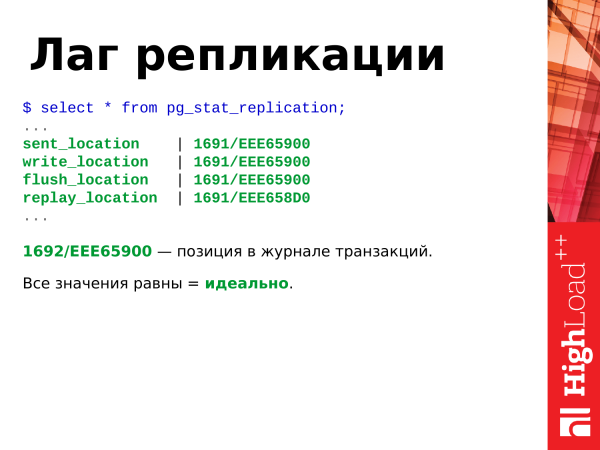
This hexadecimal position indicates the position in the transaction log. It increases continuously if there is any activity in the database: inserts, deletes, etc.
how much xlog is recorded in bytes $ select pg_xlog_location_diff(pg_current_xlog_location(),'0/00000000'); replication lag in bytes $ select client_addr, pg_xlog_location_diff(pg_current_xlog_location(), replay_location) from pg_stat_replication; replication lag in seconds $ select extract(epoch from now() - pg_last_xact_replay_timestamp());
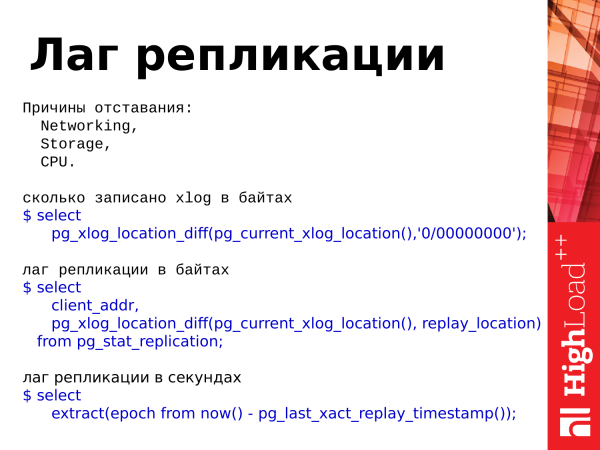
If these things differ, it means there is some lag. Lag is the delay of the replica compared to the master, i.e., the data differs between servers.There are three reasons for lag:
The disk subsystem is failing to handle file synchronization writes.
- There may be network errors or network overloads when data does not arrive at the replica quickly enough, and it cannot replay them.
- And the processor. The processor is a very rare case. I've seen this two or three times, but it can happen.
- And here are three queries that allow us to utilize the statistics. We can assess how much has been recorded in our transaction log. There is a function
pg_xlog_location_diff that allows us to estimate replication lag in bytes and seconds. We also use values from this view for that. Instead of pg_xlog_location
Note: diff() function, you can use the subtraction operator and subtract one location from another. It's convenient.Regarding the lag measured in seconds, there is one point to consider. If there is no activity on the master, and the transaction happened about 15 minutes ago with no activity since, when we check this lag on the replica, we will see a 15-minute lag. It's important to remember this. It can be confusing when you look at this lag.
Regarding the lag measured in seconds, there's an important point. If there has been no activity on the master and the last transaction occurred about 15 minutes ago with no further activity, when we check this lag on the replica, we will see a lag of 15 minutes. This is something to keep in mind, and it can be confusing when you look at this lag.
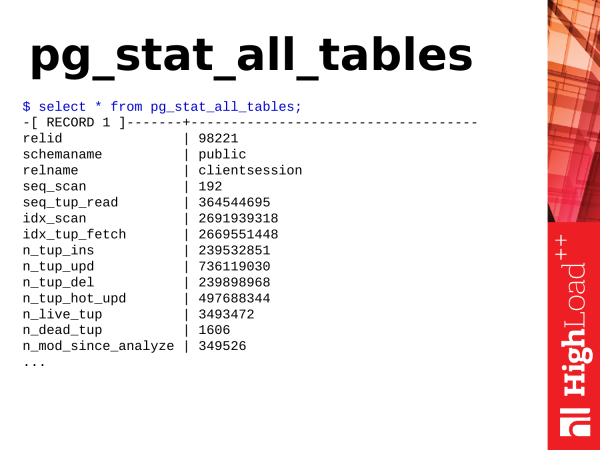
Pg_stat_all_tables is another useful view. It shows statistics for tables. When there is some activity or actions on tables in our database, we can obtain this information from this view.
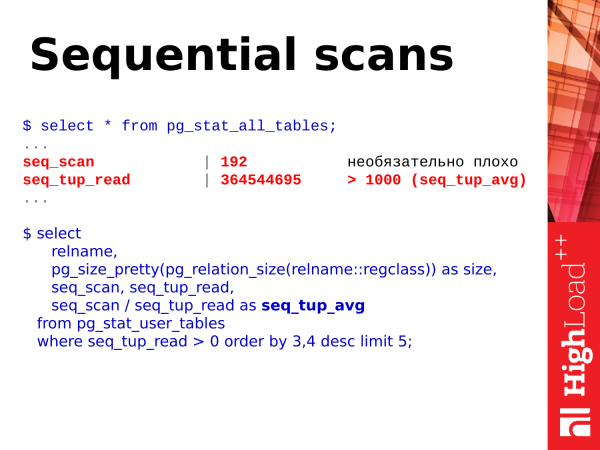
select
relname,
pg_size_pretty(pg_relation_size(relname::regclass)) as size,
seq_scan, seq_tup_read,
seq_scan / seq_tup_read as seq_tup_avg
from pg_stat_user_tables
where seq_tup_read > 0 order by 3, 4 desc limit 5;
The first thing we can look at is the sequential scans of the table. The number itself after these scans is not necessarily bad and does not indicate that we need to take action.
However, there is a second metric – seq_tup_read. This is the number of rows returned as a result of the sequential scan. If the average number exceeds 1,000, 10,000, 50,000, or 100,000, it is already an indication that you may need to create an index somewhere so that accesses are done through the index, or possibly optimize queries that use such sequential scans to avoid this.
A simple example – suppose a query with a large OFFSET and LIMIT is used. For instance, scanning 100,000 rows in a table and then taking 50,000 needed rows, while the previously scanned rows are discarded. This is also a bad case. Such queries need to be optimized. Here is a simple SQL query to examine and evaluate the resulting figures.
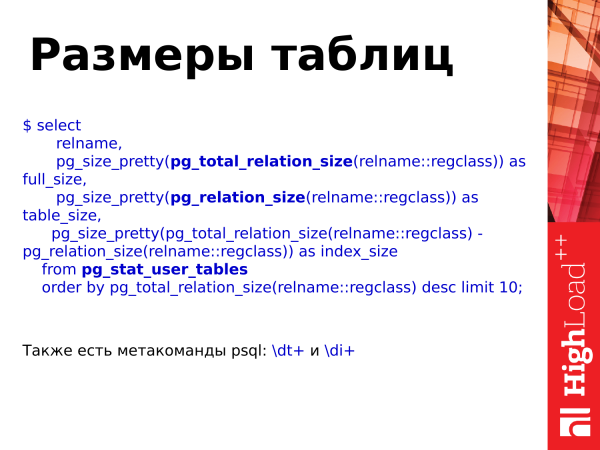
select
relname,
pg_size_pretty(pg_total_relation_size(relname::regclass)) as
full_size,
pg_size_pretty(pg_relation_size(relname::regclass)) as
table_size,
pg_size_pretty(pg_total_relation_size(relname::regclass) -
pg_relation_size(relname::regclass)) as index_size
from pg_stat_user_tables
order by pg_total_relation_size(relname::regclass) desc limit 10;
The sizes of tables can also be obtained using this table and additional functions. pg_total_relation_size(), pg_relation_size().
In general, there are meta-commands dt and di, which can be used in PSQL to also view the sizes of tables and indexes.
However, using functions helps us see the sizes of tables, including the indexes, or excluding the indexes and already making assessments based on database growth, i.e., how it is growing, with what intensity, and making conclusions about optimizing sizes.
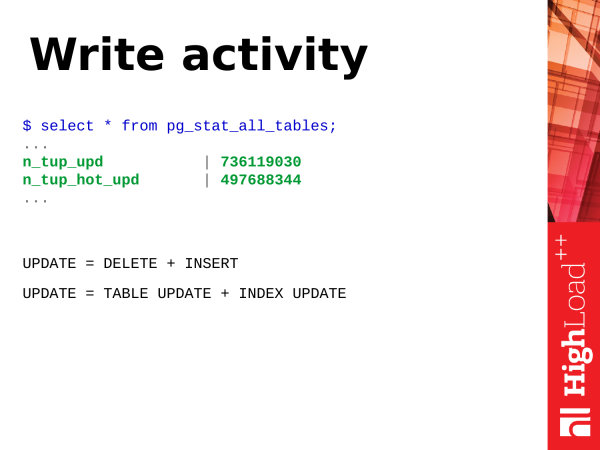
Activity for writing. What is a write? Let's consider the operation UPDATE – updating rows in a table. Essentially, an update involves two operations (or even more). This includes inserting a new version of the row and marking the old version of the row as outdated. Later, an autovacuum process will come and clean up these outdated versions of the rows, marking that space as available for reuse.
Moreover, an update is not just about updating the table. It also involves updating the indexes. If there are many indexes on the table, then during an update, all the indexes that include the fields being updated in the query will also need to be updated. These indexes will also contain outdated versions of the rows that need to be cleared.
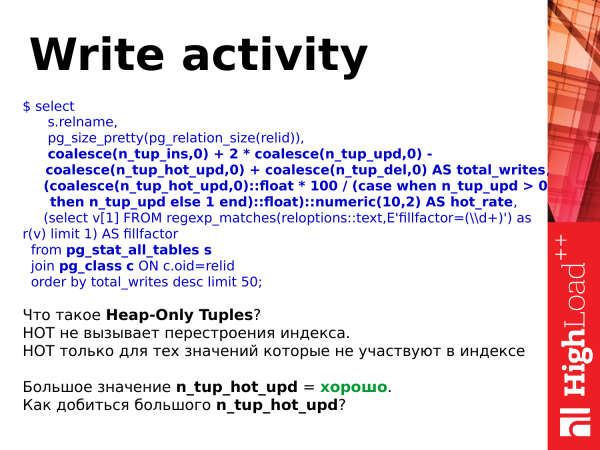
select
s.relname,
pg_size_pretty(pg_relation_size(relid)),
coalesce(n_tup_ins,0) + 2 * coalesce(n_tup_upd,0) -
coalesce(n_tup_hot_upd,0) + coalesce(n_tup_del,0) AS total_writes,
(coalesce(n_tup_hot_upd,0)::float * 100 / (case when n_tup_upd > 0
then n_tup_upd else 1 end)::float)::numeric(10,2) AS hot_rate,
(select v[1] FROM regexp_matches(reloptions::text,E'fillfactor=(\d+)') as
r(v) limit 1) AS fillfactor
from pg_stat_all_tables s
join pg_class c ON c.oid=relid
order by total_writes desc limit 50;
And due to its design, UPDATE is a heavyweight operation. However, it can be made lighter. There are hot updates. They were introduced in PostgreSQL version 8.3. So what are they? They are lightweight updates that do not cause index rebuilding. That is, we've updated a record, but only the record on the page (which belongs to the table) has been updated, while the indexes still point to the same record on the page. There is a rather interesting logic here, when the vacuum comes, it rebuilds these chains hot and everything continues to work without index updates, with less resource consumption.
And when you have n_tup_hot_upd large, that is very good. This means that lightweight updates prevail, which results in lower resource usage and everything works fine.
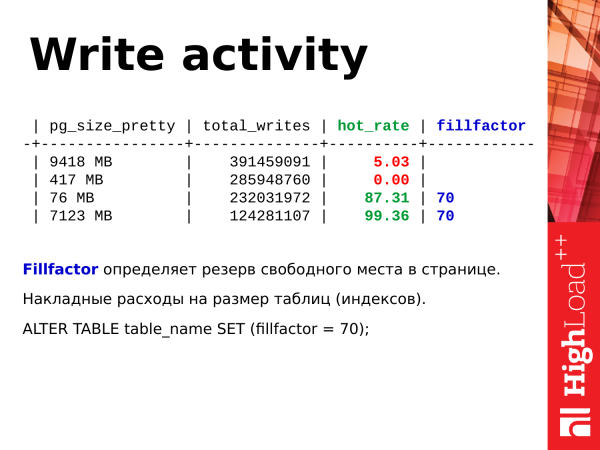
ALTER TABLE table_name SET (fillfactor = 70);How to increase the volume of hot updates?We can use fillfactor. It determines the amount of reserved free space when filling a page in the table with INSERTs. When inserts go into the table, they completely fill the page, leaving no empty space within it. Then a new page is allocated. Again, data is filled. And this behavior is default, with a fillfactor of 100%.
We can set the fill factor to 70%. That is, when inserts occur, a new page is allocated, but only 70% of that page is filled. This leaves 30% as a reserve. When an update needs to happen, it will most likely occur on the same page, and the new version of the row will be placed on that page. A hot update will be performed. This simplifies writes on tables.
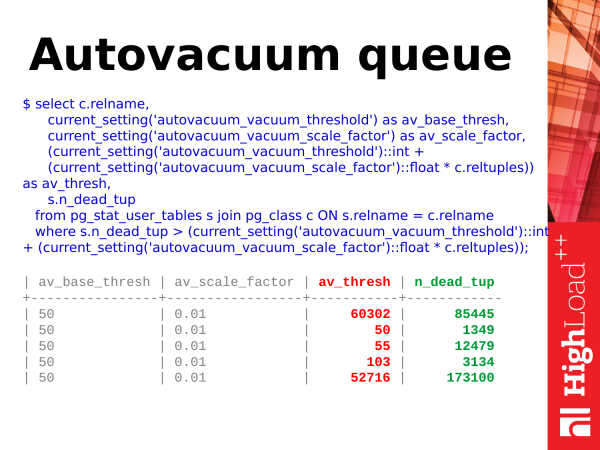
select c.relname,
current_setting('autovacuum_vacuum_threshold') as av_base_thresh,
current_setting('autovacuum_vacuum_scale_factor') as av_scale_factor,
(current_setting('autovacuum_vacuum_threshold')::int +
(current_setting('autovacuum_vacuum_scale_factor')::float * c.reltuples))
as av_thresh,
s.n_dead_tup
from pg_stat_user_tables s join pg_class c ON s.relname = c.relname
where s.n_dead_tup > (current_setting('autovacuum_vacuum_threshold')::int
+ (current_setting('autovacuum_vacuum_scale_factor')::float * c.reltuples));
Autovacuum queue. Autovacuum is such a subsystem about which there is very little statistics in PostgreSQL. We can only see in pg_stat_activity how many vacuums are currently running. However, it is very difficult to understand how many tables are in its queue at once.
Note: _Starting from Postgres version 10, the situation with tracking vacuums has significantly improved — the pg_stat_progress vacuum view has appeared, which simplifies monitoring autovacuum.We can use a simplified query like this. We can see when a vacuum should take place. But how and when should the vacuum start? These are the obsolete versions of rows I mentioned earlier. An update happened, a new version of the row was inserted. An obsolete version of the row appeared in the table.
There is a parameter in the table called pg_stat_user_tables n_dead_tup . It shows the number of "dead" rows. As soon as the number of dead rows exceeds a certain threshold, an autovacuum will be triggered on the table.And how is this threshold calculated? It is a specific percentage of the total number of rows in the table. There is a parameter called
autovacuum_vacuum_scale_factor . It defines this percentage. For example, 10% plus an additional baseline threshold of 50 rows. So what happens? When the number of dead rows exceeds "10% + 50" of all rows in the table, we enable autovacuum for the table.However, there's one point to note. The baseline thresholds for the parameters
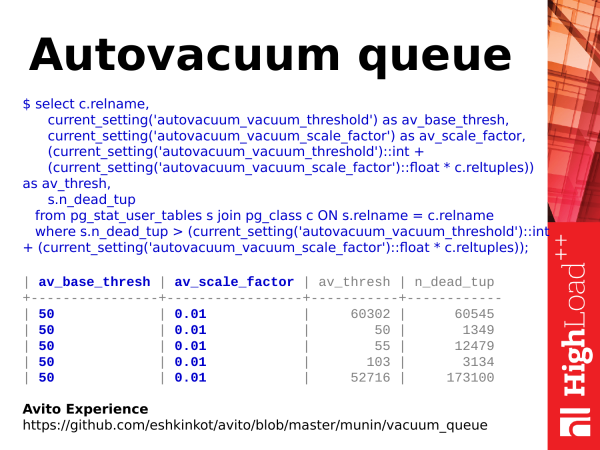
select c.relname,
current_setting('autovacuum_vacuum_threshold') as av_base_thresh,
current_setting('autovacuum_vacuum_scale_factor') as av_scale_factor,
(current_setting('autovacuum_vacuum_threshold')::int +
(current_setting('autovacuum_vacuum_scale_factor')::float * c.reltuples))
as av_thresh,
s.n_dead_tup
from pg_stat_user_tables s join pg_class c ON s.relname = c.relname
where s.n_dead_tup > (current_setting('autovacuum_vacuum_threshold')::int
+ (current_setting('autovacuum_vacuum_scale_factor')::float * c.reltuples));
av_base_thresh and and av_scale_factor can be assigned individually. Therefore, the threshold will not be global but rather specific to the table. To calculate this, one needs to use tricks and clever methods. If you are interested, you can look at the experience of our colleagues from Avito (the link on the slide is invalid and has been updated in the text).
They wrote for , which takes these factors into account. It's a lengthy document spanning two pages. However, it calculates correctly and efficiently allows us to assess where we have excess vacuum requirements for tables and where we have little.
What can we do about this? If we have a large queue and the auto-vacuum is not coping, we can increase the number of vacuum workers, or simply make the vacuum more aggressive, so that it triggers earlier, processing the table in smaller chunks. This will reduce the queue. — The main thing here is to monitor the load on the disks, as vacuuming is not free; however, with the advent of SSD/NVMe devices, this problem has become less noticeable.
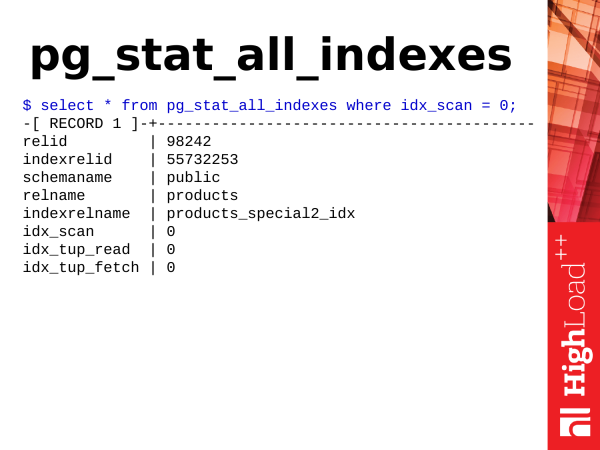
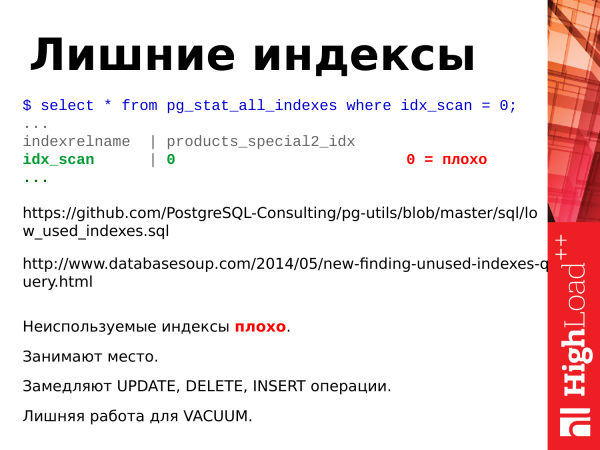
Pg_stat_all_indexes is the statistics for indices. It's small. We can use it to obtain information about index usage and, for example, determine which indices are redundant.
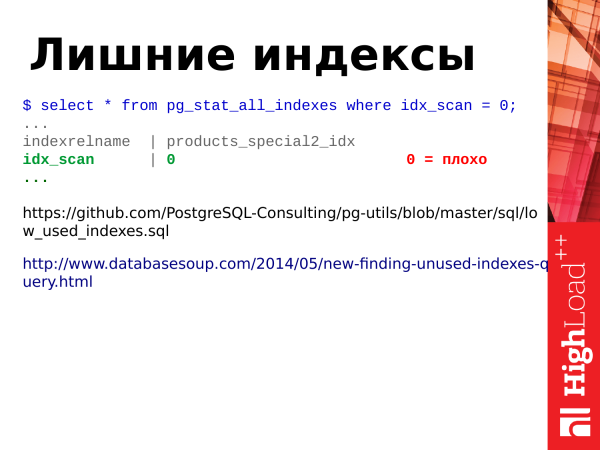
As I mentioned earlier, update is not just about table updates, but also about updating indices. Accordingly, if we have many indices on a table, when updating rows in the table, the indexed fields' indices also need to be updated, and if we have unused indices with no index scans, they become a burden. We need to get rid of them. For this, we need the field idx_scan. We simply look at the number of index scans. If indices have zero scans over a relatively long period of statistics retention (at least 2-3 weeks), then they are likely poor indices and we need to eliminate them.
Note: When searching for unused indices in the case of streaming replication clusters, it is necessary to check all nodes in the cluster, as the statistics are not global. If an index is unused on the master, it may still be used on replicas (if there is load there).
Two links:
These are more advanced examples of queries to find unused indices.
The second link is quite an interesting query. There is a non-trivial logic behind it. I recommend reviewing it.
What else should we summarize about indexes?
Unused indexes are detrimental.
They take up space.
They slow down update operations.
They create unnecessary work for the vacuum.
If we remove unused indexes, we will only improve the database.
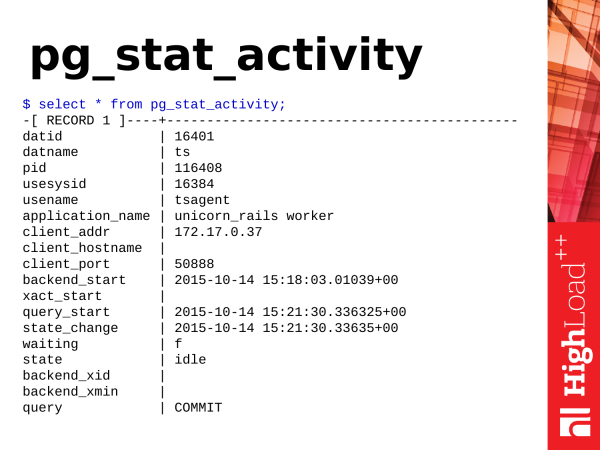
The next representation is pg_stat_activity. This is analogous to the utility ps, but in PostgreSQL. If psyou are monitoring processes in the operating system, then pg_stat_activity it will show you the activity within PostgreSQL.
What useful information can we gather from there?
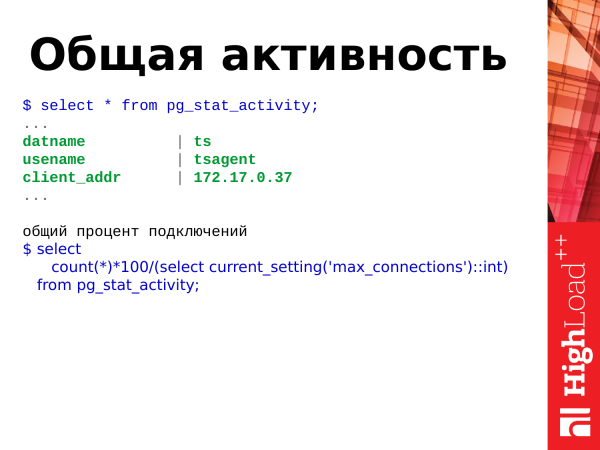
select
count(*)*100/(select current_setting('max_connections')::int)
from pg_stat_activity;
We can view the overall activity, what is happening in the database. We can make a new deployment. Everything has exploded, new connections are not being accepted, errors are pouring into the application.
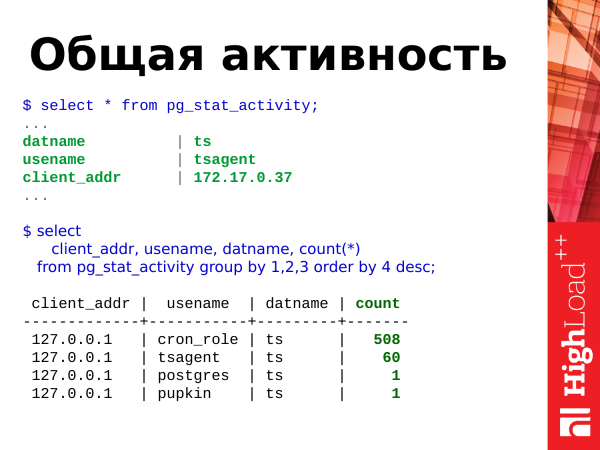
select
client_addr, usename, datname, count(*),
from pg_stat_activity group by 1,2,3 order by 4 desc;
We can execute this query and check the overall percentage of connections relative to the maximum connection limit and see who is occupying the most connections. In this example, we see that user cron_role has opened 508 connections. Something happened with them. We need to investigate and see. It's quite possible that this is an anomalous number of connections.
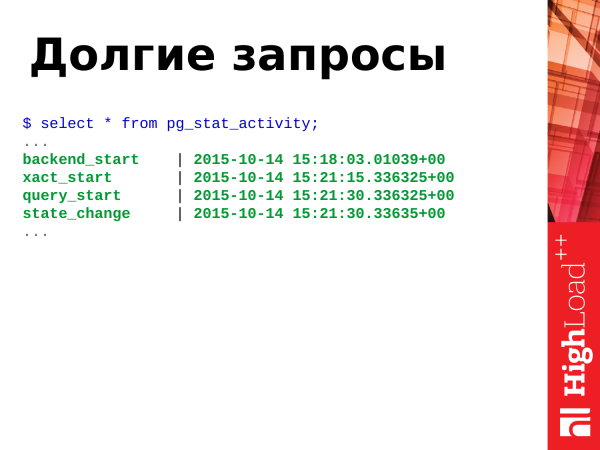
If we have an OLTP load, queries should be executed quickly, very quickly, and there should be no long-running queries. However, if long queries occur, it’s not a big deal in the short term, but in the long term, long queries harm the database, they increase the bloat effect of tables when table fragmentation occurs. Both bloat and long queries need to be eliminated.
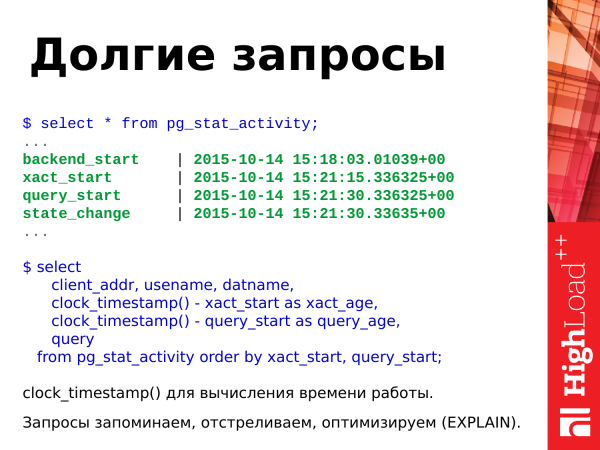
select
client_addr, usename, datname,
clock_timestamp() - xact_start as xact_age,
clock_timestamp() - query_start as query_age,
query
from pg_stat_activity order by xact_start, query_start;
Note: with this query we can identify long queries and transactions. We use the function clock_timestamp() to determine the time duration. The long queries we found can be remembered, executed explain, view the plans and optimize them somehow. We kill the current long-running queries and move on.
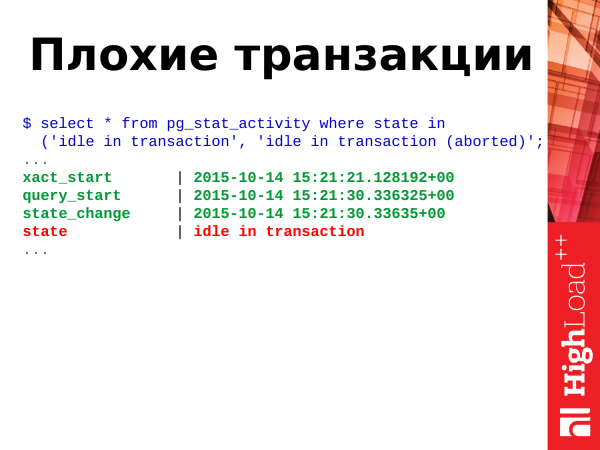
select * from pg_stat_activity where state in
('idle in transaction', 'idle in transaction (aborted)';
Bad transactions are those in the state of idle in transaction and idle in transaction (aborted).
What does it mean? Transactions can have several states, and one of these states can change at any moment. To determine the states, there is a field state in this view. We use it to ascertain the state.
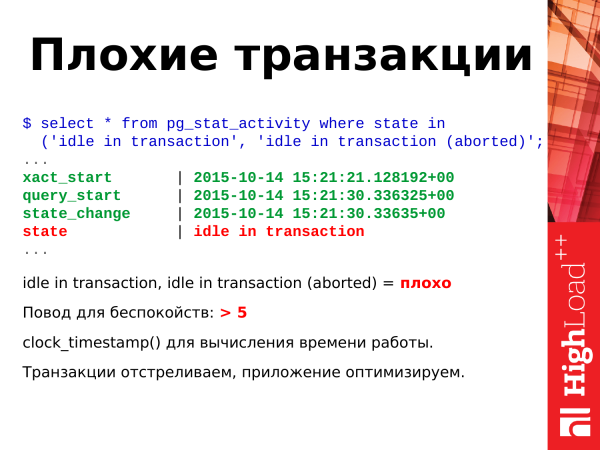
select * from pg_stat_activity where state in
('idle in transaction', 'idle in transaction (aborted)';
And, as I mentioned earlier, these two states idle in transaction and idle in transaction (aborted) – are problematic. What does this mean? This happens when an application opens a transaction, performs some actions, and then goes about its business. The transaction remains open, hanging with nothing happening; it occupies a connection, locks modified rows, and potentially increases the bloat of other tables due to the architecture of PostgreSQL's transaction engine. Such transactions should also be terminated because they are detrimental in any scenario.
If you see more than 5-10-20 of them in your database, you should be concerned and begin to address the issue.
Here we also use clock_timestamp()for runtime calculation. We terminate transactions and optimize the application.
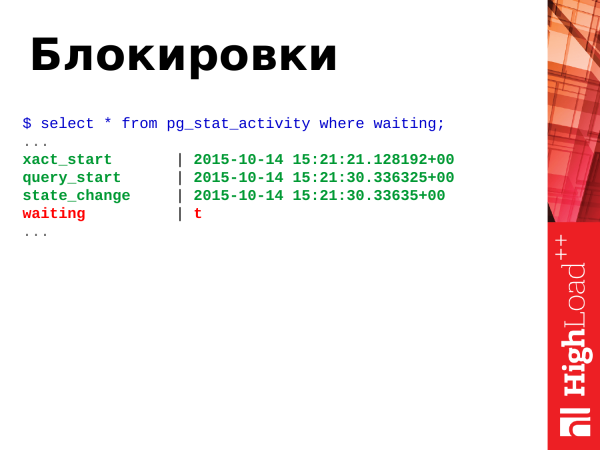
As I mentioned before, locks occur when two or more transactions compete for one or a group of resources. For this, we have the field waiting with a boolean value true or false.
True – this indicates that the process is waiting, and action is needed. When a process is in a waiting state, it means that the client that initiated this process is also waiting. The client in the browser is sitting and waiting as well.
Attention: _Starting from PostgreSQL version 9.6, the field waiting has been removed and replaced with two more informative fields wait_event_type and wait_event._
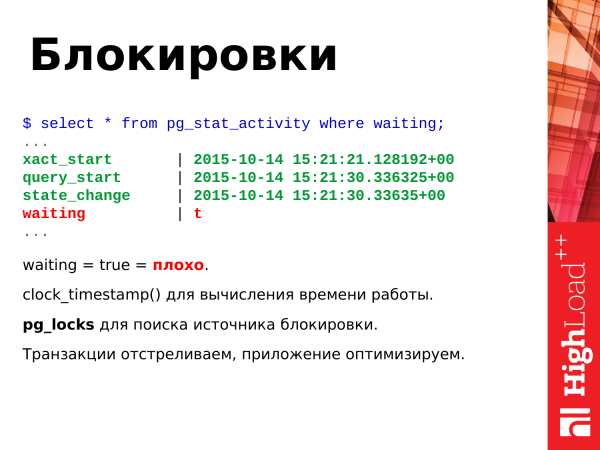
What to do? If you see true for an extended period, it means that such requests should be eliminated. We simply terminate such transactions. We inform developers that optimization is needed to avoid resource contention. Then developers optimize the application to prevent this from occurring.
And a final, but potentially non-fatal case is the occurrence of deadlocks. Two transactions update two resources and then try to access them again, this time the opposite resources. PostgreSQL automatically terminates one of the transactions so that the other can continue working. This is a deadlock situation that does not resolve itself. Therefore, PostgreSQL is forced to take drastic measures.
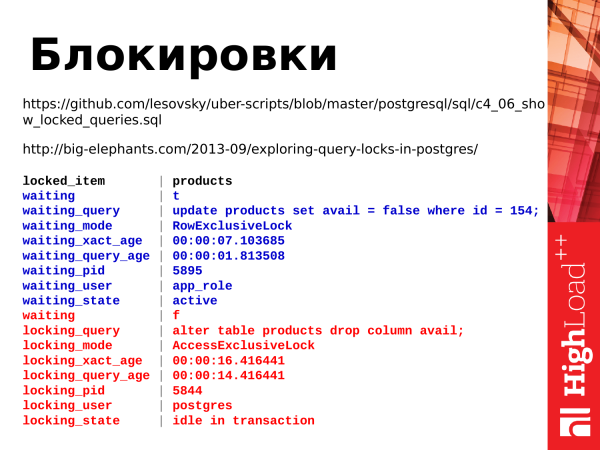
Here are two queries that allow monitoring of locks. We use the view pg_locks, which allows tracking heavyweight locks.
And the first link is the text of the query itself. It's quite long.
And the second link is an article about locks. It’s worth reading, it's really interesting.
So, what do we see? We see two queries. A transaction with ALTER TABLE – is a blocking transaction. It started, but hasn’t finished, and the application that initiated this transaction is occupied with something else. The second query is an update. It’s waiting for the alter table to finish in order to continue its work.
This way, we can find out who locked whom, hold up, and we can deal with this further.
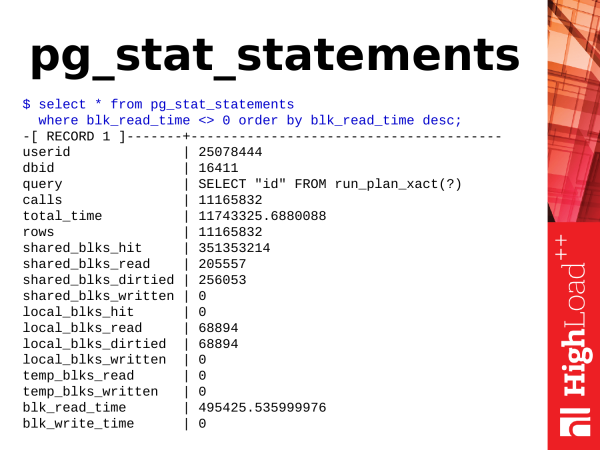
The next module is pg_stat_statements. As I said, this is a module. To use it, you need to load its library into the configuration, restart PostgreSQL, and install the module (with a single command), and then we’ll have a new view.
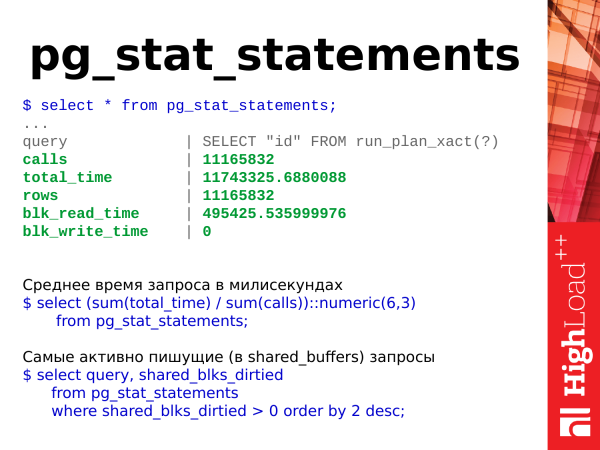
Average query time in milliseconds
$ select (sum(total_time) / sum(calls))::numeric(6,3)
from pg_stat_statements;

Most active writing (in shared_buffers) queries
$ select query, shared_blks_dirtied
from pg_stat_statements
where shared_blks_dirtied > 0 order by 2 desc;
What can we take from there? Speaking about simple things, we can take the average execution time of a query. If the time increases, it means our PostgreSQL is responding slowly and we need to take some action.
We can look at the most active writing transactions in the database that change data in shared buffers. See who is updating or deleting data.
And we can simply look at various statistics for these queries.
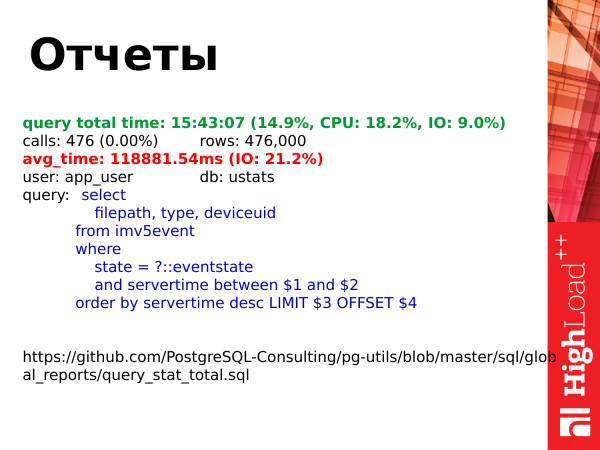
We pg_stat_statements we use for building reports. We reset the statistics once a day. We accumulate it. Before the next statistics reset, we build a report. Here’s the link to the report. You can view it.
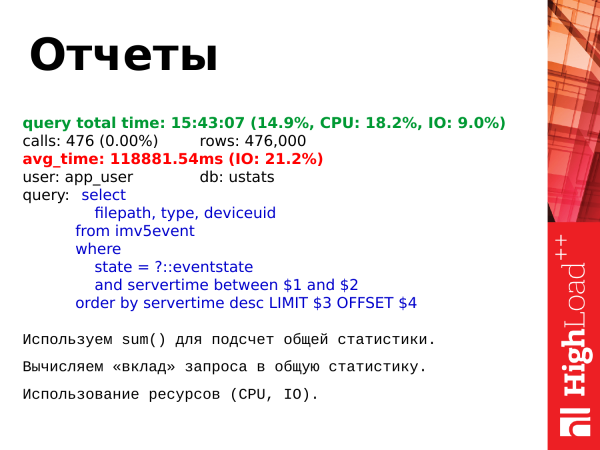
What do we do? We calculate the total statistics for all queries. Then, for each query, we determine its individual contribution to this overall statistic.
And what can we look at? We can see the total execution time of all queries of a specific type against all other queries. We can observe the resource usage of CPU and I/O relative to the overall picture. And then optimize these queries. We build a top query list based on this report and gain insights on what to optimize.
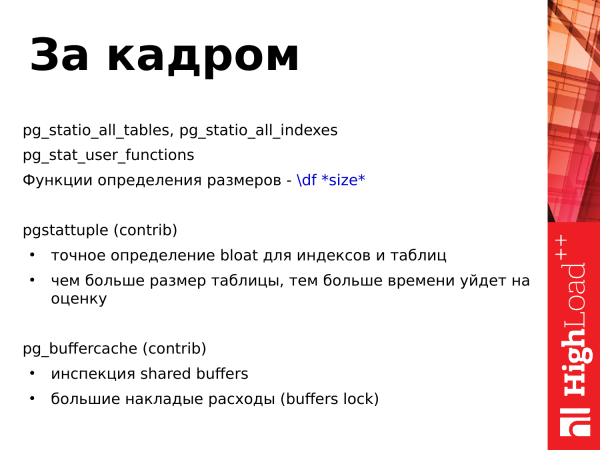
What have we left behind the scenes? There are still a few presentations that I did not cover because time is limited.
There is pgstattuple – this is also an additional module from the standard contribs package. It allows you to evaluate bloat tables, i.e., table fragmentation. And if the fragmentation is large, it needs to be fixed using various tools. And the function pgstattuple takes a long time to process. The more tables there are, the longer it will take.
The next contrib is pg_buffercache. It allows for inspection of shared buffers: how intensely and for which tables pages are utilized. It simply allows you to peek into shared buffers and assess what's happening there.
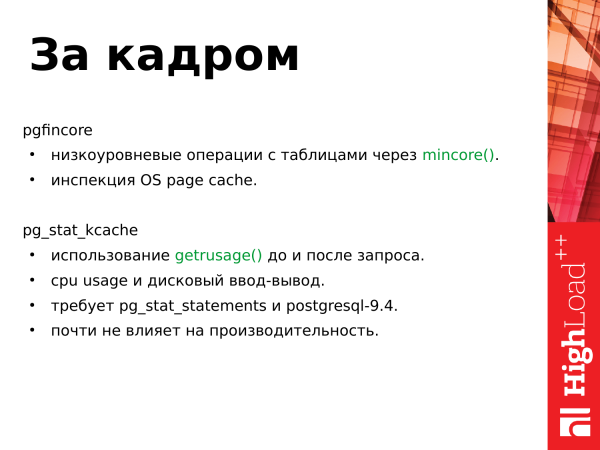
The next module is pgfincore. It allows for low-level operations with tables via the system call mincore(), meaning it can load a table into shared buffers or unload it. It also allows for inspection of the operating system's page cache, i.e., how much space our table occupies in the page cache, in shared buffers, and gives insight into the table's load.
The next module is pg_stat_kcache. It also uses the system call getrusage(). It executes this before and after a request is processed. The resulting statistics allow you to evaluate how much disk I/O time the request consumed, i.e., operations with the file system, and examines CPU usage. However, this module is relatively new (ahem) and requires PostgreSQL 9.4 and pg_stat_statements, which I mentioned earlier.
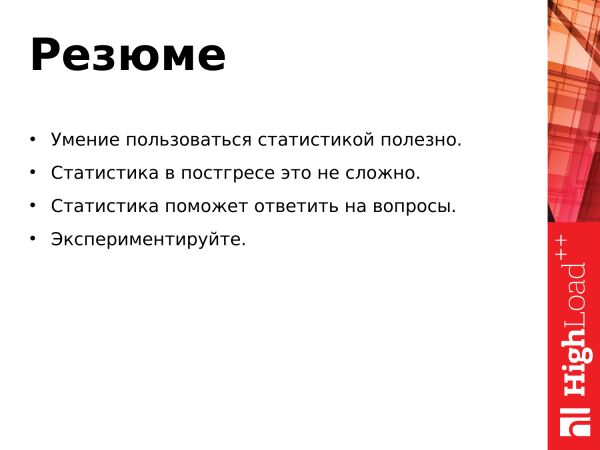
Being able to use statistics is beneficial. You don't need third-party applications. You can look for yourself, see, do something, execute.
Using statistics is straightforward; it's just standard SQL. You construct a query, send it, and review the results.
Statistics help answer questions. If you have questions, you refer to the statistics – look, draw conclusions, analyze the results.
And experiment. There are many queries and a lot of data. You can always optimize an existing query. You can create your own version of a query that works better for you than the original and use it.
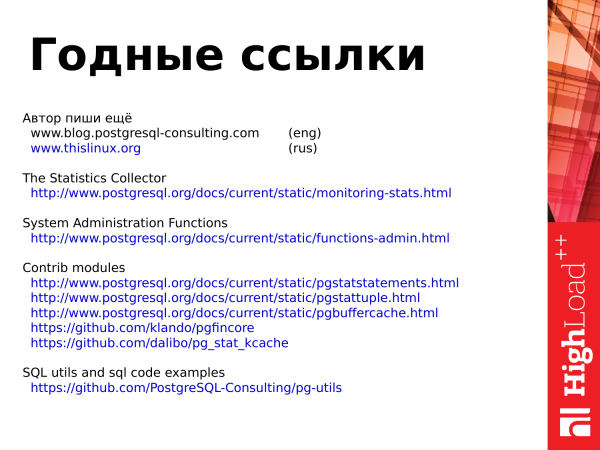
Links
Useful links mentioned in the article that were referenced in the presentation.
The author writes more
(eng)
The Statistics Collector
System Administration Functions
Contrib modules
SQL utils and sql code examples
Thank you all for your attention!
Source: habr.com
