

Today, most software products are developed in teams. The conditions for successful team development can be represented as a simple scheme.
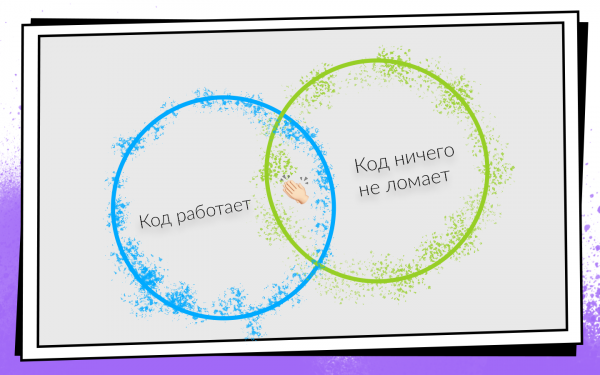
After writing code, you must ensure that it:
- Works.
- Does not break anything, including the code written by your colleagues.
If both conditions are met, you are on the path to success. To easily check these conditions and stay on the profitable path, Continuous Integration was developed.
CI is a workflow where you integrate your code into the main product code as often as possible. And not just integrate, but also constantly check that everything works. Since checking needs to be done frequently, it’s worth considering automation. You could check everything manually, but you shouldn't, and here’s why.
- People are expensive. An hour of any programmer's work costs more than an hour of any server's work.
- People make mistakes. Therefore, situations may arise where tests are run on the wrong branch or an incorrect commit is assembled for testers.
- People get lazy. Occasionally, when I finish a task, I find myself thinking: 'What’s there to check? I wrote two lines—surely everything works!' I believe some of you have similar thoughts occasionally. But checking is always necessary.
How Continuous Integration was implemented and developed in the Avito mobile development team, how they progressed from 0 to 450 builds per day, and what build machines collect 200 hours a day, is narrated by Nikolai Nesterov () — a participant in all evolutionary changes of the CI/CD Android application.
The story is based on the example of the Android team, but most approaches are applicable to iOS as well.

Once upon a time, there was one person in the Avito Android team. By definition, he didn’t need anything from Continuous Integration: there was no one to integrate with.
But the application grew, more and more new tasks appeared, and accordingly, the team grew. At some point, it was time to formalize the code integration process more rigorously. It was decided to use Git flow.
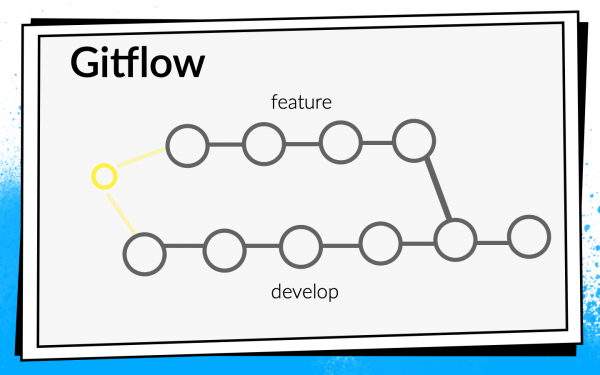
The Git flow concept is well-known: there is one main branch called develop in the project, and for each new feature, developers create a separate branch, commit to it, push, and when they want to merge their code into the develop branch, they open a pull request. To share knowledge and discuss approaches, we introduced code reviews, meaning colleagues must review and approve each other's code.
Checks
Viewing the code through others' eyes is great, but not enough. Therefore, automated checks are introduced.
- First, we check the ARC build.
- A lot of Junit tests.
- We calculate code coverage, since we are running tests.
To understand how to run these checks, let's look at the development process at Avito.
It can be schematically represented as follows:
- The developer writes code on their laptop. They can run integration checks right here — either with a commit hook or simply run checks in the background.
- After the developer pushes the code, they open a pull request. For their code to enter the develop branch, it must pass code review and gather the required number of approvals. Checks and builds can be enabled here: until all builds are successful, the pull request cannot be merged.
- Once the pull request is merged and the code is in develop, a convenient time can be chosen: for example, at night when all servers are free, and we can run checks as much as needed.
Running checks on their laptop was not liked by anyone. When a developer completes a feature, they want to push it quickly and open a pull request. If long checks are running at that moment, it's not only unpleasant but also slows down development: while the laptop is checking something, it’s impossible to work normally.
Running checks at night was very appealing to us because there’s plenty of time and servers available to go all out. But unfortunately, once the feature code hits develop, the developer has much less motivation to fix the errors found by CI. I often caught myself thinking, while looking at all the errors found in the morning report, that I would fix them sometime later because right now there’s an exciting new task in Jira that I can't wait to start working on.
If checks block the pull request, there’s enough motivation because until the builds turn green, the code won't make it to develop, and thus, the task will not be completed.
As a result, we opted for this strategy: at night we run the maximum possible set of checks, and the most critical and, importantly, fast ones are launched on pull request. But we don't stop there — we are also optimizing the speed of the checks to move them from night mode to pull request checks.
At that time, all our builds were passing quite quickly, so we simply included ARC builds, Junit tests, and code coverage calculation as a blocker for pull requests. We included it, thought about it — and then discarded code coverage because we believed it was unnecessary.
It took us two days to set up the basic CI (here and later the time estimate is approximate, needed for context).
After that, we started thinking further — are we checking correctly? Are we correctly running builds on pull requests?
We ran builds on the latest commit of the branch from which the pull request is opened. But the checks of that commit can only show that the code written by the developer works. They do not prove that nothing is broken. In fact, we need to check the state of the develop branch after the feature has been merged into it.
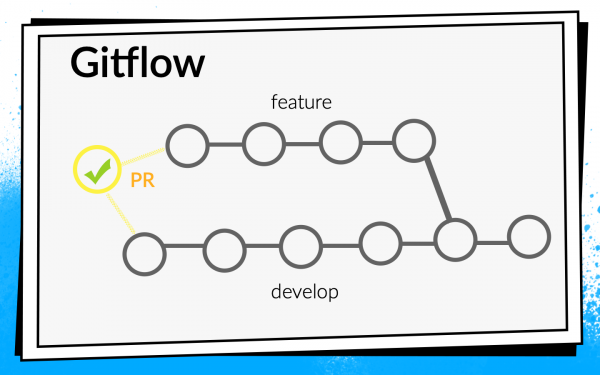
For this purpose, we wrote a simple bash script premerge.sh:
#!/usr/bin/env bash

set -e

git fetch origin develop

git merge origin/develop
This script simply pulls the latest changes from develop and merges them into the current branch. We added the premerge.sh script as the first step of all builds and started checking exactly what we want, which is integration.
It took three days to localize the problems, find a solution, and write this script.
The application was evolving, more tasks were appearing, the team was growing, and premerge.sh sometimes started letting us down. Conflicting changes crept into develop, breaking the build.
An example of how this happens:
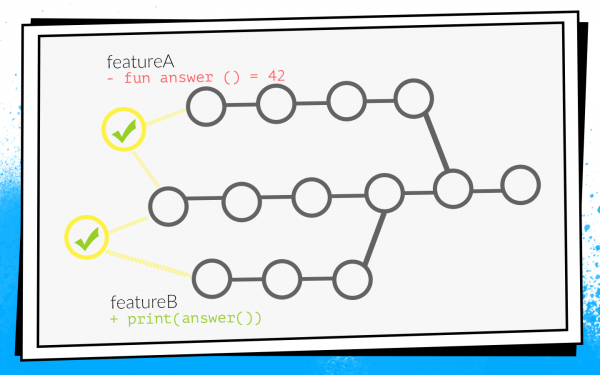
Two developers simultaneously start working on features A and B. The developer of feature A discovers an unused function in the project answer() and, like a good scout, removes it. Meanwhile, the developer of feature B adds a new call to this function in their branch.
The developers finish their work and simultaneously open pull requests. Builds are launched, premerge.sh checks both pull requests against the fresh state of develop — all checks are green. After that, feature A's pull request gets merged, followed by feature B's pull request… Boom! Develop breaks because there's a call to a non-existent function in the develop code.
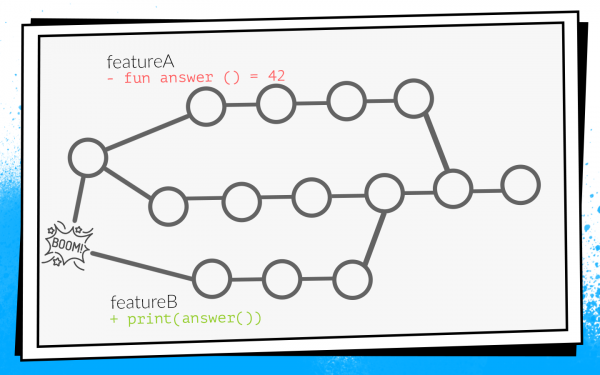
When develop doesn't build, this local disaster. The entire team is unable to assemble and deliver for testing.
It so happened that I often dealt with infrastructure tasks: analytics, networks, databases. That is, I wrote the functions and classes that other developers use. Because of this, I found myself in similar situations quite frequently. At one point, I even had this image hanging around.
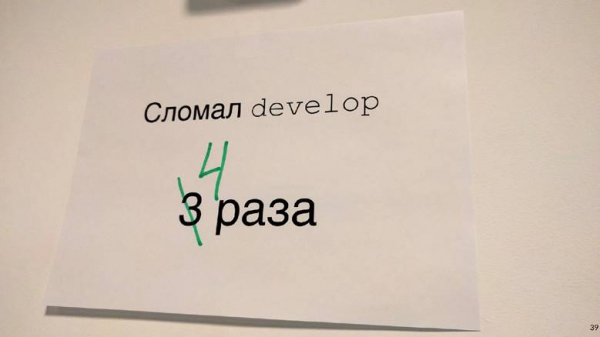
Since this was not acceptable to us, we started exploring options to prevent it.
How to avoid breaking develop
First option: rebuilding all pull requests when updating develop. In our example, if pull request A is merged into develop first, pull request B will need to be rebuilt, and consequently, the checks will fail due to a compilation error.
To understand how much time this will take, let's consider an example with two PRs. We open two PRs: two builds, two runs of checks. After the first PR is merged into develop, the second one needs to be rebuilt. In total, for two PRs, three runs of checks are needed: 2 + 1 = 3.
In principle, that's fine. But we looked at the statistics, and a typical situation in our team was having 10 open PRs, and then the number of checks would be the sum of the progression: 10 + 9 + … + 1 = 55. So, to accept 10 PRs, you would need to rebuild 55 times. And that's in an ideal situation, where all checks pass on the first attempt, and no one opens an additional pull request while processing this batch.
Imagine being a developer who needs to hit the 'merge' button first, because if your neighbor does it, you'll have to wait for all builds to run again… No way, this would seriously slow down development.
Second possible way: to build pull requests after code review. That is, you open a pull request, gather the required approvals from colleagues, fix any issues, and then run the builds. If they are successful, the pull request is merged into develop. In this case, there are no additional restarts, but feedback is significantly delayed. As a developer, when I open a pull request, I want to see immediately whether it builds successfully. For example, if a test fails, it needs to be fixed quickly. In the case of delayed builds, feedback slows down, and thus the entire development process. This was also not acceptable to us.
In the end, only the third option remained — reinventing the wheelAll our code, all our source files are stored in a Bitbucket server repository. Consequently, we had to develop a plugin for Bitbucket.
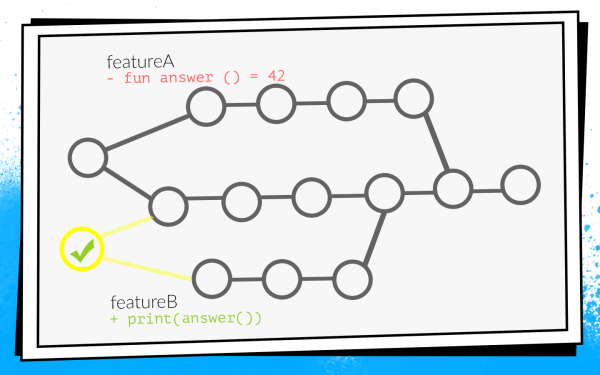
This plugin overrides the merge mechanism for pull requests. It begins as standard: a PR is opened, all builds are triggered, and code review is conducted. But after the code review is passed and the developer decides to hit 'merge', the plugin checks the state of develop against which the checks were run. If develop has been updated since the builds, the plugin will not allow such a pull request to be merged into the main branch. It will simply re-trigger the builds against the updated develop.
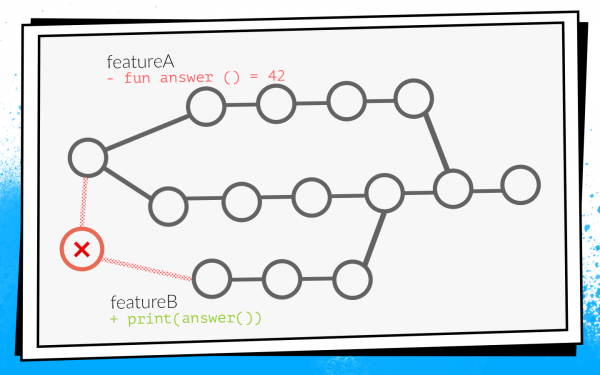
In our example with conflicting changes, such builds will fail due to a compilation error. Consequently, the developer of feature B will have to fix the code and restart the checks, at which point the plugin will automatically apply the pull request.
Before implementing this plugin, we averaged 2.7 checks launched for each pull request. With the plugin, it became 3.6 checks. We were satisfied with this.
It is worth noting that this plugin has a drawback: it only re-triggers the build once. This means there remains a small window during which conflicting changes can still enter develop. However, the likelihood of this is low, and we accepted this compromise between the number of runs and the chance of a failure. It has only occurred once in two years, so perhaps it was worth it.
It took us two weeks to write the first version of the Bitbucket plugin.
New checks
In the meantime, our team continued to grow. New checks were added.
We thought: why fix errors if we can prevent them? So we implemented static code analysis. We started with lint, which is part of the Android SDK. But at that time, it could not handle Kotlin code at all, while 75% of our application was already written in Kotlin. Therefore, we added integrated Android Studio checks.
To achieve this, we had to get creative: we took Android Studio, packaged it in Docker, and ran it on CI with a virtual monitor to make it think it was running on a real laptop. But it worked.
Also, during this time, we began writing many instrumentation tests and implemented screenshot testing.This is when a reference screenshot is generated for a separate small view, and the test involves taking a screenshot from the view and comparing it pixel by pixel with the reference. If there’s a discrepancy, it means something has gone wrong with the layout or there’s an issue in the styles.
However, instrumentation tests and screenshot tests need to be run on devices: on emulators or on real devices. Given that there are many tests and they are run frequently, a whole farm is needed. Setting up our own farm is too labor-intensive, so we found a ready-made option — Firebase Test Lab.
Firebase Test Lab
It was chosen because Firebase is a Google product, which means it should be reliable and unlikely to ever go away. The prices are affordable: $5 per hour for real device usage, $1 per hour for emulator usage.
Implementing Firebase Test Lab into our CI took about three weeks.
But the team continued to grow, and Firebase unfortunately started to let us down. At that time, it had no SLA. Sometimes Firebase made us wait until a sufficient number of devices were free for tests instead of starting them immediately as we wanted. Waiting in the queue took up to half an hour, which is very long. Instrumentation tests were run on every PR, and these delays significantly slowed down development, and then we received a billing statement for the month with a hefty amount. In general, we decided to abandon Firebase and build an in-house solution since the team had grown enough.
Docker + Python + bash
We took Docker, packed emulators into it, and wrote a simple program in Python that raises the necessary number of emulators in the required version at the right moment and stops them when needed. And of course, a couple of bash scripts — where would we be without them?
It took five weeks to create our own testing environment.
As a result, each pull request had a comprehensive, merge-blocking list of checks:
- ARK build;
- Junit tests;
- Lint;
- Android Studio checks;
- Instrumentation tests;
- Screenshot tests.
This prevented many potential failures. Technically, everything worked, but developers complained that waiting for results took too long.
Too long — how long is that? We exported data from Bitbucket and TeamCity into an analysis system and understood that the average waiting time is 45 minutes.That is, a developer, upon opening a pull request, waits on average 45 minutes for build results. In my opinion, that’s too much, and we cannot work like that.
Of course, we decided to speed up all our builds.
Accelerating
Seeing that builds often queued up, our first step was to purchase additional hardware — extensive development is the easiest option. The builds stopped queuing, but the wait time decreased only slightly, as some checks themselves took a very long time.
Removing excessively long checks
Our Continuous Integration could catch these types of errors and issues.
- Does not compile. CI can catch a compilation error when conflicting changes prevent something from compiling. As I mentioned, at that point, no one can compile anything, development halts, and everyone gets nervous.
- Bug in behavior. For example, when the application compiles, but it crashes when a button is pressed, or the button doesn't respond at all. This is bad because such a bug can reach the user.
- Bug in layout. For instance, the button responds, but it's shifted 10 pixels to the left.
- Increase in technical debt.
Looking at this list, we realized that only the first two items are critical. We aim to catch such problems first. Layout bugs are detected during the design review stage and are easily fixed then. Addressing technical debt requires a separate process and planning, so we decided not to check it during pull requests.
Based on this classification, we went through the entire checklist. Crossed out Lint and moved its execution to overnight: just to report how many issues are in the project. We agreed to work separately on technical debt, and completely abandoned Android Studio checks. Running inspections in Android Studio via Docker sounds interesting but causes many issues with support. Any update to Android Studio versions turns into a battle with obscure bugs. It was equally challenging to maintain screenshot tests, as the library was not very stable, leading to false positives. Screenshot tests were removed from the checklist.
In the end, we were left with:
- ARK build;
- Junit tests;
- Instrumentation tests.
Gradle remote cache
Without heavy checks, everything improved. But there’s no limit to perfection!
Our application was already divided into approximately 150 Gradle modules. Usually, in such cases, Gradle remote cache works well, and we decided to give it a try.
Gradle remote cache is a service that can cache build artifacts for individual tasks in separate modules. Instead of actually compiling the code, Gradle queries the remote cache over HTTP to check if anyone has already run that task. If so, it simply downloads the result.
Starting Gradle remote cache is easy because Gradle provides a Docker image. We managed to do this in three hours.
All it took was launching Docker and adding a single line to the project. However, while it can be launched quickly, ensuring everything works well takes a fair amount of time.
Below is the cache misses chart.
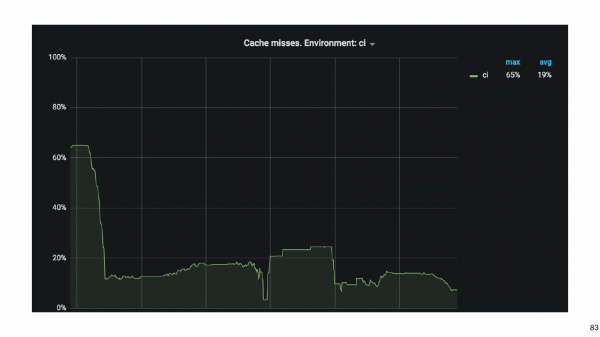
At the very beginning, the cache miss rate was around 65%. After three weeks, we managed to reduce this value to 20%. It turned out that the tasks compiled by the Android application had strange transitive dependencies, which caused Gradle to miss the cache.
By enabling the cache, we significantly speeded up the build process. But besides the build, instrumentation tests are also run, and they take a long time. It's possible that not all tests need to be executed for each pull request. To find this out, we use impact analysis.
Impact analysis
On a pull request, we gather the git diff and identify the changed Gradle modules.
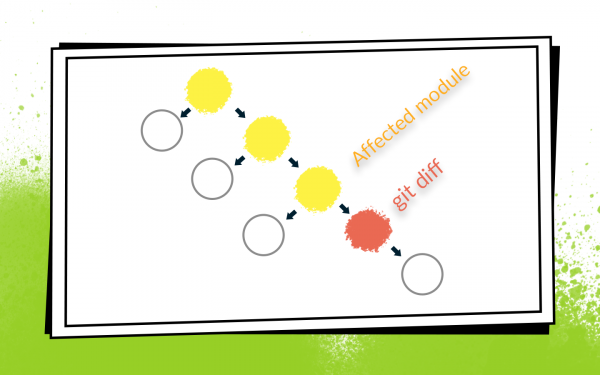
It makes sense to run only those instrumentation tests that check the modified modules and all modules that depend on them. There's no point in running tests for adjacent modules: their code hasn't changed, so nothing can break.
Instrumentation tests are not so straightforward, because they need to be in the top-level Application module. We applied heuristics with bytecode analysis to determine which module each test belongs to.
Modernizing the operation of instrumentation tests to check only the involved modules took about eight weeks.
The measures to speed up checks have successfully worked. We reduced the time from 45 minutes to about 15. Waiting a quarter of an hour for a build is now acceptable.
But now developers have started complaining that they are unclear about which builds are running, where to look for logs, why a build is failing, which test failed, etc.
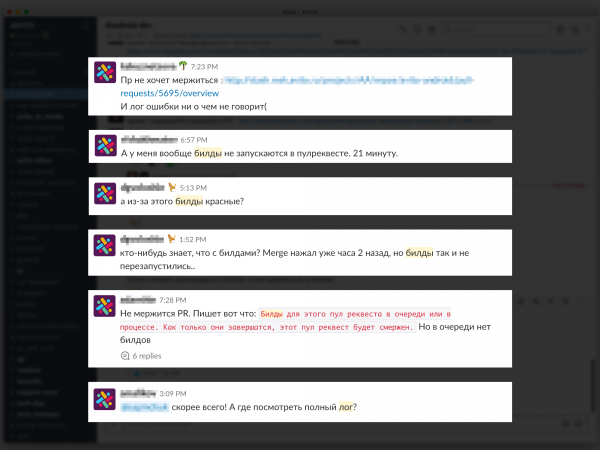
Issues with feedback slow down development, so we made an effort to provide clear and detailed information about each PR and build. We started with comments in Bitbucket on the PR indicating which build failed and why, and we sent targeted messages in Slack. Ultimately, we created a PR dashboard with a list of all builds currently running and their statuses: queued, running, failed, or completed. You can click on the build to access its log.
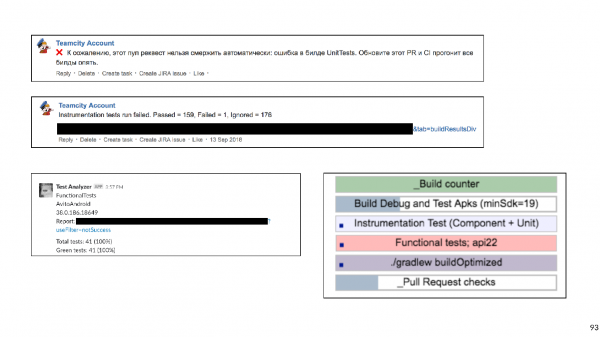
Detailed feedback took six weeks.
Plans
Now, moving on to the latest story. Having resolved the feedback issue, we reached a new level — we decided to build our own emulator farm. When there are many tests and emulators, managing them becomes difficult. As a result, all our emulators moved to a k8s cluster with flexible resource management.
In addition, there are other plans.
- Reintroduce Lint (and other static analysis). We are already working in this direction.
- Run all end-to-end tests on all SDK versions as a PR blocker.
So, we traced the history of Continuous Integration at Avito. Now, I want to give some advice from the perspective of an experienced person.
Tips
If I could give only one piece of advice, it would be this:
Please be more careful with shell scripts!
Bash is a very flexible and powerful tool, allowing for quick script writing. But it can lead to traps, and unfortunately, we fell into one.
It all started with simple scripts running on our build machines:
#!/usr/bin/env bash
./gradlew assembleDebug
But as is well known, everything develops and becomes more complex over time — let's run one script from another, let's pass some parameters — in the end, it became necessary to write a function to determine the current level of bash nesting, to insert the correct quotes to make everything run.
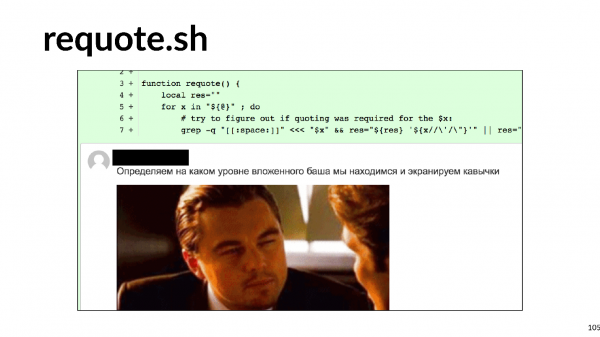
Can you imagine the labor costs involved in developing such scripts? I advise against falling into this trap.
What can we replace it with?
- Any scripting language. Writing in Python or Kotlin Script is more convenient because it’s programming, not scripting.
- Or describe the entire build logic in the form of Custom gradle tasks for your project.
We decided to choose the second option, and we are systematically removing all bash scripts and writing many custom gradle tasks.
Advice #2: Store infrastructure as code.
It's convenient when Continuous Integration settings are stored not in the UI of Jenkins or TeamCity, but as text files directly in the project's repository. This provides versioning. It won't be difficult to roll back or build code on a different branch.
Scripts can be stored in the project. But what about the environment?
Tip #3: Docker can help with the environment.
It will definitely help Android developers, unfortunately not iOS for now.
Here is an example of a simple docker file that contains both jdk and android-sdk:
FROM openjdk:8

ENV SDK_URL="https://dl.google.com/android/repository/sdk-tools-linux-3859397.zip"
    ANDROID_HOME="/usr/local/android-sdk"
    ANDROID_VERSION=26
    ANDROID_BUILD_TOOLS_VERSION=26.0.2

# Download Android SDK
RUN mkdir "$ANDROID_HOME" .android
    && cd "$ANDROID_HOME"
    && curl -o sdk.zip $SDK_URL
    && unzip sdk.zip
    && rm sdk.zip
    && yes | $ANDROID_HOME/tools/bin/sdkmanager --licenses

# Install Android Build Tool and Libraries
RUN $ANDROID_HOME/tools/bin/sdkmanager --update
RUN $ANDROID_HOME/tools/bin/sdkmanager "build-tools;${ANDROID_BUILD_TOOLS_VERSION}"
    "platforms;android-${ANDROID_VERSION}"
    "platform-tools"

RUN mkdir /application
WORKDIR /application
I wrote this docker file (I'll let you in on a secret, you can skip this and pull a ready-made one from GitHub) and after building the image, you get a virtual machine where you can compile the application and run Junit tests.
The two main arguments for why this makes sense are scalability and repeatability. With Docker, you can quickly set up a dozen build agents that will have exactly the same environment as the previous one. This greatly simplifies life for CI engineers. Packing android-sdk into Docker is quite straightforward; emulators are a bit more complex: you’ll have to put in some effort (or once again download a ready-made version from GitHub).
Tip #4: Remember that checks are made not for the sake of checks, but for people.
It is very important for developers to have quick and, most importantly, clear feedback: what broke, which test failed, where to look for the build log.
Tip #5: Be pragmatic in the development of Continuous Integration.
Clearly understand which types of errors you want to prevent, how much you are willing to spend in terms of resources, time, and machine time. Long checks can, for example, be moved to the night. And for those that catch less important errors, abandon them entirely.
Tip #6: Use ready-made tools.
There are now many companies that provide cloud CI.
For small teams, this is a good solution. There's no need to maintain anything, just pay a little money, build your application, and even run instrumentation tests.
Tip #7: In a large team, in-house solutions are more advantageous.
But sooner or later, as the team grows, in-house solutions will become more beneficial. There is one aspect to these solutions. In economics, there is a law of diminishing returns: in any project, each subsequent improvement becomes increasingly difficult and requires more and more investment.
Economics describes our entire life, including Continuous Integration. I built a graph of the labor costs at each stage of our Continuous Integration development.
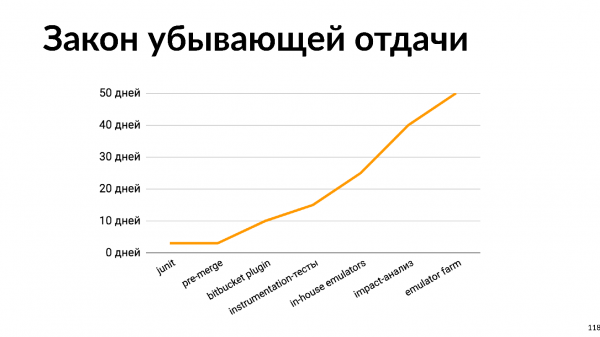
It is clear that any improvement becomes more and more challenging. Looking at this graph, one can understand that advancing Continuous Integration needs to align with the growth of the team's size. For a two-person team, spending 50 days developing an internal emulator farm is not the best idea. However, for a large team, ignoring Continuous Integration entirely is also a poor idea, as more time will be spent addressing integration issues, fixing communication problems, etc.
We started with the idea that automation is needed because people are expensive, they make mistakes, and they can be lazy. But automation is also performed by people. Therefore, these same issues apply to automation.
- Automation is expensive. Remember the labor cost graph.
- When automating, people make mistakes.
- Sometimes, it’s very tempting to avoid automation because everything is working fine already. Why improve anything further, why all this Continuous Integration?
But I have statistics: 20% of builds catch errors. This happens not because our developers write bad code. It’s because developers are confident that if they make a mistake, it won't end up in develop, as it will be caught by automated checks. Consequently, developers can spend more time writing code and working on interesting features rather than running and checking things locally.
Engage in Continuous Integration. But in moderation.
By the way, Nikolai Nesterov not only delivers great talks himself but is also part of the program committee and helps others prepare informative presentations for you. You can assess the completeness and usefulness of the upcoming conference program based on the topics in the . For more details, come on April 22-23 to Infopros space.
Source: habr.com
