I propose to read the transcript of the report by Roman Khavronenko "ExtendedPromQL"


Briefly about me. My name is Roman. I work for CloudFlare and live in London. But I'm also a VictoriaMetrics maintainer.
And I am the author for Grafana and is a small proxy for ClickHouse.

We will start with the first part, which is called “Translation Difficulties” and in it I will talk about the fact that any language or even just a language of communication is very important. Because this is how you convey your thoughts to another person or system, how you formulate a request. People on the Internet are arguing about which language is better - java or some other. For myself, I decided that it is necessary to choose a task, because all this is specific.
Let's start from the very beginning. What is PromQL? PromQL is Prometheus Query Language. This is how we form queries in Prometheus to get time series data, time series.
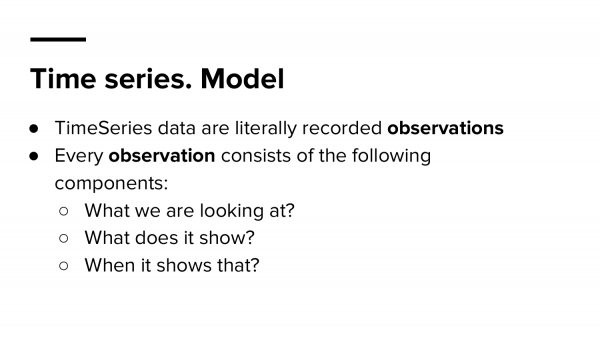
What is time series data? Literally, these are three parameters.
It:
- What are we looking at.
- When we look at it.
- And what value does it show.
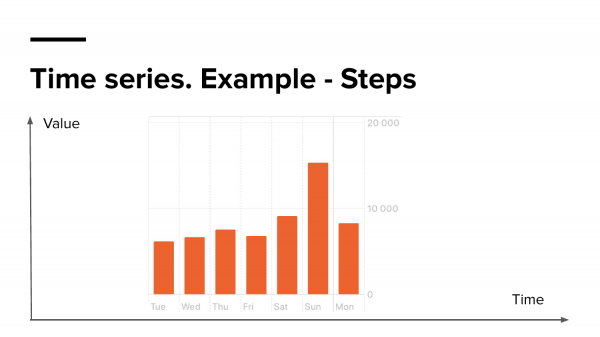
If you look at this chart (this chart is from my phone, which shows the statistics of my steps), then here you can quickly answer these questions.
We are looking at steps. We see the meaning and we see the time when we look at it. That is, looking at this diagram, you can easily say that on Sunday I walked about 15 steps. This is time series data.
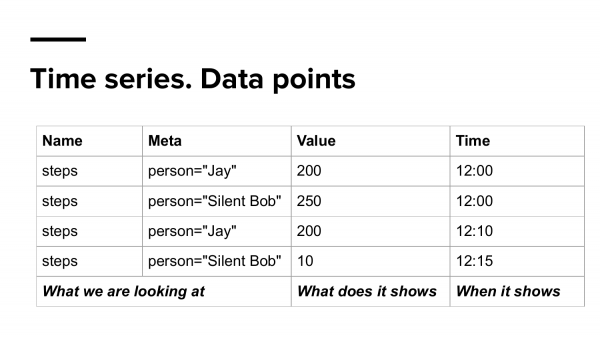
Now let's "break" (transform) them into another data model in the form of a table. Here we also have what we are looking at. Here I added a little additional data, which we will call meta-data, that is, it was not me who went through, but two people, for example, Jay and Silent Bob. This is what we're looking at; what it shows and when it shows that value.
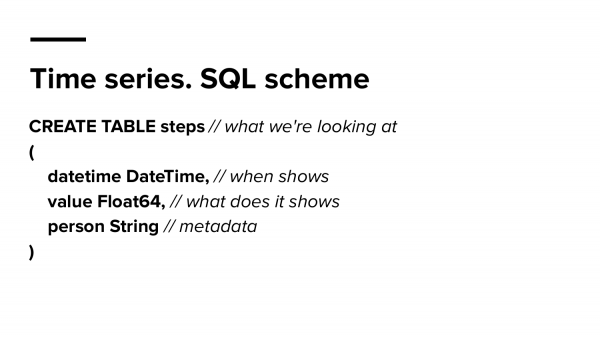
Now let's try to store all this data in the database. For example, I took the ClickHouse syntax. And here we are creating one table called "Steps", i.e. what we are looking at. There is a time here when we look at it; what it shows and some meta-data where we will store who it is: Jay and Silent Bob.
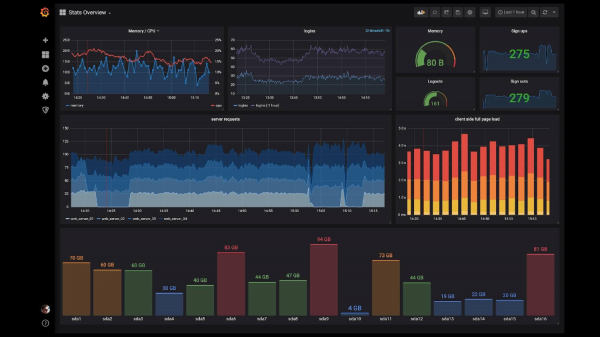
And in order to try to visualize it all, we will use Grafana, because, firstly, it is beautiful.
Also we will use this plugin. There are two reasons for this. The first is because I wrote it. And I know exactly how hard it is to pull out time series data from ClickHouse to show it in Grafana.
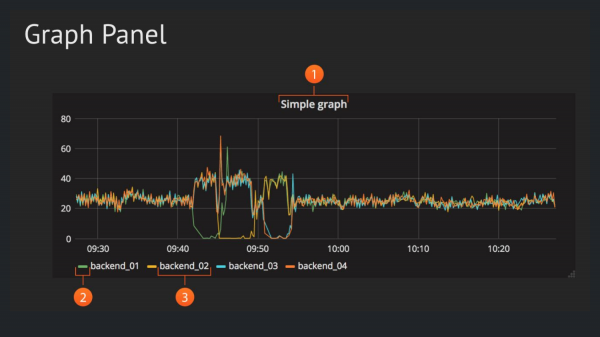
We will display in the Graph Panel. This is the most popular panel in Grafana and shows value versus time, so we only need two parameters.
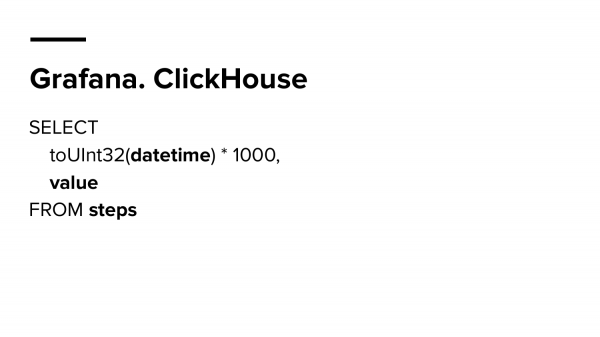
Let's write the simplest query - how to show step statistics in Grafana, storing this data in ClickHouse, in the table that we created. And we write such a simple query. We choose from steps. We select a value and select the time of these values, i.e. the same three parameters that we talked about.
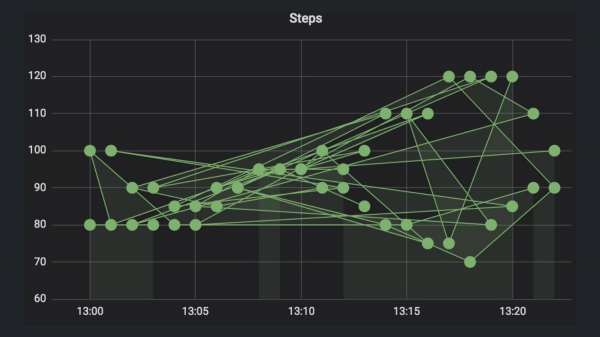
And as a result, we get this graph. Who knows why he's so weird?
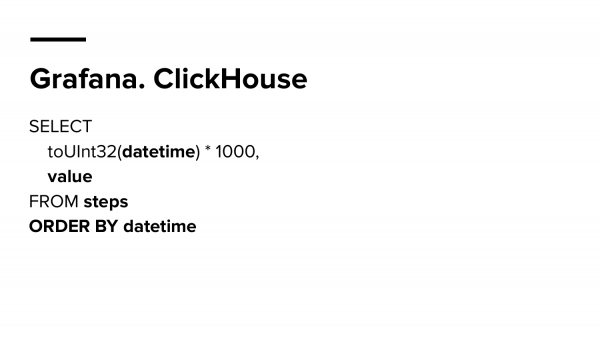
That's right, you need to sort by time.
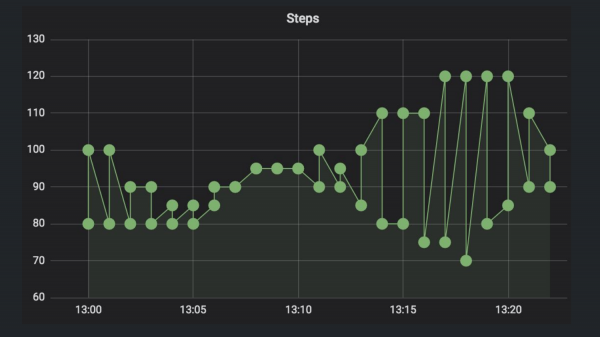
And in the end we get a better, but still strange schedule. Who knows why? That's right, there are two participants, and we give away two time series in Grafana, because if we deal with the data model again, then each time series is a unique combination of a name and all labels key-values.
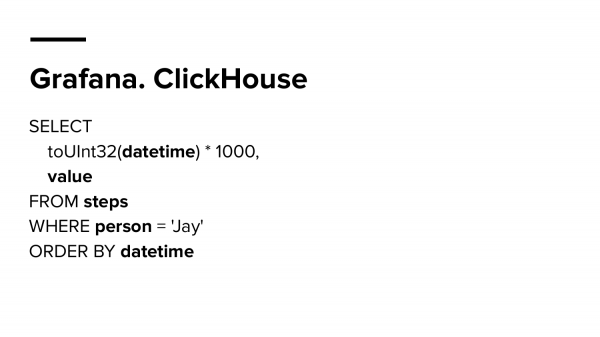
Therefore, we need to choose a specific person. We choose Jay.

And draw again. Now the graph looks like the truth. Now it is a normal schedule and everything is working well.
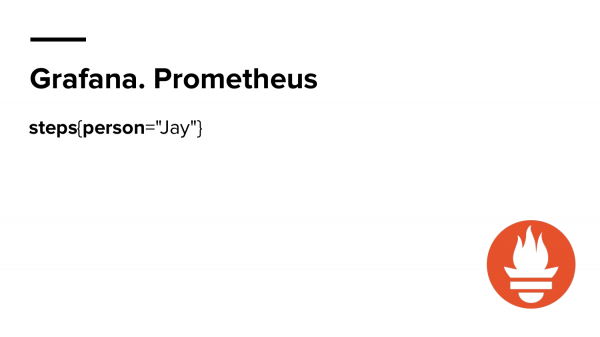
And, probably, you know how to do about the same thing, but in Prometheus via PromQL. Roughly like this. A little easier. And let's break it all down. We took Steps. And filter by Jay. We do not specify here that we need to get a value and we do not choose a time.
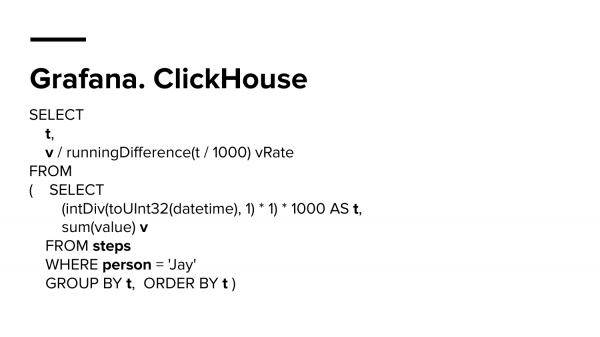
Now let's try to calculate the movement speed of Jay or Silent Bob. In ClickHouse, we will need to do runningDifference, i.e., calculate the difference between pairs of points and divide them by time to get the exact speed. The request will look something like this.
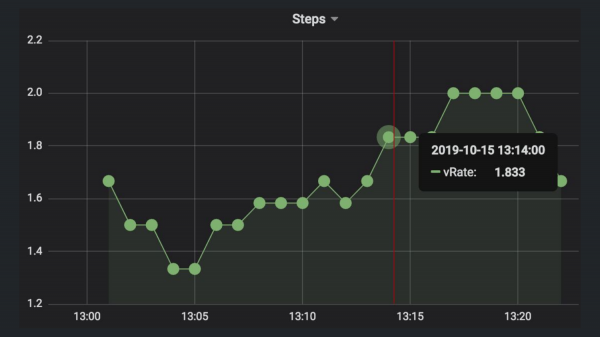
And he will show approximately these values, i.e. approximately 1,8 steps per second does Silent Bob or Jay.
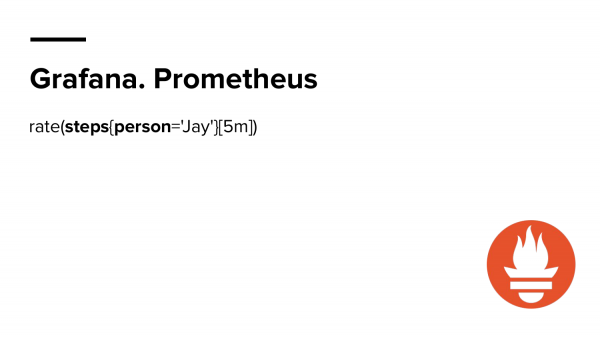
And in Prometheus you know how to do it too. Much easier than before.
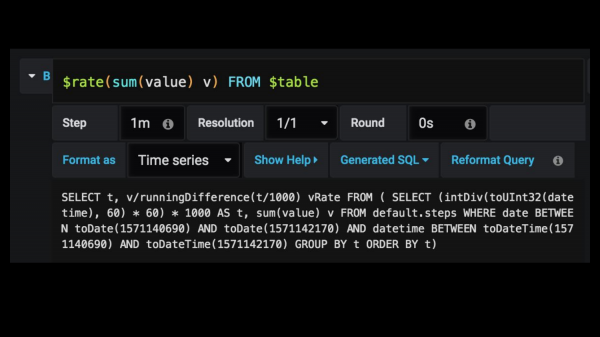 And to make it also easy to do in Grafana, I added such a wrapper that looks very similar to PromQL. It's called Rate Macros, or whatever you want to call it. In Grafana, you just write “rate”, but somewhere deep down it transforms into such a big request. And you don't even have to look at it, it's there somewhere, but you save a lot of time, because writing such huge SQL queries is always expensive. You can easily make a mistake and then not understand what is happening for a long time.
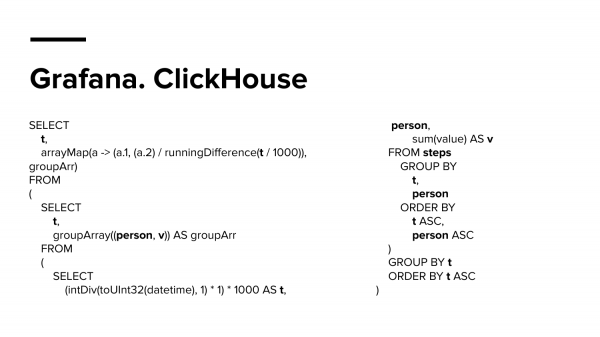
And this is a query that did not even fit on one slide, and I even had to split it into two columns. This is also a request in ClickHouse, which makes the same rate, but for both time series: Silent Bob and Jay, so that we have two time series on the panel. And this is already very difficult, in my opinion.
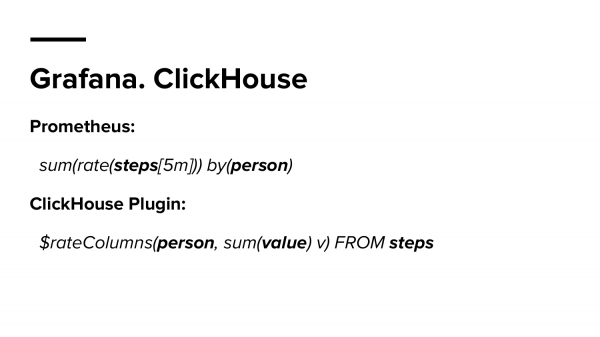
And according to Prometheus it will be sum (rate). For ClickHouse I made a separate macro called RateColumns which looks like a Prometheus query.
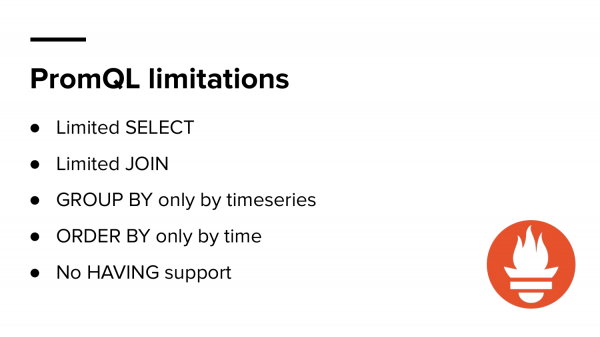
We looked and it seems that PromQL is all so cool, but it has, of course, limitations.
It:
- Limited SELECT.
- Edge JOINs.
- No HAVING support.
And if you have worked with it for a long time, then you know that sometimes it is very difficult to do something in PromQL, and in SQL you can do almost everything, because all these options that we just talked about could be done in SQL. But would it be convenient to use it? And this makes me think that not always the most powerful language can be the most convenient.

Therefore, sometimes you need to choose a language for tasks. It's like a battle between Batman and Superman. It is clear that Superman is stronger, but Batman was able to defeat him because he is more practical and knew exactly what he was doing.

And the next part is Extending PromQL.
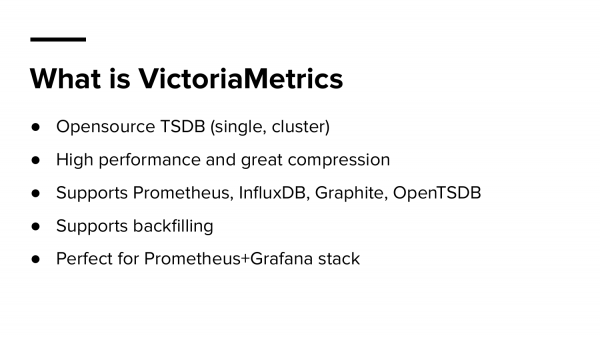
Once again about VictoriaMetrics. What is VictoriaMetrics? This is a time series database, it is in OpenSource, we distribute its single and cluster versions. According to our benchmarks, it is the fastest that is on the market now and it is similar in terms of compression, i.e. living people report compression of about 0,4 bytes per point, when Prometheus has 1,2-1,4.
We support not only Prometheus. We support InfluxDB, Graphite, OpenTSDB.
You can "write" in us, that is, you can transfer old data.
And we also work perfectly with Prometheus and Grafana, i.e. we support the PromQL engine. And in Grafana, you can simply change the Prometheus endpoint to VictoriaMetrics and all your dashboards will work as they did.
But you can also use additional chips provided by VictoriaMetrics.
We'll quickly go through the features we've added.
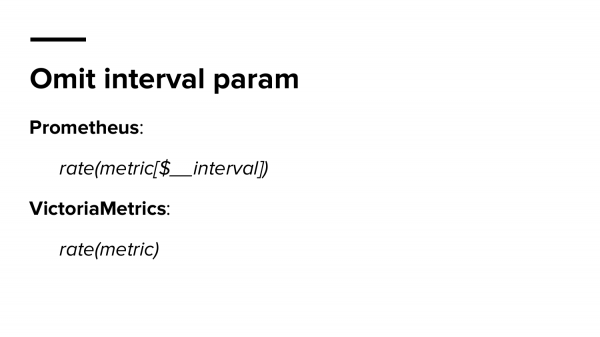
Omit interval param - you can skip parameter interval in Grafana. When you don't want to get strange graphs when zoom-in/out in the panel, it is recommended to use the variable $__interval. This is an internal Grafana change and it chooses the data range itself. And VictoriaMetrics can itself understand what this range should be. And you don't have to update all your requests. It will be much easier.
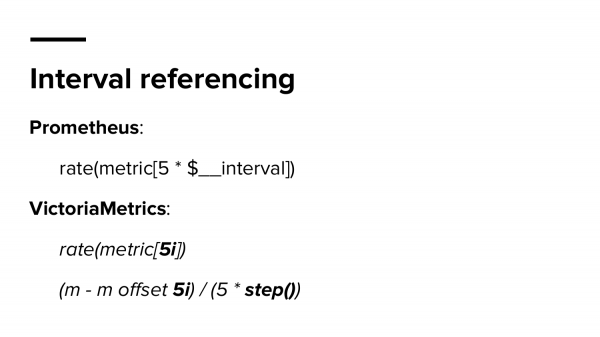
The second function is interval referencing. You can use this spacing in your expressions. You can multiply, divide, transfer, refer to it.
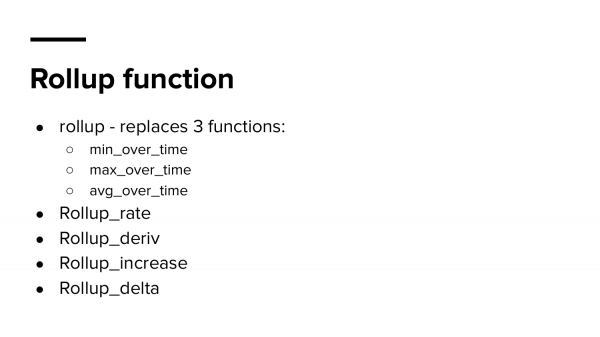
Next is the rollup function family. The rollup function transforms any of your time series into three separate time series. These are min, max and avg. I find it very convenient, because sometimes it can show some outliers (anomalies) and inaccuracies.
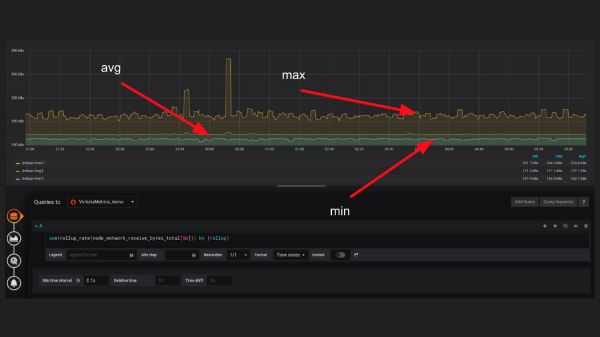
And if you're just doing irate or rate, then you can probably miss some cases where the time series doesn't behave the way you intended. It's much easier to see with this function, let's say max is very much off avg.
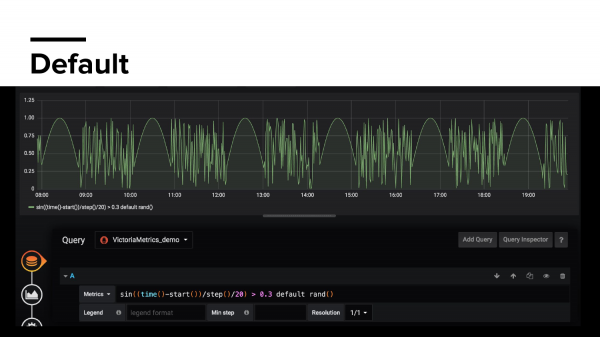
Next is the default variable. Default - this means what value we need to draw in Grafana if we do not have a time series at the moment. When does it happen? Let's say you export some error metrics. And you have such a cool application that when you start, you have no errors and even no errors for the next three hours or even a day. And you have dashboards that show relationships from success to error. And they will show you nothing because you don't have an error metric. And in default you can specify anything.
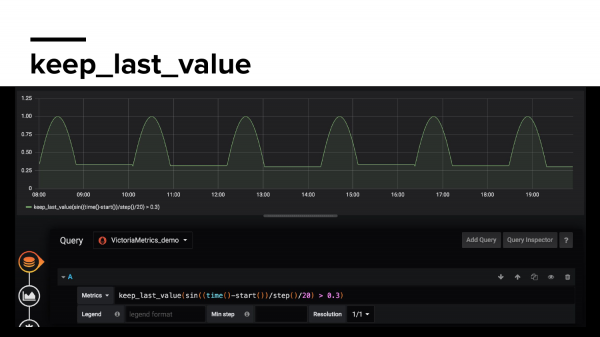
Keep_last_Value - saves the last value of the metric if it is missing. If Prometheus after the next scrape did not find it within 5 minutes, then here we will remember its last value and your charts will not break again.
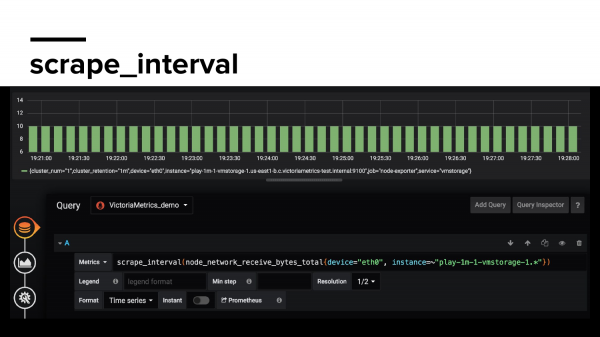
Scrape_interval - shows how often Prometheus collects data on your metric, with what frequency. Here you can see the pass, for example.
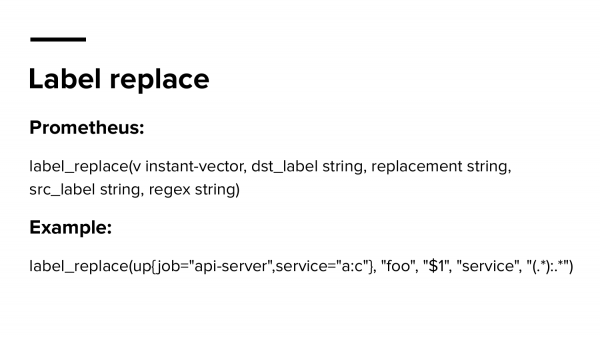
Label replace is a popular feature. But we think it's a bit complicated because it takes integer arguments. And you need to not only remember the 5 arguments, but also remember their sequence.
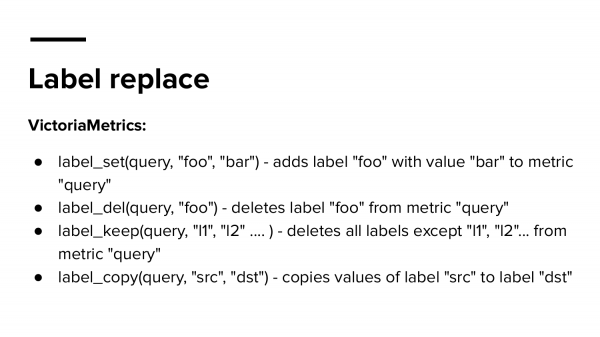
Therefore, why not make them simpler? That is, break it down into small functions with clear syntax.

And now the most interesting. Why do we think it's extended PromQL? Because we support Common Table Expressions. You can follow the QR code (), see links with examples, from the playground, where you can run queries directly in VictoriaMetrics without installing it just in the browser.
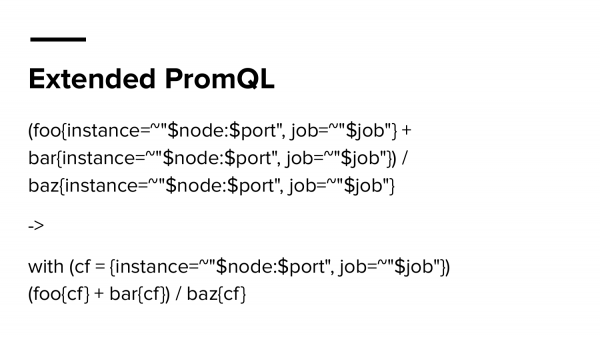
And what is it? This request from above is a fairly popular request. I think in any dashboard in many companies you use the same filter for everything. Usually so. But when you need to add some new filter, you have to update each panel, or download the dashboard, open it in JSON, do a find replace, which also takes time. Why not store this value in a variable and reuse it? It looks, in my opinion, much simpler and clearer.
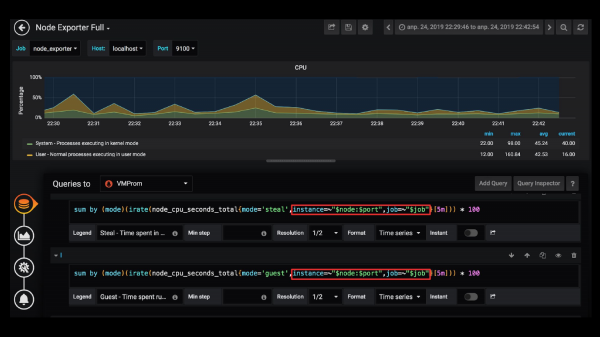
For example, when I need to update filters in Grafana in all requests, and the dashboard can be huge or there can even be several of them. And how would I like to solve this problem in Grafana?
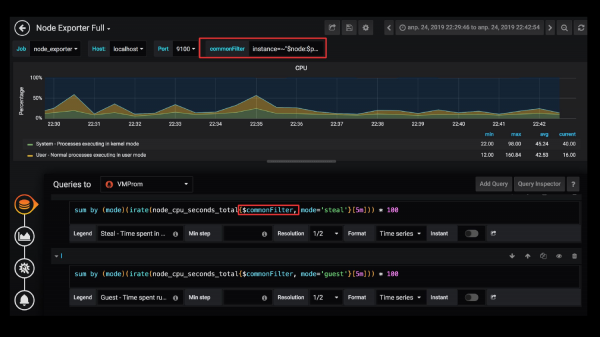
I solve this problem like this: I make a commonFilter and define this filter in it, and then I reuse it in queries. But if you do the same now, it won't work because Grafana doesn't allow you to use variables inside query variables. And it's a little weird.
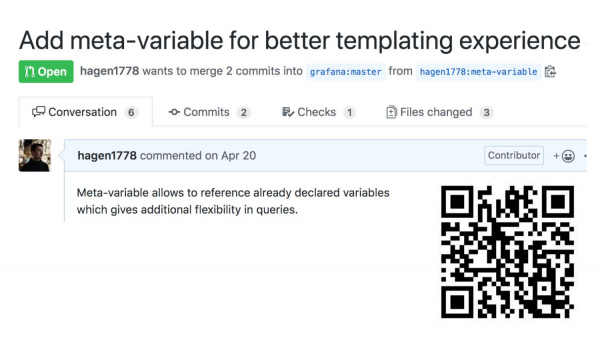
And so I made an option that allows you to do this. And if you are interested or want such a feature, then support or dislike if you do not like this idea.
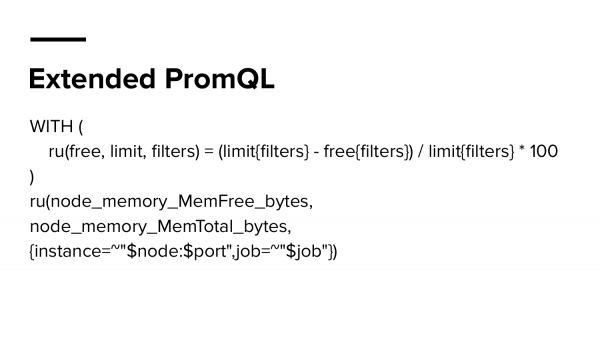
More about PromQL extended. Here we define not only a variable, but directly an entire function. And we call it ru (resource usage). And this function accepts free resources, a resource limit, and a filter. The syntax seems to be simple. And it is very easy to use this function and calculate the percentage of free memory we have. That is, how much memory we have, what limit and how to filter. It looks a lot better if you were to write it all reusing the same filters, because it would turn into a big, big query.
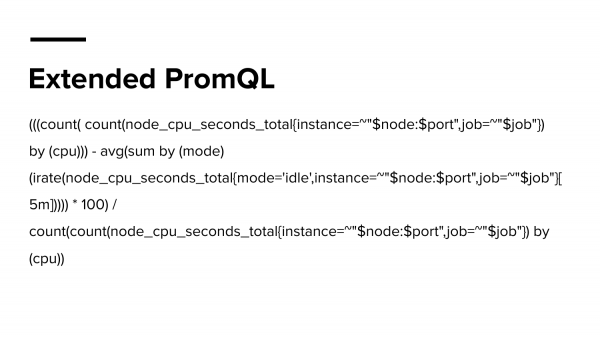
And here is an example of such a big, big request. It's from the official NodeExporter dashboard for Grafana. But I don't really understand what's going on here. That is, of course, I understand if you look closely, but the number of brackets can immediately reduce the motivation to understand what is happening here. And why not make it simpler and clearer?
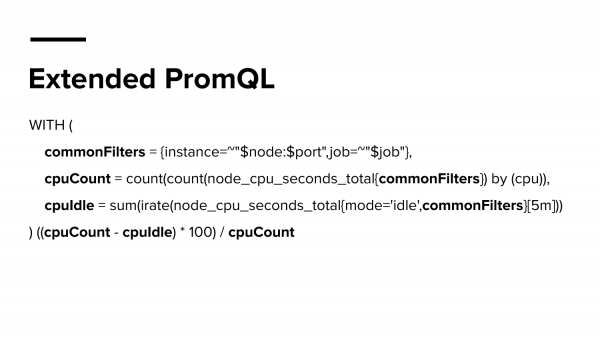
For example, like this, highlighting significant things or parts in variables. And then do your basic math. This is more like programming, this is what I would like to see in the future in Grafana.
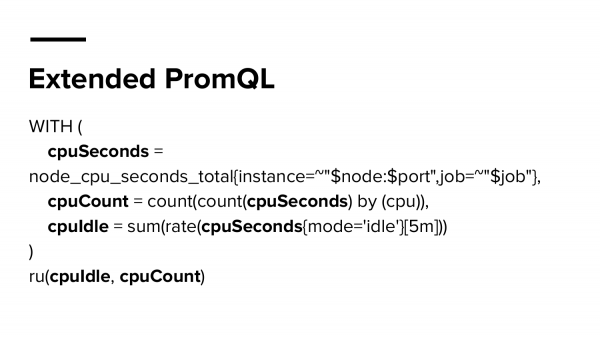
Here is a second example of how we can make it even easier if we already had this ru function, and it already exists directly in VictoriaMetrics. And then you just pass the cached value that you declared in the CTE.
I have already talked about how important it is to use the right programming language. And, probably, something different is going on in Grafana in every company. And, probably, you still give access to Grafana to your developers, and the developers do something of their own. And they all do it in a different way. But I wanted it somehow the same, that is, reduced to a common standard.
Let's say you don't even just have system engineers, maybe you even have experts, devops or SREs. Maybe you have experts who know what monitoring is, know what Grafana is, i.e. they have been working with this for years and they know exactly how to do it right. And they already wrote it 100 times and explained it to everyone, but for some reason no one listens.
What if they could put this knowledge directly into Grafana so that other users could reuse the functions? And if it would be necessary to calculate the percentage of free memory, then they would simply apply the function. But what if the creators of exporters, along with their product, also provided a set of functions, how to work with their metrics, because they know exactly what these metrics are and how to calculate them correctly?
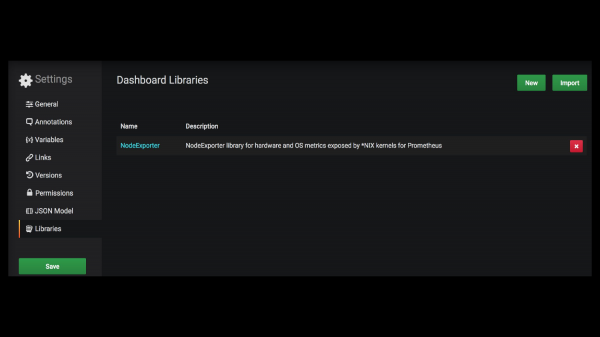
This one doesn't really exist. Here is what I did myself. This is the library support in Grafana. Let's say the guys who made NodeExporter did what I described. And also provided a set of features.
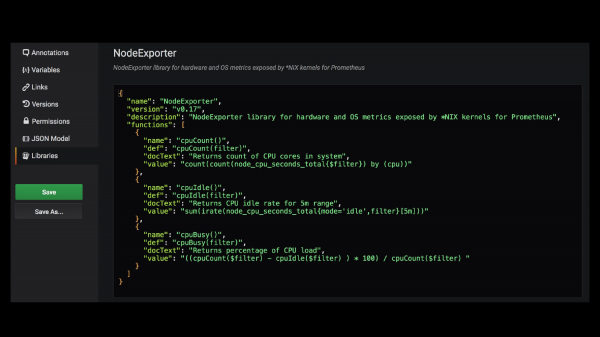
That is, it looks something like this. You connect this library to Grafana, you go into editing, and here it is very simple in JSON how to work with this metric. That is, some set of functions, their description and what they unfold into.
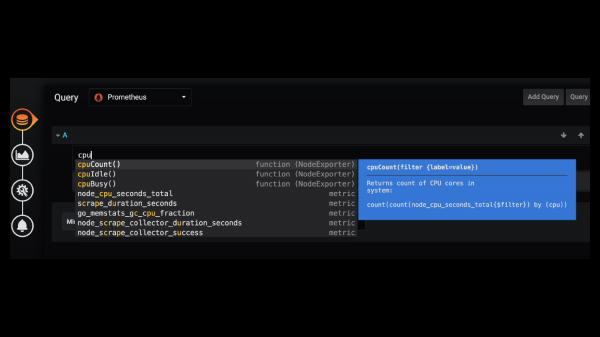
In my opinion, this could be useful, because then you would write in Grafana just like that. And Grafana "tells" you that there is such and such a function from such and such a library - let's use it. I think that would be very cool.
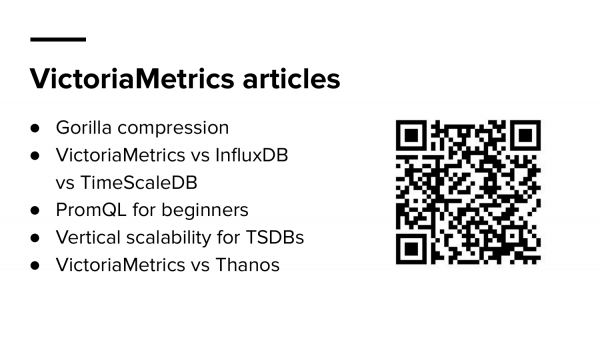
A little about VictoriaMetrics. We do a lot of interesting things. Read our articles about compression, about our competition with other time series data applications, our explanation of how to work with PromQL, because there are many more beginners in this, as well as about vertical scalability and about confrontation with Thanos.
Questions:
I'll start my question with a simple life story. When I first started using Grafana, I wrote a very persuasive 5 line query. The end result is a very convincing chart. This graph has almost gone into production. But upon closer inspection, it turned out that this chart shows absolute nonsense that has nothing to do with reality, although the numbers fall into the range that we expected to see. And my question. We have libraries, we have functions, but how do we write tests for Grafana? You have written a complex query that affects the business decision - to order a real container of servers or not to order. And as we know, this function that draws a graph is similar to the truth. Thank you.
Thanks for the question. There are two parts here. First, I get the impression, based on my experience, that most users, when they look at their charts, do not understand what they are showing them. Somehow, people are very good at coming up with an excuse for any anomaly that happens on the charts, even if it's a bug inside a function. And the second part - it seems to me that using such functions would be much better suited to solving your problem, instead of each of your developers doing their own capacity planning and making mistakes with some probability.
How to check?
How to check? Probably not.
As a test in Grafana.
And what about Grafana? Grafana translates this request directly to the DataSource.
By adding a little to the parameters.
No, nothing is added to Grafana. There may be GET parameters, such as step. It is not explicitly specified, but you can override it, you can not override it, but it is added automatically. You don't write tests here. I don't think you should rely on Grafana here as a source of truth.
Thanks for the report! Thanks for the compression! You recalled about mapping a variable in a graph, that in Grafana you cannot use a variable in a variable. Do you understand what I mean?
Yes.
This was initially a headache when I wanted to make an alert in Grafana. And there you need to do alert for each host separately. Here's this thing you did, does it work for alerts in Grafana?
If Grafana doesn't access variables in some other way, then yes, it will work. But my advice is not to use alerting in Grafana at all, you'd better use alertmanager.
Yes, I use it, but it just seemed easier to set up in Grafana, but thanks for the tip!
Source: habr.com


