

If you use a time series database ( ) as the primary storage for a statistics website, instead of solving the problem, you may end up with a lot of headaches. I am working on a project that uses such a database, and sometimes InfluxDB, which will be discussed, has presented unexpected surprises.
Disclaimer: the issues mentioned pertain to version InfluxDB 1.7.4.
Why time series?
The project involves tracking transactions across various blockchains and displaying statistics. Specifically, we are looking at the issuance and burning of stablecoins (). Based on these transactions, we need to build charts and show summary tables.
While analyzing transactions, the idea arose: to use the InfluxDB time series database as the primary storage. Transactions are points in time and fit well into a time series model.
Additionally, the aggregation functions looked quite convenient — they are perfect for processing charts over a long period. The user needs a chart for a year, but the database has a dataset with a five-minute timeframe. Sending all one hundred thousand points would be pointless — besides the long processing time, they wouldn't fit on the screen. You could write your own implementation to increase the timeframe or use the built-in aggregation functions in Influx. With their help, you can group data by days and send the necessary 365 points.
It was somewhat confusing that such databases are usually used to collect metrics. Monitoring servers, IoT devices, everything that 'pours' millions of points like: [<time> — <metric value>]. But if the database works well with a large flow of data, why should a small volume cause problems? With this thought, we adopted InfluxDB for work.
What's more convenient in InfluxDB
In addition to the mentioned aggregation functions, there is another wonderful thing — continuous queries (). This is a built-in scheduler within the database that can process data on a schedule. For example, you can group all records for the day every 24 hours, calculate the average, and write one new point to another table without writing your own implementations.
There are also retention policies () — configuring data deletion after a certain period. This is useful when, for instance, you need to store CPU load for a week with measurements every second, but such precision isn't needed over a couple of months. In this situation, you can do the following:
- create a continuous query to aggregate data into another table;
- for the first table, define a metric deletion policy for metrics older than that week.
And Influx will autonomously reduce data size and remove unnecessary entries.
About stored data
Not much data is stored: around 70,000 transactions and another million points with market information. New entries are added at no more than 3,000 points per day. There are also metrics for the site, but that data is minimal and, according to the retention policy, is kept for no more than a month.
Issues
During the service development and subsequent testing, increasingly critical problems arose when operating InfluxDB.
1. Data deletion
There is a series of data with transactions:
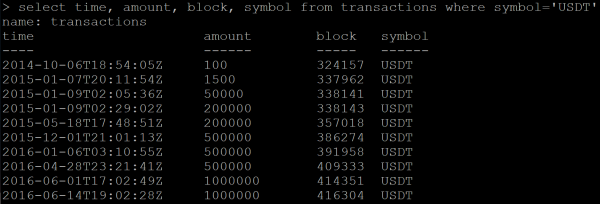
SELECT time, amount, block, symbol FROM transactions WHERE symbol='USDT'Result:
I send the command to delete data:
DELETE FROM transactions WHERE symbol='USDT'Then, I make a request to retrieve the already deleted data. And Influx returns part of the data that should have been deleted instead of an empty response.
I try to delete the entire table:
DROP MEASUREMENT transactionsI check the deletion of the table:
SHOW MEASUREMENTSI don't see the table in the list, yet a new data request still returns the same set of transactions.
The problem occurred for me only once, as the case with deletion was a singular instance. However, such behavior from the database clearly does not fit within the bounds of 'correct' operation. Later, I found an open on this topic almost a year old on GitHub.
As a result, deleting and subsequently restoring the entire database helped.
2. Floating point numbers
Mathematical computations when using built-in functions in InfluxDB result in accuracy errors. It's not that this is unusual, but it's troublesome.
In my case, the data has a financial aspect, and I would like to process it with high accuracy. Because of this, I plan to abandon continuous queries.
3. Continuous queries cannot be adapted to different time zones.
The service has a table with daily transaction statistics. For each day, it is necessary to group all transactions for that day. However, the day will begin at different times for each user, which means the set of transactions will differ. According to UTC, there are of shifts for which data needs to be aggregated.
In InfluxDB, when grouping by time, you can additionally specify a shift, for example, for Moscow time (UTC+3):
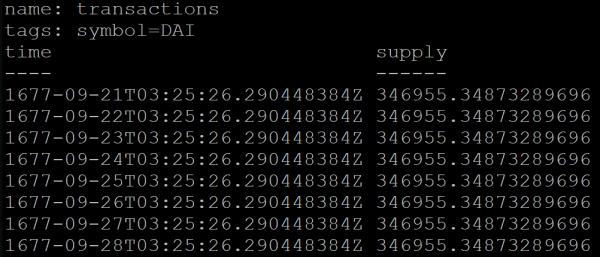
SELECT MEAN("supply") FROM transactions GROUP BY symbol, time(1d, 3h) fill(previous)But the result of the query will be incorrect. For some reason, the grouped daily data will start as far back as the year 1677 (InfluxDB officially supports a time range from that year):
To work around this issue, the service has temporarily been switched to UTC+0.
4. Performance
There are many benchmarks on the internet comparing InfluxDB and other databases. Initially, they seemed like marketing materials, but now I believe there is some truth to them.
Let me share my case.
The service provides an API method that returns statistics for the last 24 hours. During the calculations, the method queries the database three times with the following queries:
SELECT * FROM coins_info WHERE time <= NOW() GROUP BY symbol ORDER BY time DESC LIMIT 1SELECT * FROM dominance_info ORDER BY time DESC LIMIT 1SELECT * FROM transactions WHERE time >= NOW() - 24h ORDER BY time DESCExplanation:
- In the first query, we get the latest data points for each coin with market information. Eight points for eight coins in my case.
- The second query retrieves the most recent single data point.
- The third one fetches the list of transactions from the last 24 hours, which can number in the hundreds.
I should note that InfluxDB automatically builds indexes based on tags and time, which speeds up queries. In the first query, symbol is a tag.
I ran a stress test on this API method. At 25 RPS, the server demonstrated full utilization of six CPUs:
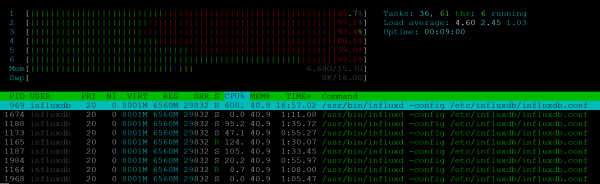
At the same time, the NodeJs process did not put any load on it.
Execution speed degraded already at 7-10 RPS: if one client could get a response in 200 ms, then 10 clients had to wait about a second. 25 RPS was the limit at which stability suffered, and clients received 500 errors.
With such performance, using Influx in our project is impossible. Moreover, in a project where monitoring needs to be demonstrated to multiple clients, similar issues may arise and the metrics server will be overloaded.
Output
The main takeaway from the experience gained is that one should not adopt an unknown technology into a project without sufficient analysis. A simple screening of open tickets on GitHub could have provided information to avoid selecting InfluxDB as the primary data storage.
InfluxDB seemed well-suited for my project's needs, but as practice showed, this database does not meet the requirements and has many issues.
The project's repository already has version 2.0.0-beta, and we can only hope that the second version will bring significant improvements. In the meantime, I'll start studying the TimescaleDB documentation.
Source: habr.com
