

We will look at how Zabbix works with the TimescaleDB database as a backend. We'll show you how to start from scratch and how to migrate from PostgreSQL. We also provide comparative performance tests of the two configurations.

HighLoad++ Siberia 2019. Tomsk Hall. June 24, 16:00. Abstracts and . The next HighLoad++ conference will take place on April 6 and 7, 2020 in St. Petersburg. Details and tickets .
Andrey Gushchin (hereinafter - AG): – I am a ZABBIX technical support engineer (hereinafter referred to as “Zabbix”), a trainer. I have been working in technical support for more than 6 years and have had direct experience with performance. Today I will talk about the performance that TimescaleDB can give when compared to regular PostgreSQL 10. Also some introductory part about how it works in general.
Top performance challenges: from data collection to data cleansing
To begin with, there are certain performance challenges that every monitoring system faces. The first performance challenge is the rapid collection and processing of data.

A good monitoring system should promptly and timely receive all the data, process it according to trigger expressions, that is, process it according to some criteria (this is different in different systems) and save it to the database in order to use this data in the future.
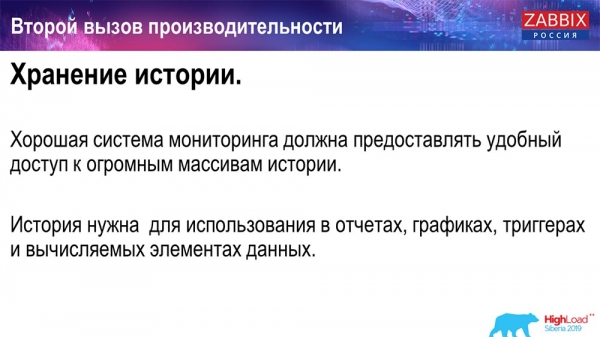
The second performance challenge is history storage. Store in a database often and have quick and easy access to these metrics that have been collected over a period of time. The most important thing is that this data should be convenient to receive, use it in reports, graphs, triggers, in some kind of threshold values, for alerts, etc.
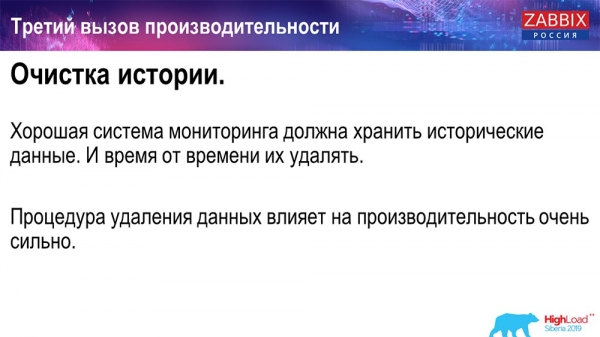
The third performance challenge is history cleanup, that is, when you have such a day that you do not need to store some detailed metrics that have been collected over 5 years (even months or two months). Some network nodes have been removed, or some hosts, metrics are no longer needed because they are already outdated and no longer collected. All this needs to be cleaned up so that your database does not grow to a large size. And in general, clearing the history is most often a serious test for the storage - it often affects performance very much.
How to solve caching problems?
I will now talk specifically about Zabbix. In Zabbix, the first and second calls are solved using caching.

Data collection and processing - we use RAM to store all this data. These data will now be discussed in more detail.
Also on the database side there is a certain caching for the main selections - for graphs, other things.
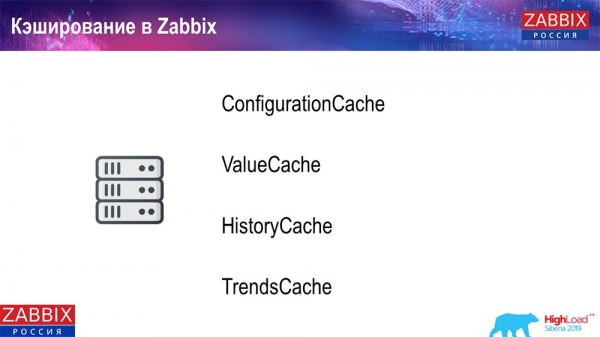
Caching on the side of the Zabbix server itself: we have ConfigurationCache, ValueCache, HistoryCache, TrendsCache. What it is?
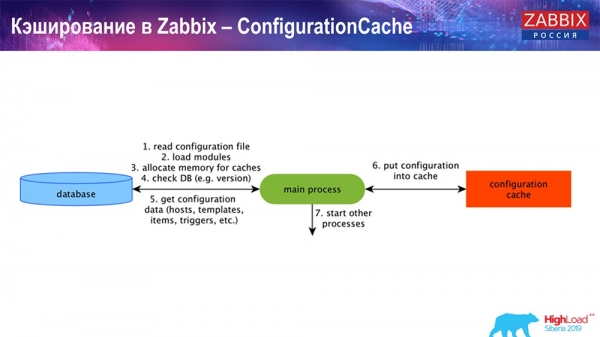
ConfigurationCache is the main cache where we store metrics, hosts, items, triggers; everything you need to process preprocessing, collect data, from which hosts to collect, with what frequency. All this is stored in the ConfigurationCache so as not to go to the database, not to create unnecessary requests. After the server starts, we update this cache (create it) and update it periodically (depending on the configuration settings).
Caching in Zabbix. Data collection
Here the diagram is quite large:
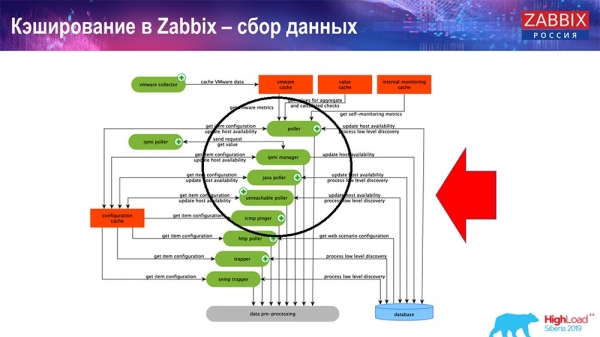
The main ones in the scheme are these assemblers:
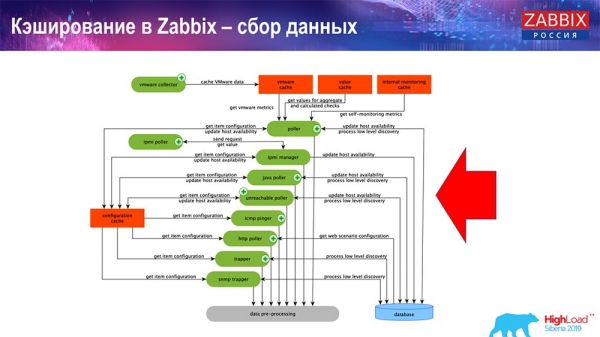
These are the build processes themselves, various “pollers” that are responsible for different types of builds. They collect data via icmp, ipmi, using different protocols and transfer it all to preprocessing.
PreProcessing HistoryCache
Also, if we have calculated data elements (those who are familiar with Zabbix know), that is, calculated, aggregation data elements, we take them directly from ValueCache. How it is filled, I will tell later. All these collectors use the ConfigurationCache to receive their jobs and then pass them on to preprocessing.
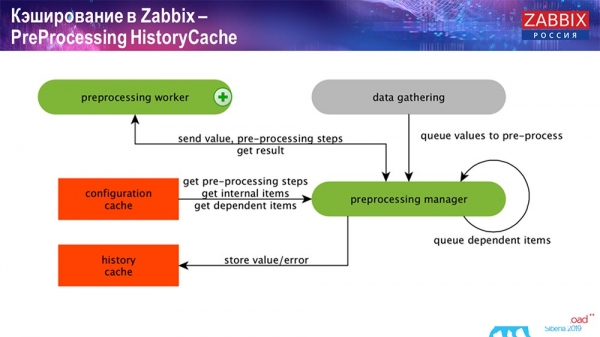
Preprocessing also uses the ConfigurationCache to get preprocessing steps, and processes this data in a different way. Starting from version 4.2, we have moved it to a proxy. This is very convenient, because preprocessing itself is a rather heavy operation. And if you have a very large Zabbix, with a large number of data items and a high frequency of collection, then this greatly facilitates the work.
Accordingly, after we have processed this data in some way using preprocessing, we save it in HistoryCache in order to process it further. This completes the data collection. We move on to the main process.
History syncer operation
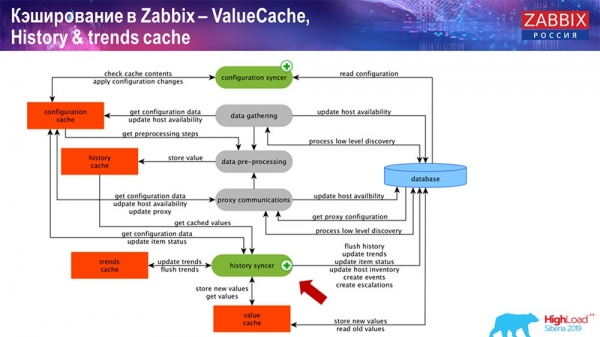
The main process in Zabbix (since it is a monolithic architecture) is the History syncer. This is the main process that deals with the atomic processing of each data element, that is, each value:
- value comes (he takes it from HistoryCache);
- checks in the Configuration syncer: if there are any triggers for calculation - calculates them;
if present, creates events, creates an escalation in order to create an alert, if necessary by configuration; - writes triggers for further processing, aggregation; if you are aggregating over the last hour and so on, this value is remembered by ValueCache so that it does not go to the history table; thus, the ValueCache is filled with the necessary data that is needed to evaluate triggers, calculated items, etc.;
- then the History syncer writes all the data to the database;
- the database writes them to disk - this completes the processing.
Database. caching
On the database side, when you want to view charts or some kind of event reports, there are various caches. But in the framework of this report, I will not talk about them.
For MySQL, there is Innodb_buffer_pool, and a bunch of different caches that can also be configured.
But these are the main ones:
- shared_buffers;
- effective_cache_size;
- shared_pool.
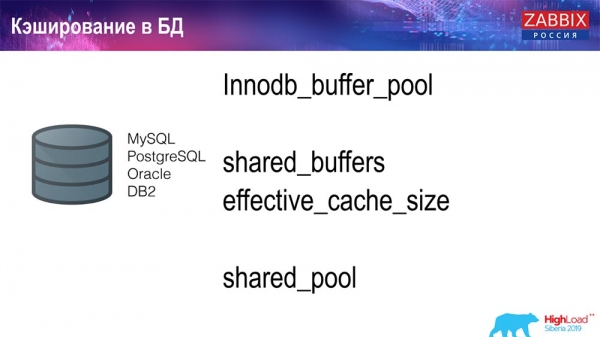
I brought for all databases that there are certain caches that allow you to keep in RAM the data that is often needed for queries. They have their own technologies for this.
About database performance
Accordingly, there is a competitive environment, that is, the Zabbix server collects data and writes it down. When restarted, it also reads from the history to fill the ValueCache and so on. Right there you can have scripts and reports that use Zabbix-API, which is built on the basis of the web interface. "Zabbix"-API enters the database and receives the necessary data to obtain graphs, reports, or some kind of list of events, recent problems.
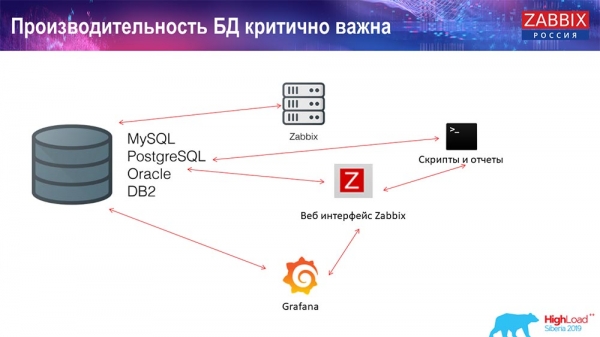
Another very popular visualization solution is Grafana, which is used by our users. Able to directly enter both through the "Zabbix" -API, and through the database. It also creates some competition for getting data: finer, better database tuning is needed to match the fast delivery of results and testing.

Clearing history. Zabbix has Housekeeper
The third call that is used in Zabbix is clearing history with Housekeeper. Housekeeper respects all settings, that is, in our data elements it is indicated how much to store (in days), how long to store trends, and the dynamics of changes.
I didn’t talk about the TrendCash, which we calculate on the fly: data comes in, we aggregate it in one hour (mostly numbers for the last hour), the average / minimum amount and write it once an hour to the trend table (“Trends”) . The housekeeper starts and deletes data from the database with the usual selects, which is not always effective.
How to understand that it is ineffective? You can see the following picture on the performance graphs of internal processes:
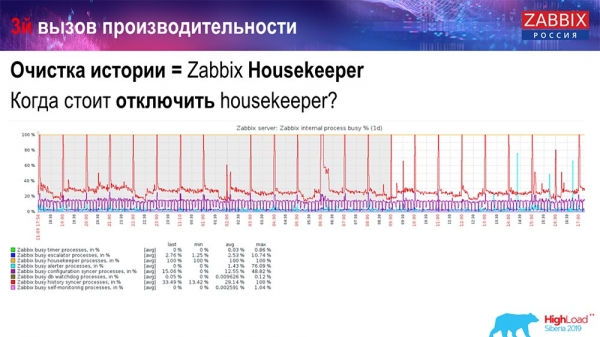
Your History syncer is constantly busy (red chart). And the "red" graph that goes on top. This is the "Housekeeper" that runs and waits for the database to delete all the rows it has set.
Let's take some Item ID: you need to delete the last 5 thousand; of course, by indexes. But usually the dataset is quite large - the database still reads it from disk and puts it in the cache, and this is a very expensive operation for the database. Depending on its size, this can lead to certain performance problems.
You can disable Housekeeper in a simple way - we have a familiar web interface for everyone. Setting in Administration general (Settings for "Housekeeper") we disable internal housekeeping for internal history and trends. Accordingly, Housekeeper no longer manages this:
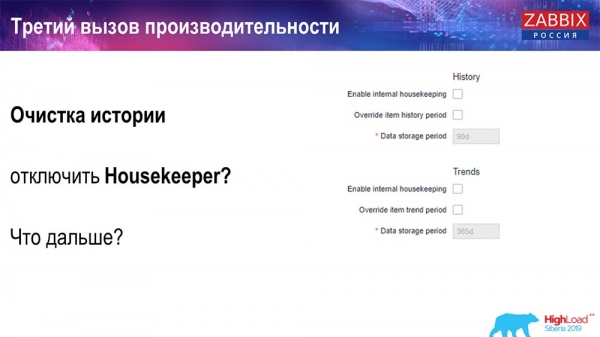
What can be done next? You have turned it off, your graphs have leveled off ... What problems can there be in this case? What can help?
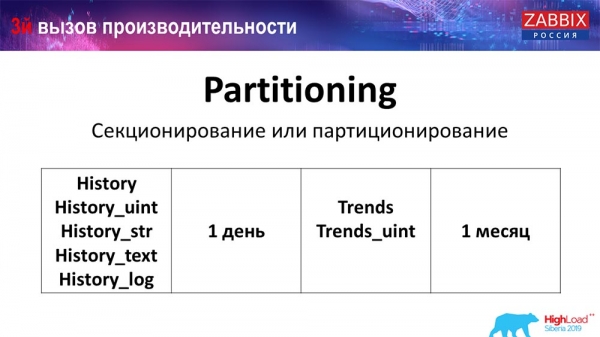
Partitioning (partitioning)
This is usually configured on each relational database that I have listed in a different way. MySQL has its own technology. But in general, they are very similar when it comes to PostgreSQL 10 and MySQL. Of course, there are a lot of internal differences, how it's all implemented and how it all affects performance. But in general, creating a new partition often also leads to certain problems.

Depending on your setup (how much data you create in one day), they usually set the most minimal - this is 1 day / partition, and for "trends", the dynamics of changes is 1 month / new partition. This may change if you have a very large setup.
Let's talk about the size of the setup right away: up to 5 thousand new values per second (so-called nvps) - this will be considered a small "setup". Medium - from 5 to 25 thousand values per second. Everything above is already large and very large installations that require very careful tuning of the database itself.
On very large installations, 1 day may not be optimal. I personally saw on MySQL partitions of 40 gigabytes per day (and there may be more). This is a very large amount of data, which can lead to some problems. It needs to be reduced.
Why is partitioning necessary?
What Partitioning does, I think everyone knows, is table partitioning. Often these are separate files on disk and span requests. It selects one partition more optimally if it is included in the normal partitioning.
For Zabbix, in particular, it is used by range, by range, that is, we use a timestamp (a regular number, time since the beginning of the epoch). You specify start of day/end of day and that is the partition. Accordingly, if you are accessing data from two days ago, it is all selected from the database faster, because you need only one file to load into the cache and display (rather than a large table).
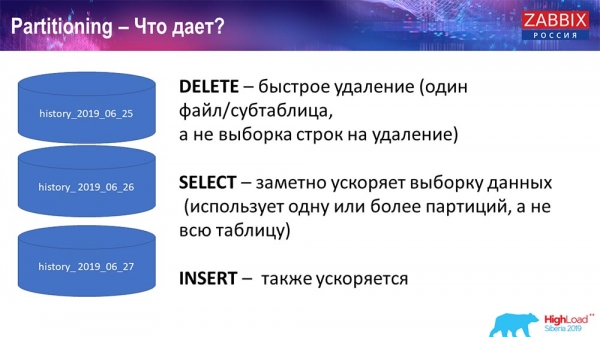
Many databases also speed up insert (inserting into one child table). While I speak abstractly, but it is also possible. Partitoning often helps.
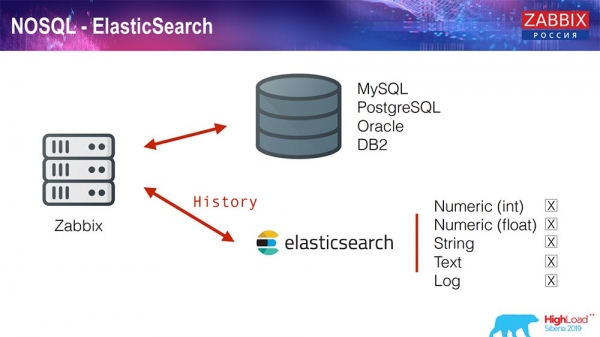
Elasticsearch for NoSQL
Recently, in 3.4, we implemented a solution for NoSQL. Added the ability to write to Elasticsearch. You can write some separate types: choose - either write numbers, or some signs; we have a string text, you can write logs in Elasticsearch ... Accordingly, the web interface will also access Elasticsearch. This works fine in some cases, but at the moment it can be used.
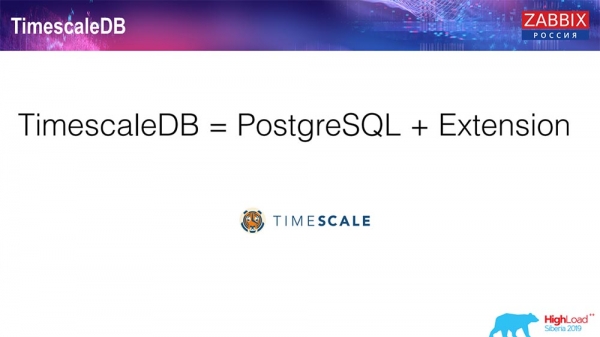
timescaledb. Hypertables
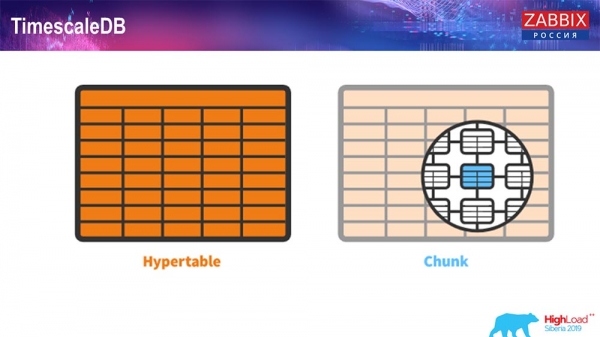
For 4.4.2 we paid attention to one thing like TimescaleDB. What it is? This is an extension for Postgres, that is, it has a native PostgreSQL interface. Plus, this extension allows you to work with timeseries data much more efficiently and have automatic partitioning. What it looks like:
This is hypertable - there is such a thing in Timescale. This is a hypertable that you create, and it contains chunks. Chunks are partitions, these are child tables, if I'm not mistaken. It's really effective.
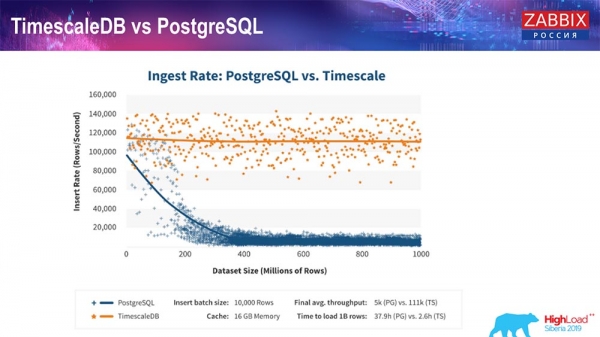
TimescaleDB and PostgreSQL
As TimescaleDB manufacturers assure, they use a more correct query processing algorithm, in particular inserts, which allows you to have approximately constant performance with an increasing dataset insert size. That is, after 200 million lines, Postgres starts to sag very badly and loses performance literally to zero, while Timescale allows you to insert inserts as efficiently as possible with any amount of data.
How to install TimescaleDB? Everything is simple!
He has it in the documentation, it is described - you can install it from packages for any ... It depends on the official Postgres packages. Can be compiled manually. It so happened that I had to compile for the DB.
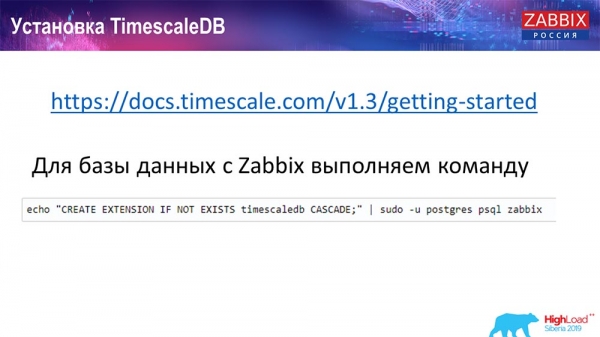
On Zabbix, we simply activate the Extention. I think that those who used Extention in Postgres… You just activate Extention, create it for the Zabbix database you are using.
And the last step...
timescaledb. Migrating History Tables
You need to create a hypertable. There is a special function for this - Create hypertable. In it, as the first parameter, specify the table that is needed in this database (for which you need to create a hypertable).
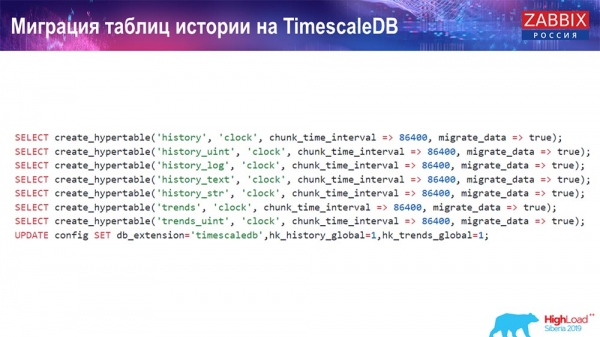
The field to create and chunk_time_interval (this is the interval of chunks (partitions to be used). 86 is one day.
migrate_data parameter: If you paste to true, then this migrates all current data into pre-created chunks.
I've used migrate_data myself - it takes a decent amount of time, depending on how big your database is. I had over a terabyte - it took over an hour to create. In some cases, when testing, I deleted the historical data for the text (history_text) and string (history_str) so as not to transfer - they were not really interesting to me.
And we make the last update in our db_extention: we set timescaledb so that the database and, in particular, our Zabbix understands that there is a db_extention. It activates it and uses the correct syntax and queries to the database, using already those "features" that are necessary for TimescaleDB.
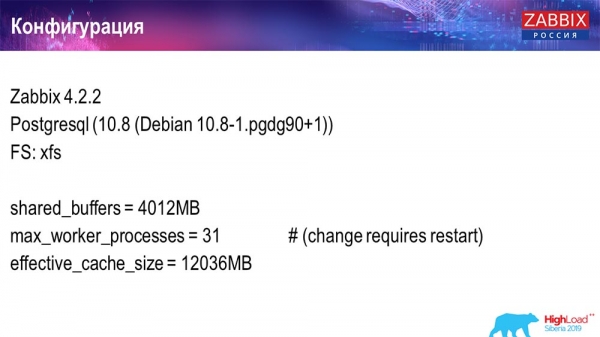
Server configuration
I used two servers. The first server is a rather small virtual machine, 20 processors, 16 gigabytes of RAM. Set up Postgres 10.8 on it:
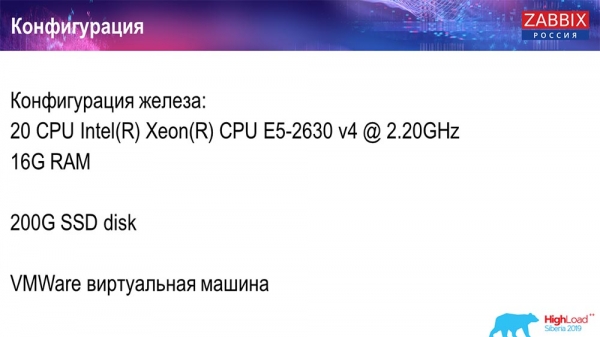
The operating system was Debian, file system – xfs. I made minimal settings to use this database specifically, minus what Zabbix itself will use. The Zabbix server, PostgreSQL, and load agents were also installed on this machine.
I used 50 active agents that use LoadableModule to quickly generate different results. It was they who generated the strings, numbers, and so on. I filled the database with a lot of data. Initially, the configuration contained 5 thousand data items per host, and about every data item contained a trigger - in order for this to be a real setup. Sometimes it even takes more than one trigger to use.
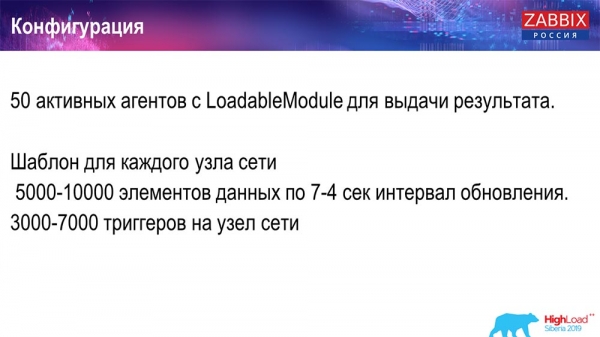
I regulated the update interval, the load itself by not only using 50 agents (adding more), but also using dynamic data elements and reducing the update interval to 4 seconds.
Performance test. PostgreSQL: 36k NVPs
The first run, the first setup I had was on pure PostreSQL 10 on this hardware (35 thousand values per second). In general, as you can see on the screen, inserting data takes fractions of a second - everything is fine and fast, SSD drives (200 gigabytes). The only thing is that 20 GB fills up fast enough.
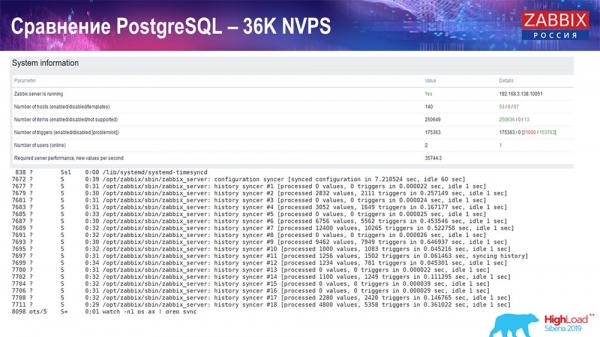
There will be a lot of such charts in the future. This is the standard performance dashboard of the Zabbix server.
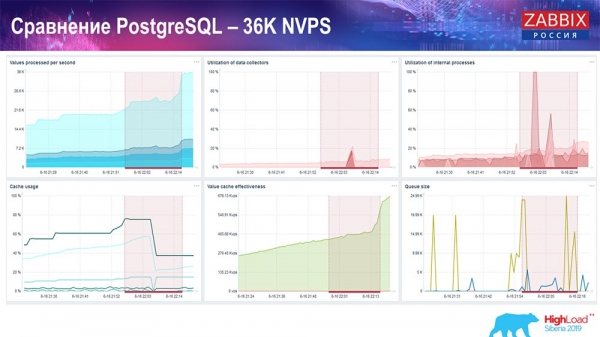
The first graph is the number of values per second (blue, top left), 35 thousand values in this case. This (top center) is loading build processes, and this (top right) is loading exactly the internal processes: history syncers and housekeeper, which here (bottom center) has been running for quite some time.
This graph (bottom center) shows ValueCache usage - how many ValueCache hits for triggers (several thousand values per second). Another important graph is the fourth one (bottom left), which shows the use of the HistoryCache I talked about, which is a buffer before inserting into the database.
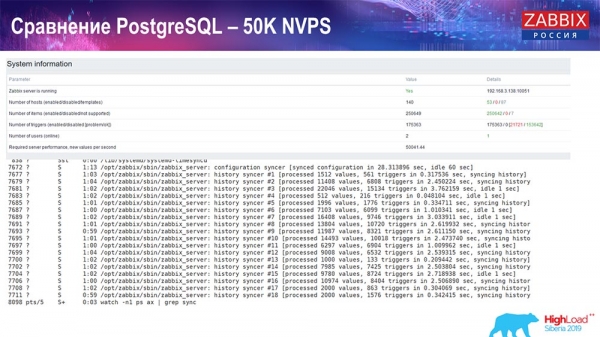
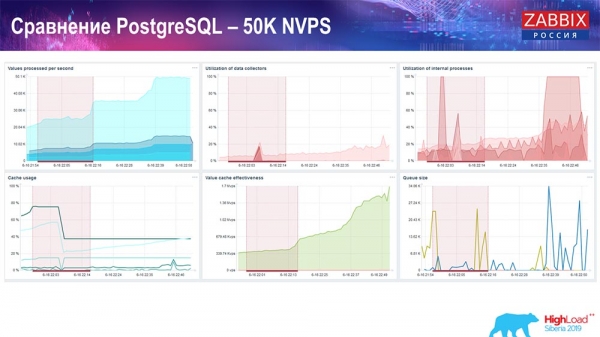
Performance test. PostgreSQL: 50k NVPs
Next, I increased the load to 50 thousand values per second on the same hardware. When loaded by the Housekeeper, 10 thousand values were already recorded in 2-3 seconds with the calculation. Which, in fact, is shown in the following screenshot:
The housekeeper is already starting to get in the way, but overall history sinker trapper usage is still at 60% (third chart, top right). HistoryCache already during the operation of the "Housekeeper" begins to actively fill up (bottom left). It was about half a gigabyte, 20% full.
Performance test. PostgreSQL: 80k NVPs
Further increased to 80 thousand values per second:
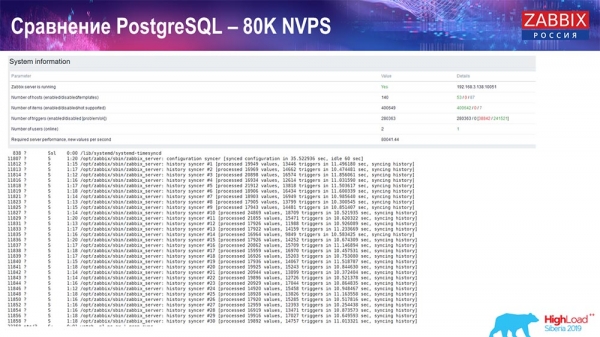
It was about 400 thousand data elements, 280 thousand triggers. The insert, as you can see, in terms of loading history sinkers (there were 30 of them) was already quite high. Then I increased various parameters: history sinkers, cache... On this hardware, the loading of history sinks began to increase to the maximum, almost “to the shelf” - accordingly, HistoryCache went to a very high load:
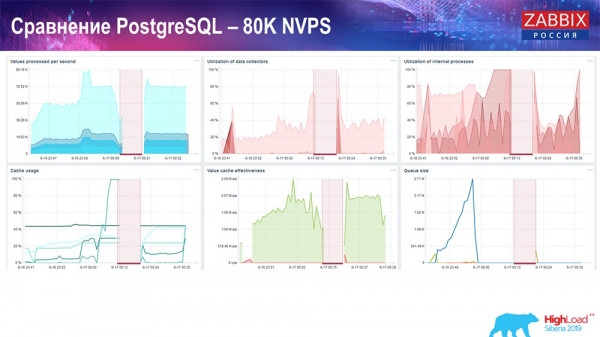
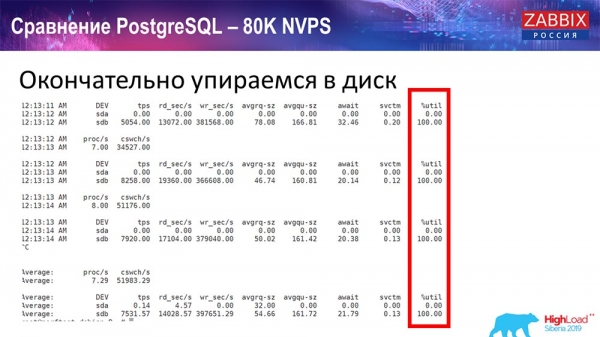
All this time I have been monitoring all the parameters of the system (how the processor is used, RAM) and found that disk utilization was maximum - I achieved the maximum capacity of this disk on this hardware, in this virtual machine. Postgres began to dump data quite actively at such an intensity, and the disk no longer had time to write, read ...
I took another server that already had 48 processors 128 gigabytes of RAM:
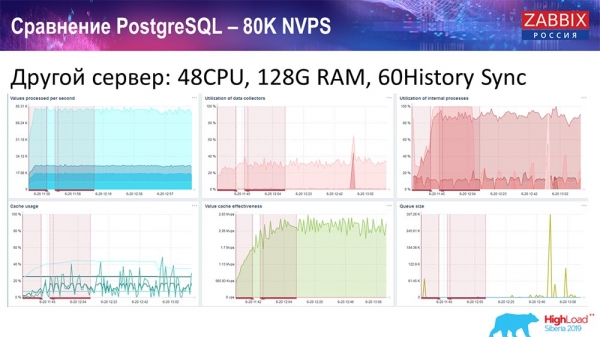
I also “tuned” it - I installed the History syncer (60 pieces) and achieved acceptable performance. In fact, we are not “in the shelf”, but this is probably the limit of productivity, where it is already necessary to do something about it.
Performance test. TimescaleDB: 80k NVPs
My main task was to use TimescaleDB. Every graph shows a dip:
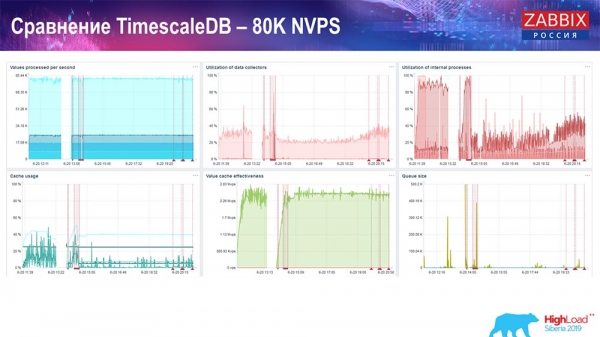
These failures are just data migration. After that, in the Zabbix server, the download profile of history-sinkers, as you can see, has changed a lot. It allows you to insert data almost 3 times faster and use less HistoryCache - accordingly, you will receive data in a timely manner. Again, 80 thousand values per second is a fairly high rate (of course, not for Yandex). In general, this is a fairly large setup, with one server.
PostgreSQL Benchmark: 120k NVPs
Next, I increased the value of the number of data elements to half a million and got a calculated value of 125 thousand per second:
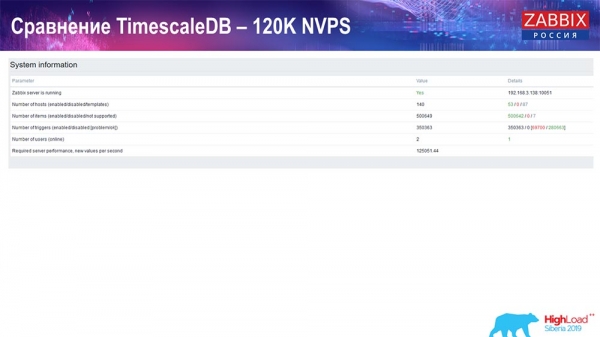
And got these charts:
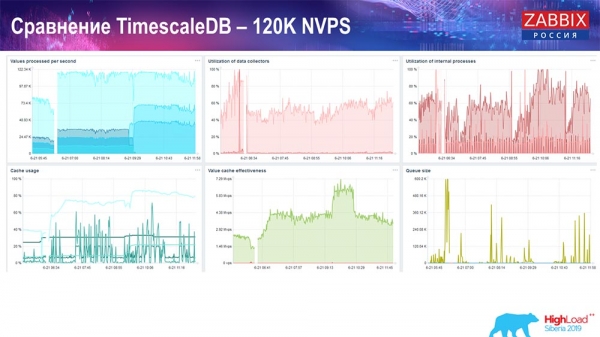
In principle, this is a working setup, it can work for quite a long time. But since I had a disk of only 1,5 terabytes, I spent it in a couple of days. Most importantly, new partitions were created on TimescaleDB at the same time, and this was completely unnoticeable for performance, which cannot be said about MySQL.
Partitions are usually created at night, because this blocks insertion and work with tables in general, and can lead to degradation of the service. In this case, it doesn't! The main task was to test the capabilities of TimescaleDB. It turned out such a figure: 120 thousand values per second.
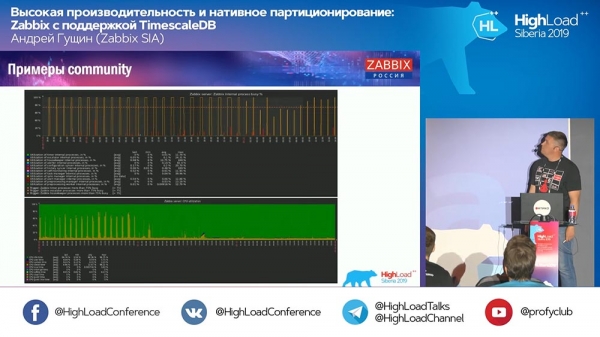
There are also examples in the "community":
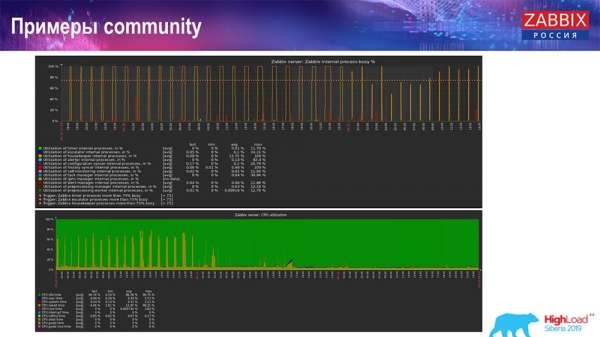
The person also turned on TimescaleDB and the load on the use of io.weight fell on the processor; and the use of internal process elements has also been reduced by the inclusion of TimescaleDB. And these are ordinary pancake disks, that is, an ordinary virtual machine on ordinary disks (not SSDs)!
For some small setups that are limited by disk performance, TimescaleDB seems to me to be a very good solution. It's a good idea to keep working before migrating to faster database hardware.
I invite you all to our events: Conference - in Moscow, Summit - in Riga. Use our channels - Telegram, forum, IRC. If you have any questions, come to our counter, we can talk about everything.
Audience questions
Question from the audience (hereinafter - A): - If TimescaleDB is so easy to set up, and it gives such a performance boost, then perhaps this should be used as the best practice for setting up Zabbix with Postgres? And are there any pitfalls and disadvantages of this solution, or still, if I decide to make Zabbix for myself, I can safely take Postgres, put Timescale there right away, use it and not think about any problems ?
AG: - Yes, I would say that it is a good recommendation to use Postgres right away with the TimescaleDB extension. As I said, a lot of good reviews, despite the fact that this "feature" is experimental. But actually tests show it's a great solution (with TimescaleDB) and I think it will evolve! We monitor how this extension develops and will correct what is needed.
We even relied on one of their well-known “features” during development: it was possible to work with chunks a little differently there. But then they cut it out in the next release, and we had to no longer rely on this code. I would recommend using this solution on many setups. If you're using MySQL... For medium setups, either solution works fine.
A: - On the latest charts, which are from the community, there was a chart with the "Housekeeper":
He continued to work. What does Housekeeper do with TimescaleDB?
AG: - Now I can’t say for sure - I’ll look at the code and tell you in more detail. It uses TimescaleDB queries not to remove chunks, but somehow aggregates. While I'm not ready to answer this technical question. At the stand today or tomorrow we will clarify.
A: - I have a similar question - about the performance of the delete operation in Timescale.
A (answer from the audience): - When you delete data from a table, if you do it through delete, then you need to go through the table - delete, clean, mark everything for future vacuum. In Timescale, since you have chunks, you can drop. Roughly speaking, you just tell the file that is in the big data: “Delete!”
Timescale simply understands that there is no such chunk anymore. And since it integrates into the query planner, it hooks your conditions in select or in other operations and immediately understands that this chunk is no more - “I won’t go there again!” (data not available). That's all! That is, a table scan is replaced by a binary file deletion, so it's fast.
A: - We have already touched on the topic not SQL. As far as I understand, Zabbix does not really need to modify the data, and all this is something like a log. Is it possible to use specialized databases that cannot change their data, but at the same time save, accumulate, give back much faster - Clickhouse, for example, something Kafka-like?.. Kafka is also a log! Is it possible to somehow integrate them?
AG: - Unloading can be done. We have a certain “feature” since version 3.4: you can write all historical files, events, everything else to files; and then send some handler to any other database. In fact, many people rework and write directly to the database. On the fly, history sinkers write all this to files, rotate these files, and so on, and you can transfer this to Clickhouse. I can't say what the plans are, but perhaps further support for NoSQL solutions (such as Clickhouse) will continue.
A: – In general, it turns out that you can completely get rid of postgres?
AG: - Of course, the most difficult part in Zabbix is the historical tables, which create the most problems, and events. In this case, if you do not store events for a long time and store the history with trends in some other fast storage, then in general, I think there will be no problems.
A: - Can you estimate how much faster everything will work if you switch to Clickhouse, for example?
AG: - I haven't tested it. I think that at least the same numbers can be achieved quite simply, given that Clickhouse has its own interface, but I can’t say for sure. Better to test. It all depends on the configuration: how many hosts you have and so on. Insertion is one thing, but you also need to take this data - Grafana or something else.
A: - That is, we are talking about an equal fight, and not about the big advantage of these fast databases?
AG: - I think when we integrate, there will be more accurate tests.
A: Where did the good old RRD go? What made you switch to SQL databases? Initially, all metrics were collected on RRD.
AG: - In "Zabbix" RRD, maybe in a very ancient version. There have always been SQL databases - a classic approach. The classic approach is MySQL, PostgreSQL (they have been around for a very long time). We almost never used a common interface for SQL and RRD databases.

Some ads 🙂
Thank you for staying with us. Do you like our articles? Want to see more interesting content? Support us by placing an order or recommending to friends, , a unique analogue of entry-level servers, which was invented by us for you: (available with RAID1 and RAID10, up to 24 cores and up to 40GB DDR4).
Dell R730xd 2 times cheaper in Equinix Tier IV data center in Amsterdam? Only here in the Netherlands! Dell R420 - 2x E5-2430 2.2Ghz 6C 128GB DDR3 2x960GB SSD 1Gbps 100TB - from $99! Read about
Source: habr.com
