

Like in , a problem arose with the distributed service, let’s call this service Alvin. This time I didn’t discover the issue myself; it was reported to me by the guys from the client side.
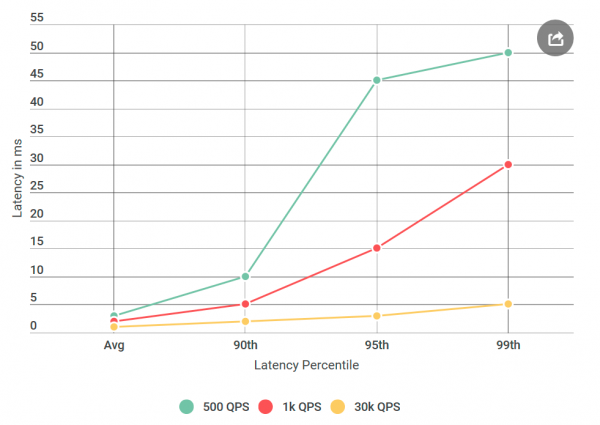
One day I woke up to an unhappy email due to high latencies from Alvin, which we planned to launch soon. Specifically, the client faced a 99th percentile latency around 50 ms, significantly above our latency budget. This was surprising as I had thoroughly tested the service, especially for latencies, as this is a frequent complaint.
Before handing Alvin over for testing, I conducted many experiments with 40k requests per second (QPS), all showing latency of less than 10 ms. I was ready to state that I disagreed with their results. But upon a closer look at the email, I noticed something new: I hadn't tested the conditions they mentioned; their QPS was much lower than mine. I tested at 40k QPS, while they only did so at 1k. I ran another experiment, this time with a lower QPS, just to appease them.
Since I’m writing about this in a blog — you probably already guessed: their numbers turned out to be correct. I checked my virtual client over and over again, always with the same result: a low number of requests not only increases latency but also increases the number of requests with latency over 10 ms. In other words, if at 40k QPS about 50 requests per second exceeded 50 ms, then at 1k QPS there were 100 requests per second above 50 ms. Paradox!
Narrowing down the search
When faced with a latency problem in a distributed system with many components, the first step is to create a shortlist of suspects. Let’s dig a little deeper into the architecture of Alvin:
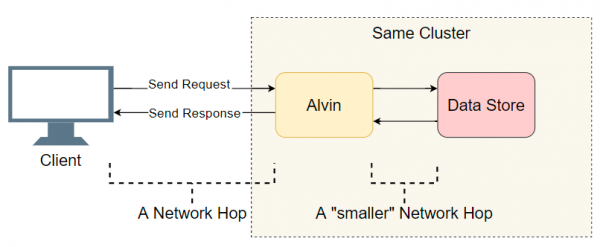
A good starting point is a list of executed input-output transitions (network calls/disc searches, etc.). Let’s try to find out where the delay is. Besides the obvious input-output with the client, Alvin takes an additional step: it calls the data store. However, this store operates in the same cluster as Alvin, so the latency there should be lower than with the client. So, the list of suspects:
- Network call from the client to Alvin.
- Network call from Alvin to the data store.
- Disk search in the data store.
- Network call from the data store to Elvin.
- Network call from Elvin to the client.
Let's try to cross out some points.
The data store is not at fault.
First, I transformed Elvin into a ping-ping server that does not process requests. Upon receiving a request, it returns an empty response. If the latency decreases, then the issue lies with Elvin's implementation or the data store—nothing extraordinary. In the first experiment, we get the following chart:
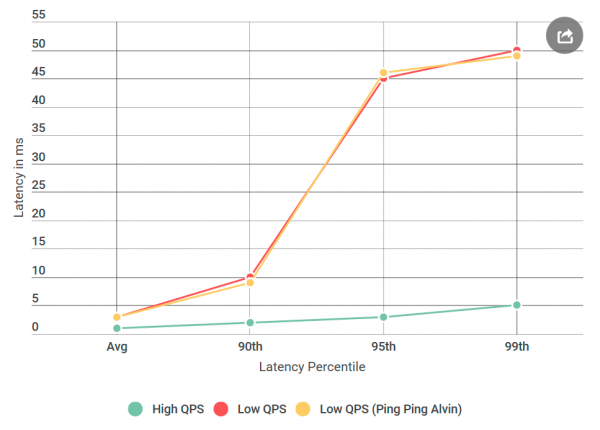
As we can see, using a ping-ping server shows no improvements. This means that the data store does not increase latency, and the list of suspects is cut in half:
- Network call from the client to Alvin.
- Network call from Elvin to the client.
Great! The list is quickly shrinking. I thought I almost figured out the reason.
gRPC
Now it's time to introduce a new player: . This is an open-source library from Google for inter-process communication. . Although gRPC it is well optimized and widely used, this is the first time I used it in a system of this scale, and I expected my implementation to be suboptimal—mildly speaking.
The presence of gRPC in the stack raised a new question: could it be my implementation or the library itself gRPC causing the latency issue? Adding a new suspect to the list:
- The client calls the library,
gRPC - Library
gRPCon the client performs the library's network callgRPCon the server - Library
gRPCcontacts Elvin (no operation in the case of a ping-pong server).
To give you an idea of what the code looks like, my implementation of the client/Elvin is not much different from typical client-server .
Note: the list above is somewhat simplified, as
gRPCit allows for a custom (template?) threading model where the execution stackgRPCand user implementation intertwine. For simplicity, let's stick to this model.
Profiling will fix everything.
After ruling out the data stores, I thought I was almost done: 'Now it's easy! We'll apply profiling and find out where the latency occurs.' I because CPUs are very fast and are usually not the bottleneck. Most latency happens when the CPU has to stop processing to do something else. Precise CPU profiling is designed just for this: it accurately records all and helps understand where delays occur.
I took four profiles: one for high QPS (low latency) and one with a ping-pong server at low QPS (high latency), both on the client side and the server side. And just in case, I also took a sample CPU profile. When comparing profiles, I usually look for anomalous call stacks. For example, on the bad side with high latency, there are many more context switches (10 times or more). But in my case, the number of context switches was nearly the same. To my dismay, there was nothing significant.
Additional debugging
I was in despair. I didn't know what other tools to use, and my next plan was essentially to repeat the experiments with different variations rather than clearly diagnosing the problem.
What if
From the very beginning, I was concerned about the specific latency time of 50 ms. That's a very high latency. I decided to cut pieces out of the code until I could figure out exactly which part was causing the issue. Then came the experiment that worked.
As usual, in hindsight, everything seems obvious. I placed the client on one machine with Elvin — and sent a request to localhost. And the increase in latency disappeared!
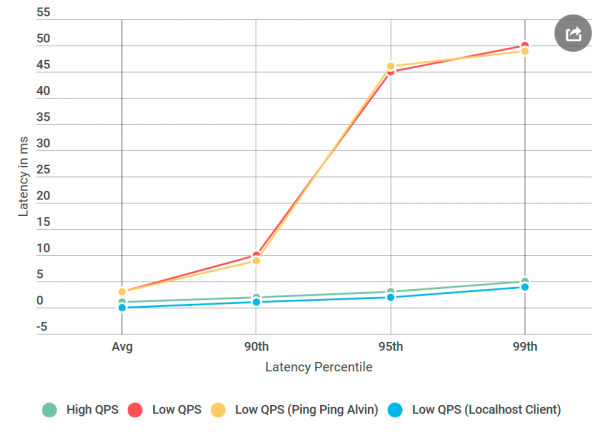
Something was wrong with the network.
Acquiring networking skills
I must admit: my knowledge of networking technologies is terrible, especially considering that I work with them daily. But the network was the main suspect, and I needed to learn how to debug it.
Fortunately, the internet loves those who want to learn. A combination of ping and tracert seemed like a good start for debugging transport issues.
First, I ran on Elvin's TCP port. I used the default settings — nothing special. Out of more than a thousand pings, none exceeded 10 ms except the first one for warm-up. This contradicts the observed 50 ms latency increase in the 99th percentile: for every 100 requests, we should see about one request with a latency of 50 ms.
Then I tried : maybe the issue lies with one of the nodes on the route between Elvin and the client. But the tracer also came back empty-handed.
Thus, the cause of the latency was not my code, not the gRPC implementation, and not the network. I was starting to worry that I would never understand this.
Now, which OS are we on?
gRPC is widely used in Linux, but it's an exotic option for Windows. I decided to run an experiment that worked: I created a Linux virtual machine, compiled Alvin for Linux, and deployed it.
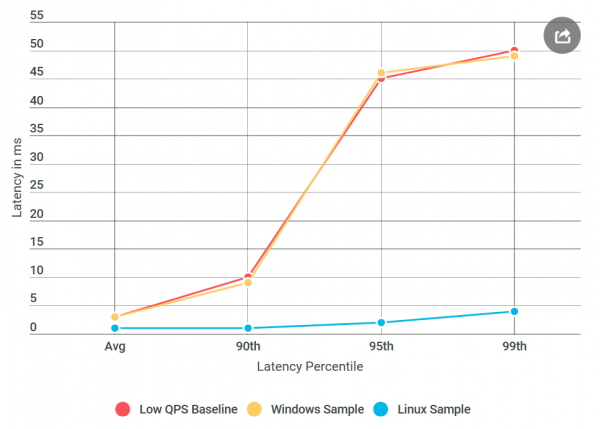
And here's what happened: the ping-pong server on Linux did not have the same latencies as the corresponding Windows node, even though the data source did not differ. It turns out the problem lies in the gRPC implementation for Windows.
Nagle's Algorithm
Throughout this time, I thought I was missing a flag. gRPCNow I understand that what was actually missing was gRPC the Windows flag. I found the internal RPC library, which I was sure worked well with all installed flags . Then I added all these flags to gRPC and deployed Alvin on Windows, in the fixed ping-pong server under Windows!
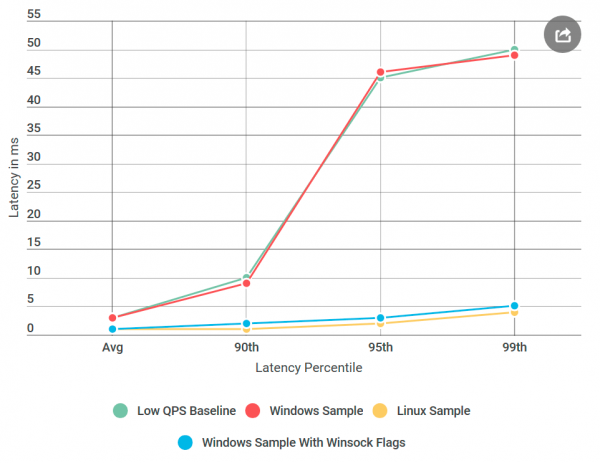
Almost ready: I started removing the added flags one by one until the regression came back, so I could precisely identify its cause. It was the infamous Nagle's Algorithm switch.
aims to reduce the number of packets sent over the network by delaying message transmission until the packet size exceeds a certain number of bytes. While this may be pleasant for the average user, it is destructive for real-time servers, as the OS will hold back some messages, causing delays at low QPS. This flag was set in the Linux implementation for TCP sockets, but not for Windows. I gRPC The significant latency at low QPS was caused by OS optimization. Looking back, profiling did not reveal the delay because it was done in kernel mode and not in .
Conclusion
user mode. As for the localhost experiment, it likely did not involve the actual network code, and Nagle's algorithm did not trigger, so the latency issues disappeared when the client accessed Alvin via localhost.
Next time you see an increase in latency when reducing the number of requests per second, Nagle's algorithm should be on your list of suspects!
Like in most posts, there was a problem with the distributed service, let's call this service Alvin.
Source: habr.com
