

In IT, there is a superstition: 'If it works, don't touch it.' This can also be said about our monitoring system. At Southbridge, we use Zabbix — when we chose it, it was very impressive. Essentially, it had no alternatives.
Over time, our ecosystem has grown with instructions, additional addons, and integration with Redmine. Zabbix has gained a powerful competitor that excels in many aspects: performance speed, high availability almost out of the box, beautiful visualization, and optimization for working in Kubernetes environments.
But we are not in a hurry to switch. We decided to take a peek at Zabbix and inquire about what features they plan to implement in upcoming releases. We didn’t hold back and asked challenging questions to Sergey Sorokin, the Director of Development at Zabbix, and Vitaly Zhuravlev, the Solution Architect. What came of that, read on.
1. Tell us about the company's history. How was the product idea born?
The company's history began in 1997 when the founder and owner, Alexey Vladyshev, worked as a database administrator at a bank. Alexey found it inefficient to manage databases without having historical data on various parameters and an understanding of the current and historical state of the environment.
At that time, the monitoring solutions available on the market were very expensive, unwieldy, and resource-intensive. Therefore, Alexey started writing various scripts that allowed him to effectively monitor his part of the infrastructure. This turned into a hobby. Alexey changed jobs but maintained his interest in the project. In 2000-2001, the project was rewritten from scratch — and Alexey contemplated enabling other administrators to use his developments. The question arose as to under what license to release the existing code. Alexey decided to release it under the GPLv2 license. The tool was quickly noticed in the professional community. Over time, requests for support, training, and software enhancements began to come to Alexey. The number of such orders consistently increased. Thus, the decision to establish a company came about naturally. The company was founded on April 12, 2005.
2. What key milestones can you identify in the development history of Zabbix?
There are currently several milestones:
a. Alexey began working on scripts — 1997.
b. Publication of the code under GPLv2 — 2001.
c. Establishment of Zabbix LLC — 2005.
d. Signing the first partnership agreements, creating a partnership program — 2007.
e. Establishment of Zabbix Japan LLC — 2012.
f. Establishment of Zabbix LLC (USA) — 2015.
g. Establishment of Zabbix LLC — 2018.
3. How many people do you have working for you?
Currently, the Zabbix group of companies employs just over 70 people: developers, testers, project managers, support engineers, consultants, salespeople, and marketing staff.
4. How do you write a roadmap, do you collect feedback from users? How do you determine where to go next?
When creating the roadmap for the next version of Zabbix, we focus on the following important factors, gathering the roadmap under the following categories:
a. Strategic improvements for Zabbix. Something that Zabbix considers very important. For example, Zabbix agent written in Go.
b. Things that Zabbix clients and partners want to see and for which they are willing to pay.
c. Requests/suggestions from the Zabbix community.
d. Technical debts. 🙂 Things that we released in previous versions but did not provide full functionality for, did not make flexible enough, or did not offer all options.
5. Can you compare Zabbix and Prometheus? What is better in Zabbix, and what is worse?
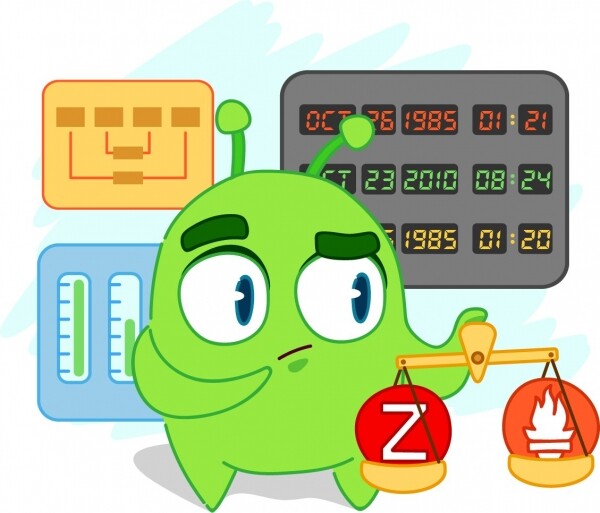
The main difference, in our opinion, is that Prometheus is primarily a metrics collection system — and to achieve full monitoring in an enterprise, many additional components need to be added to Prometheus, such as Grafana for visualization, a separate long-term storage, separate management for issues, and separate handling of logs…
There will be no standard monitoring templates in Prometheus, and after receiving all the thousands of metrics from exporters, you will need to independently identify problematic signals within them. Configuring Prometheus involves configuration files. In some cases, this is more convenient; in others, it is not.
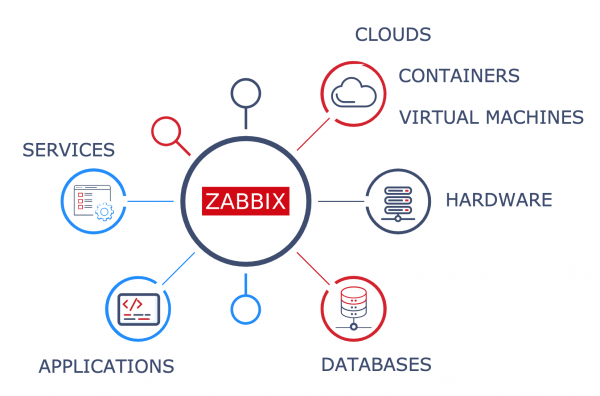
Zabbix is a versatile platform for creating monitoring systems from start to finish. We offer our own visualization, problem correlation and display, access rights management, audit trails, numerous options for data collection via agents, proxies, and various protocols, and the ability to quickly extend the system with plugins, scripts, and modules.
Data can simply be collected as is, for example via the HTTP protocol, and then transformed into useful metrics using preprocessing functions like JavaScript, JSONPath, XMLPath, CSV, and similar tools. Many users appreciate Zabbix for its web interface that allows for system configuration and management, the option to describe standard monitoring configurations as templates to share, and for containing not only metrics but also detection rules, thresholds, graphs, and descriptions—a complete set of objects for monitoring typical resources.
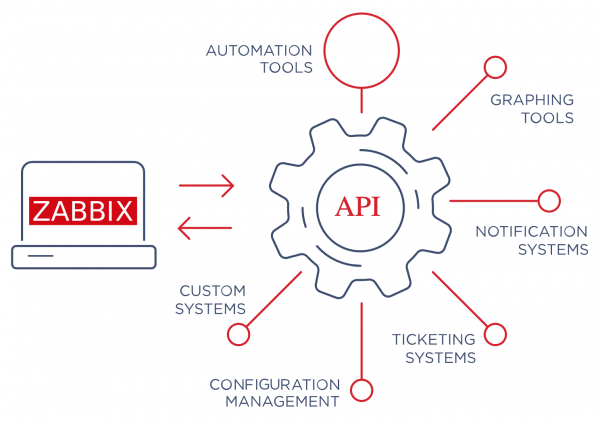
Many also enjoy the ability to automate management and configuration through the Zabbix API. In general, we don't want to start a holy war. We believe that both systems are well-suited to their respective tasks and can complement each other harmoniously. For example, starting from version 4.2, Zabbix can gather data from Prometheus exporters or from itself.
6. Have you considered creating Zabbix as a SaaS solution?
We have, and we will realize it in the future, but we want to ensure that this solution is as convenient as possible for clients. In this case, standard Zabbix should be offered alongside communication tools and enhanced data collection methods.
7. When can we expect Zabbix HA? And should we expect it?
Zabbix HA is definitely coming. We are very hopeful to see something in Zabbix 5.0 LTS, but the situation will become clearer in November 2019 when the Zabbix 5.0 Roadmap is fully confirmed.
8. Why does the media type have such a limited selection out of the box? Are you planning to add Slack, Telegram, and so on? Does anyone still use Jabber?
Jabber was removed in version 4.4 of Zabbix, but Webhooks were added instead. Regarding media types, we don't want to create specific applications within the system, but rather standard messaging tools. It's no secret that many of these chats or service desks have API access via HTTP—hence the situation will change this year with the release of version 4.4.
With the introduction of webhooks in Zabbix, we can expect all the most sought-after integrations out of the box soon. These integrations will be two-way, not just simple one-way notifications. As for the media types we can't reach, our community will handle that — now, a media type can be fully exported to a configuration file, shared on share.zabbix.com or GitHub. Other users will just need to import the file to start using such an integration. No additional scripts will need to be installed!
9. Why hasn't the Virtual Machine Discovery feature developed? There’s only VMware. Many are waiting for integration with EC2 and OpenStack.
No, the feature is evolving. For example, version 4.4 introduced datastore discovery through the vm.datastore.discovery key. Version 4.4 also added some great WMI keys, and we expect that together with the perf_counter_en key, it will enable good monitoring of Hyper-V. Additionally, there will be other significant changes in this area in Zabbix 5.0.
10. Have you considered abandoning templates and doing things like Prometheus, where everything that's available is collected?
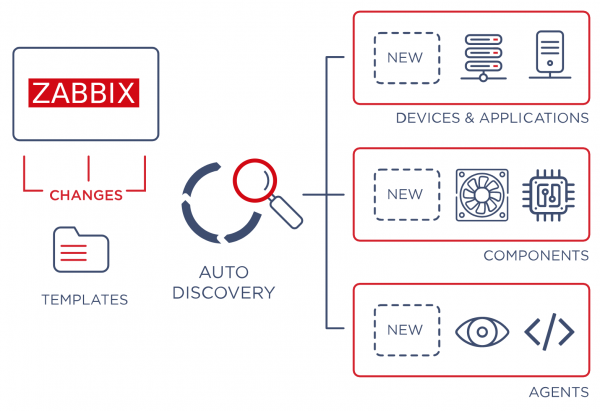
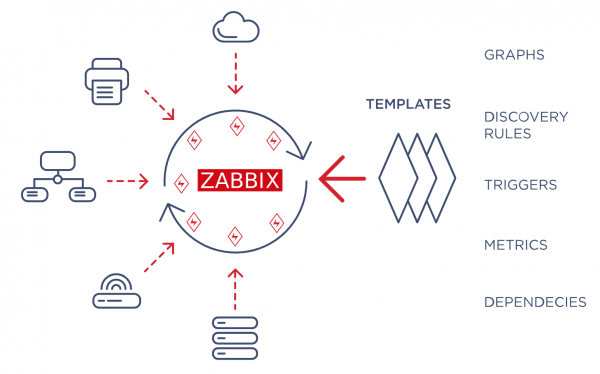
Prometheus automatically collects all metrics, which is convenient. However, a template is more than just a set of metrics; it’s a ‘container’ that holds all necessary standard monitoring configurations for a given type of resource or service. It includes a set of essential triggers, graphs, detection rules, and descriptions of metrics and threshold values, helping users understand what's being collected and which thresholds are checked and why. Moreover, templates can be easily shared with other users, enabling them to achieve good monitoring of their systems without necessarily being experts.
11. Why are there so few metrics out of the box? This complicates setup from an operational standpoint.
If by out of the box you mean ready-made templates, we are currently working on expanding and improving our templates. Zabbix 4.4 was released with a new, improved set and better features.
For Zabbix, you can always find a ready-made template for almost any system on share.zabbix.com. However, we decided that we should create basic templates ourselves, setting an example for others and freeing users from having to write a template for MySQL once again. Therefore, now there will be officially more Zabbix templates with each version.
12. When will it be possible to build triggers not tied to hosts, but, for example, based on labels? For instance, we monitor the site from n different points, and we want a simple trigger that activates when the site is unavailable from 2 or more locations.
In fact, this functionality has been available in Zabbix for several years, developed for one of our clients. The client is ICANN. Similar checks can also be made, for example, through aggregated items or using the Zabbix API. We are currently working hard to simplify the creation of such checks.
P.S.: During one of the Slyrms, Zabbix developers asked us what we wanted to see in the product to monitor Kubernetes clusters specifically with Zabbix, rather than Prometheus.
It's great when developers listen to their clients instead of working in isolation. Now we approach every release with genuine interest — it’s encouraging to see more and more features we’ve talked about coming to fruition.
As long as developers do not shut themselves off and are interested in client needs, the product lives and evolves. We will keep an eye on new Zabbix releases.
P.P.S.: In a few months, we will launch an online course on monitoring. If you're interested, subscribe so you don't miss the announcement. Meanwhile, you can take our .
Source: habr.com
