

Currently, there are proprietary solutions available for monitoring IP (TS) streams, such as and , which have a rich set of features and are typically available from large operators dealing with TV services. This article describes a solution based on the open source project , designed for minimal monitoring of IP (TS) streams through a continuity counter (CC) and bitrate. One possible application is monitoring for packet loss or total loss of the stream via a leased L2 channel (which cannot be properly monitored, for example, by reading loss counters in queues).
A Brief Overview of TSDuck
TSDuck is open source software (2-Clause BSD license) consisting of a set of console utilities and a library for developing custom utilities or plugins for handling TS streams. It can accept input from IP (multicast/unicast), HTTP, HLS, DVB tuners, Dektec DVB-ASI demodulators, and includes a built-in TS stream generator for reading from files. Outputs can be to a file, IP (multicast/unicast), HLS, Dektec DVB-ASI and HiDes modulators, players (mplayer, VLC, xine), and drop. Various traffic processors can be included between input and output, such as PID remapping, scrambling/descrambling, CC counter analysis, bitrate counting, and other common TS stream operations.
In this article, IP (multicast) streams will be used as input alongside the bitrate_monitor processors (which is self-explanatory) and continuity (for CC counter analysis). It is easy to replace IP multicast with another type of input supported by TSDuck.
There are of TSDuck for most current operating systems. There are none for Debian, but it was relatively easy to compile for Debian 8 and Debian 10.
The version of TSDuck used is 3.19-1520, with Linux as the operating system (Debian 10 was used for preparing the solution, while CentOS 7 was used for actual deployment).
Setting Up TSDuck and the OS
Before monitoring real flows, it's essential to ensure that TSDuck is functioning correctly without any drops at the network card or OS (socket) level. This is necessary to avoid guessing where the drops occurred—whether on the network or "inside the server." You can check for drops at the network card level using the command ethtool -S ethX; tuning can also be done with ethtool (typically, you need to increase the RX buffer (-G) and sometimes disable certain offloads (-K)). As a general recommendation, it's advisable to use a separate port for receiving the analyzed traffic if possible, as this minimizes false positives related to drops occurring specifically on the analyzer port due to other traffic. If this is not feasible (using a mini-computer/NUC with a single port), it's highly recommended to prioritize the analyzed traffic relative to other traffic on the device to which the analyzer is connected. When it comes to virtual environments, one must exercise caution and be able to find packet drops starting from the physical port all the way to the application inside the virtual machine.
Generating and receiving traffic within the host
As the first step in preparing TSDuck, we will generate and receive traffic within a single host using netns.
Preparing the environment:
ip netns add P #creating netns P where traffic analysis will take place
ip link add type veth #creating a veth pair - keep veth0 in the default netns (traffic will be generated on this interface)
ip link set dev veth1 netns P #move veth1 to netns P (traffic will be received on this interface)
ip netns exec P ifconfig veth1 192.0.2.1/30 up #assigning IP to veth1, the exact IP doesn't matter
ip netns exec P ip ro add default via 192.0.2.2 #setting up the default route inside netns P
sysctl net.ipv6.conf.veth0.disable_ipv6=1 #disabling IPv6 on veth0 to prevent unrelated garbage from counting in the TX counter
ifconfig veth0 up #bringing up the veth0 interface
ip route add 239.0.0.1 dev veth0 #creating a route so that the OS directs traffic toward 239.0.0.1 on veth0
The environment is ready. Starting the traffic analyzer:
ip netns exec P tsp --realtime -t
 -I ip 239.0.0.1:1234
 -P continuity
 -P bitrate_monitor -p 1 -t 1
 -O drop
where "-p 1 -t 1" means that the bitrate should be calculated every second, and information about the bitrate should be output every second
Starting the traffic generator at a speed of 10 Mbps:
tsp -I craft
 -P regulate -b 10000000
 -O ip -p 7 -e --local-port 6000 239.0.0.1:1234
where "-p 7 -e" means to pack 7 TS packets into 1 IP packet and to do this strictly (-e), i.e., always wait for 7 TS packets from the last processor before sending the formed IP packet.
The analyzer starts outputting expected messages:
* 2020/01/03 14:55:44 - bitrate_monitor: 2020/01/03 14:55:44, TS bitrate: 9,970,016 bits/s
* 2020/01/03 14:55:45 - bitrate_monitor: 2020/01/03 14:55:45, TS bitrate: 10,022,656 bits/s
* 2020/01/03 14:55:46 - bitrate_monitor: 2020/01/03 14:55:46, TS bitrate: 9,980,544 bits/s
Now let's add some drops:
ip netns exec P iptables -I INPUT -d 239.0.0.1 -m statistic --mode random --probability 0.001 -j DROPand messages of this type appear:
* 2020/01/03 14:57:11 - continuity: packet index: 80,745, PID: 0x0000, missing 7 packets
* 2020/01/03 14:57:11 - continuity: packet index: 83,342, PID: 0x0000, missing 7 packets
which is expected. We disable packet loss (ip netns exec P iptables -F) and try to increase the generator bitrate to 100Mbps. The analyzer reports a lot of CC errors and about 75 Mbps instead of 100. We try to figure out who is to blame — whether it’s the generator not keeping up or it's not the issue at all; for this, we start generating a fixed number of packets (700,000 TS packets = 100,000 IP packets):
# ifconfig veth0 | grep TX
       TX packets 151825460  bytes 205725459268 (191.5 GiB)
        TX errors 0  dropped 0 overruns 0  carrier 0  collisions 0
# tsp -I craft -c 700000 -P regulate -b 100000000 -P count -O ip -p 7 -e --local-port 6000 239.0.0.1:1234
* count: PID    0 (0x0000):    700,000 packets
# ifconfig veth0 | grep TX
        TX packets 151925460  bytes 205861259268 (191.7 GiB)
        TX errors 0  dropped 0 overruns 0  carrier 0  collisions 0
As seen, exactly 100,000 IP packets were generated (151925460-151825460). Now we investigate what is happening with the analyzer; for this we check the RX counter on veth1, which strictly matches the TX counter on veth0, and then see what is happening at the socket level:
# ip netns exec P cat /proc/net/udp
  sl  local_address rem_address   st tx_queue rx_queue tr tm->when retrnsmt   uid  timeout inode ref pointer drops
  133: 010000EF:04D2 00000000:0000 07 00000000:00000000 00:00000000 00000000     0        0 72338 2 00000000e0a441df 24355
Here we see the number of drops = 24355. In TS packets, this is 170485 or 24.36% of 700,000; thus, we see that those 25% of lost bitrate are drops in the UDP socket. Drops in the UDP socket usually occur due to buffer shortages, so we check what the default socket buffer size and the maximum socket buffer size are:
# sysctl net.core.rmem_default
net.core.rmem_default = 212992
# sysctl net.core.rmem_max
net.core.rmem_max = 212992
Thus, if applications do not explicitly request the buffer size, sockets are created with a buffer size of 208 KB, but if they request more, they still won’t get the requested amount. Since in tsp for IP input we can set the buffer size (—buffer-size), we will not touch the default socket size, but will only set the maximum socket buffer size and specify the buffer size explicitly through tsp arguments:
sysctl net.core.rmem_max=8388608
ip netns exec P tsp --realtime -t -I ip 239.0.0.1:1234 -b 8388608 -P continuity -P bitrate_monitor -p 1 -t 1 -O drop
With this socket buffer tuning, the reported bitrate is now approximately 100 Mbps, and there are no CC errors.
By CPU usage of the tsp application itself. For a single i5-4260U CPU @ 1.40GHz core, analyzing a 10 Mb/s stream consumes 3-4% CPU, 100 Mb/s — 25%, 200 Mb/s — 46%. Setting a % packet loss does not significantly increase CPU load (but it can decrease).
On more powerful hardware, it was possible to generate and analyze streams exceeding 1 Gb/s without any problems.
Testing on real network cards
After testing on a veth pair, you need to take two hosts or two ports of one host, connect the ports together, run the generator on one, and the analyzer on the other. There were no surprises here, but it actually all depends on the hardware; the weaker it is, the more interesting it will be.
Using the data obtained by the monitoring system (Zabbix)
The tsp has no machine-readable API like SNMP or similar. CC messages need to be aggregated at least every second (with a high packet loss percentage, there can be hundreds/thousands/tens of thousands per second, depending on the bitrate).
Thus, to save information and draw graphs of CC errors and bitrate, there can be the following options for handling any issues:
- Parse and aggregate the tsp output (by CC), i.e., transform it into the required format.
- Enhance the tsp itself and/or the bitrate_monitor and continuity processor plugins to deliver results in a machine-readable format suitable for the monitoring system.
- Write your application on top of the tsduck library.
Obviously, in terms of labor costs, option 1 is the simplest, especially considering that tsduck itself is written in a low-level (by modern standards) language (C++).
A simple prototype parser+aggregator in bash showed that with a 10 Mb/s stream and 50% packet loss (the worst-case scenario), the bash process consumed 3-4 times more CPU than the tsp process itself. This scenario is unacceptable. Below is a piece of this prototype.
Noodle on bash
#!/usr/bin/env bash

missingPackets=0
ccErrorSeconds=0
regexMissPackets='^* (.+) - continuity:.*missing ([0-9]+) packets$'
missingPacketsTime=""

ip netns exec P tsp --realtime -t -I ip -b 8388608 "239.0.0.1:1234" -O drop -P bitrate_monitor -p 1 -t 1  -P continuity 2>&1 |
while read i
do
    #line example:* 2019/12/28 23:41:14 - continuity: packet index: 6,078, PID: 0x0100, missing 5 packets
    #line example 2: * 2019/12/28 23:55:11 - bitrate_monitor: 2019/12/28 23:55:11, TS bitrate: 4,272,864 bits/s
    if [[ "$i" == *continuity:* ]]
    then
        if [[ "$i" =~ $regexMissPackets ]]
        then
            missingPacketsTimeNew="${BASH_REMATCH[1]}" #timestamp (seconds)
            if [[ "$missingPacketsTime" != "$missingPacketsTimeNew" ]] #new second with CC error
            then
                ((ccErrorSeconds += 1))
            fi
            missingPacketsTime=$missingPacketsTimeNew
            packets=${BASH_REMATCH[2]} #TS missing packets
            ((missingPackets += packets))
        fi
    elif [[ "$i" == *bitrate_monitor:* ]]
    then
        : #...
    fi
done
In addition to working unacceptably slowly, bash lacks proper threads; bash jobs are independent processes, and it was necessary to record the value of missingPackets every second on the side effect (when receiving messages about the bitrate, which arrive every second). As a result, bash was left alone, and it was decided to write a wrapper (parser + aggregator) in Golang. The CPU consumption of similar code in Golang is 4-5 times lower than that of the tsp process. The speedup of the wrapper by replacing bash with Golang resulted in about a 16-fold improvement, and overall the result is acceptable (CPU overhead is 25% in the worst case). The source file in Golang is located .
Launching the wrapper
To launch the wrapper, a simple service template for systemd has been created (). It is assumed that the wrapper itself is compiled into a binary file (go build tsduck-stat.go) and placed in /opt/tsduck-stat/. It is also assumed that Golang with support for monotonic clock (>=1.9) is used.
To create an instance of the service, you need to execute the command systemctl enable tsduck-stat@239.0.0.1:1234, and then start it using systemctl start tsduck-stat@239.0.0.1:1234.
Discovery from Zabbix
To enable Zabbix to discover running services, a (discovery.sh) has been created in the format required for Zabbix discovery; it is assumed to be placed in /opt/tsduck-stat. To run discovery via the zabbix-agent, you need to add to the directory with zabbix-agent configurations to add a user parameter.
Zabbix Template
(tsduck_stat_template.xml) contains a discovery rule, data item prototypes, graphs, and triggers.
A brief checklist (in case someone wants to use it)
- Ensure that tsp does not drop packets under 'ideal' conditions (the generator and analyzer are connected directly); if there are any drops, see point 2 or the relevant article.
- Tune the maximum socket buffer (net.core.rmem_max=8388608).
- Compile tsduck-stat.go (go build tsduck-stat.go).
- Place the service template in /lib/systemd/system.
- Start the services using systemctl, check that the counters are starting to appear (grep '' /dev/shm/tsduck-stat/*). The number of services should match the number of multicast streams. It may be necessary to create a route to the multicast group, possibly disable rp_filter, or create a route to the source IP.
- Run discovery.sh, and ensure that it generates JSON.
- Provide the zabbix-agent configuration and restart the zabbix-agent.
- Download the template into Zabbix, apply it to the host being monitored and where the Zabbix agent is installed, wait about 5 minutes, then check to see if new data items, graphs, and triggers have appeared.
Result
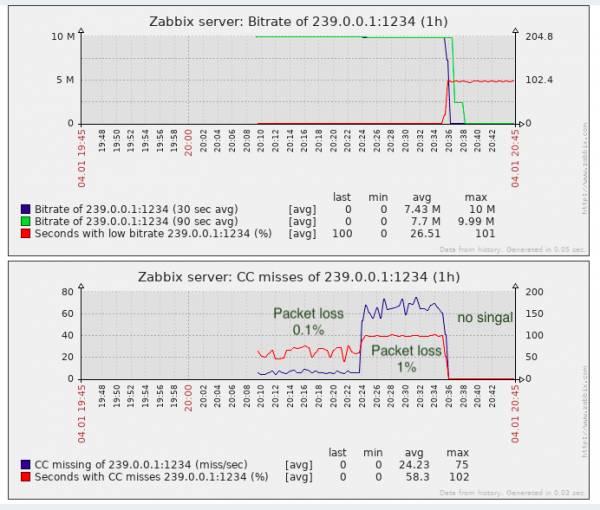
For the task of detecting packet loss, this is almost sufficient; in fact, it's better than having no monitoring at all.
Indeed, CC 'losses' can occur when video segments are stitched together (as far as I know, this is how inserts are made at local television centers in Russia, i.e., without counting the CC counter), so this needs to be remembered. In proprietary solutions, this issue is partially avoided by detecting SCTE-35 markers (if they are added by the stream generator).
From the perspective of transport quality monitoring, there is a lack of jitter (IAT) monitoring since TV equipment (whether modulators or end devices) has requirements for this parameter, and it's not always possible to inflate the jitbuffer indefinitely. Jitter can shift when transit uses equipment with large buffers and QoS settings for transmitting such real-time traffic are not configured or not well configured enough.
Source: habr.com
