

Note: translation.: We present to you the technical details regarding the causes of the recent downtime of the cloud service managed by the creators of Grafana. This is a classic example of how a new and seemingly beneficial feature, aimed at improving infrastructure quality, can become a detriment if numerous nuances of its application in production realities are not considered. It's remarkable that such materials emerge, allowing us to learn not only from our mistakes. Details can be found in the translation of this text by the Vice President of Product at Grafana Labs.

On Friday, July 19, the Hosted Prometheus service in Grafana Cloud ceased functioning for approximately 30 minutes. I apologize to all clients affected by the outage. Our mission is to provide the necessary monitoring tools, and we understand that their unavailability complicates your life. We take this incident very seriously. This note explains what happened, how we responded, and what we are doing to ensure that this does not happen again.
Background
The Grafana Cloud Hosted Prometheus service is based on — a CNCF project focused on building a horizontally scalable, highly available, multi-tenant Prometheus service. The Cortex architecture consists of a set of individual microservices, each of which performs its own function: replication, storage, query handling, etc. Cortex is actively developed, continuously gaining new features and improving performance. We regularly deploy new Cortex releases to clusters so that clients can take advantage of these features — fortunately, Cortex can be updated without downtime.
For downtime-free updates, the Cortex Ingester service requires an additional Ingester replica during the update process. (Note: translation.: — the core component of Cortex. Its task is to gather a continuous stream of samples, group them into Prometheus chunks, and store them in databases like DynamoDB, BigTable, or Cassandra. This allows old Ingesters to send current data to new Ingesters. It is worth noting that Ingesters are resource-intensive. To operate them, you need to have 4 cores and 15 GB of memory per pod, which is 25% of the CPU power and memory of the base machine in our Kubernetes clusters. Overall, we usually have much more unused resources in the cluster than just 4 cores and 15 GB of memory, so we can easily run these additional Ingesters during updates.
However, it often happens that during normal operation, none of the machines have these 25% of unused resources. We also do not strive for that: CPU and memory are always needed for other processes. To solve this problem, we decided to use . The idea is to assign Ingesters a higher priority than other (stateless) microservices. When we need to launch an additional (N+1) Ingester, we temporarily evict other smaller pods. These pods are moved to free resources on other machines, leaving a sufficiently large "gap" for launching the additional Ingester.
On Thursday, July 18, we deployed four new priority levels in our clusters: critical, high, medium and low. They were tested on an internal cluster without client traffic for about a week. By default, pods without a specified priority received medium priority, while Ingesters were assigned a class with high priority. Critical was reserved for monitoring (Prometheus, Alertmanager, node-exporter, kube-state-metrics, etc.). Our config is open, and you can view the PR .
Incident
On Friday, July 19, one of the engineers launched a new dedicated Cortex cluster for a large client. The config for this cluster did not include the new pod priorities, so all new pods were assigned the default priority — medium.
The Kubernetes cluster lacked resources for the new Cortex cluster, and the existing production Cortex cluster was not upgraded (Ingesters remained without high priority). As the Ingesters of the new cluster had a default medium priority, and the existing production pods were running without priority at all, the Ingesters of the new cluster displaced the Ingesters from the existing production Cortex cluster.
The ReplicaSet for the evicted Ingester in the production cluster detected the evicted pod and created a new one to maintain the specified number of replicas. The new pod was assigned a medium priority by default, causing an existing 'old' Ingester in production to lose resources. The result was an avalanche-like process, which led to the eviction of all Ingester pods for the Cortex production clusters.
Ingester pods are stateful and store data from the past 12 hours. This allows us to compress them more effectively before writing to long-term storage. To achieve this, Cortex shards data across series using a Distributed Hash Table (DHT) and replicates each series on three Ingester pods with quorum consistency in a Dynamo style. Cortex does not write data to Ingester pods that are down. Thus, when a large number of Ingester pods exit the DHT, Cortex cannot provide adequate replication for the records, causing them to 'drop'.
Detection and resolution
New Prometheus alerts based on the 'error budget' (error-budget-based — details will appear in a future article) began to raise alarms four minutes after the outage began. Over the next approximately five minutes, we performed diagnostics and scaled the underlying Kubernetes cluster to accommodate both new and existing production clusters.
Another five minutes later, the old Ingester pods successfully recorded their data, and the new ones started up, bringing the Cortex clusters back online.
An additional 10 minutes were spent diagnosing and fixing out-of-memory (OOM) errors from the authentication reverse proxy servers in front of Cortex. The OOM errors were caused by a tenfold increase in QPS (which we assume was due to excessively aggressive requests from client Prometheus servers).
Consequences
The total downtime was 26 minutes. No data was lost. The Ingester pods successfully uploaded all in-memory data to long-term storage. During the outage, the client Prometheus servers buffered the remote (remote) records using based on WAL (written by from Grafana Labs) and retried the failed records post-outage.
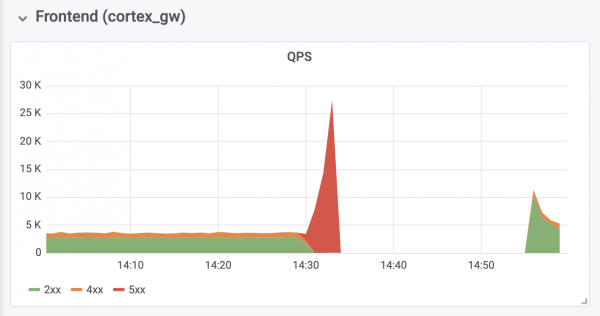
The write operations of the production cluster
Conclusions
It's important to learn from this incident and take necessary actions to prevent its recurrence.
Looking back, we must acknowledge that we should not have set a default priority until all the ingesters in production received medium priority. Additionally, we should have taken care of their high high priority in advance. Now everything is fixed. We hope that our experience will help other organizations considering the use of pod priorities in Kubernetes. We will add an additional level of control over the deployment of any additional objects whose configurations are global to the cluster. From now on, such changes will be evaluated by
a larger number of people. Furthermore, the modification that led to the failure was deemed too insignificant for a separate project document — it was only discussed in a GitHub issue. From this moment on, all such config changes will be accompanied by appropriate project documentation.higher level of isolation, as if one controller is broken, the problem is confined to that specific context).Finally, we will automate the resizing of the authentication reverse proxy to prevent OOM during overload, which we witnessed, and analyze the default Prometheus parameters related to rollback and scaling to prevent similar issues in the future.
The failure we experienced also had some positive effects: with the necessary resources at hand, Cortex automatically recovered without additional intervention. We also gained valuable experience working with
Grafana Loki Auto-scaling and resource management in Kubernetes (overview and presentation video)
P.S. from the translator
Also read in our blog:
- «»;
- «»;
- «»;
- «».
Source: habr.com
