

My name is Viktor Yagofarov, and I am developing the Kubernetes platform at DomClick as a technical development manager in the Ops (operations) team. I would like to talk about the structure of our Dev <-> Ops processes, about the features of operating one of the largest k8s clusters in Russia, as well as about the DevOps / SRE practices that our team uses.

Team Ops
The Ops team currently has 15 people. Three of them are responsible for the office, two work in a different time zone and are available, including at night. Thus, someone from Ops is always at the monitor and is ready to respond to an incident of any complexity. We do not have night shifts, which preserves our mentality and gives everyone the opportunity to get enough sleep and spend leisure time not only at the computer.
Everyone has different competencies: networkers, DBAs, ELK stack specialists, Kubernetes admins / developers, monitoring, virtualization, hardware specialists, etc. One thing unites everyone - everyone can replace any of us to some extent: for example, introduce new nodes into the k8s cluster, update PostgreSQL, write a CI / CD + Ansible pipeline, automate something in Python / Bash / Go, connect a piece of hardware to DPC. Strong competencies in any area do not interfere with changing the direction of activity and starting to pump in some other area. For example, I got a job in a company as a PostgreSQL specialist, and now my main area of responsibility is Kubernetes clusters. In the team, any growth is only welcome and a sense of shoulder is very developed.
By the way, we're looking for candidates. The requirements for candidates are pretty standard. For me personally, it's important that the person fits in with the team, is non-confrontational, but also able to defend their point of view, is willing to develop and isn't afraid to try something new, and is willing to offer their ideas. Also, programming skills in scripting languages and knowledge of the basics are required. Linux and English. English is needed simply so that if a person screws up, they can Google the solution to the problem in 10 seconds, not 10 minutes. With specialists with deep knowledge Linux It's very difficult now: it's funny, but two out of three candidates can't answer the question "What is Load Average? What is it made up of?" and the question "How to create a core dump from a C program" is considered something for superhumans... or dinosaurs. We have to put up with this, since people usually have highly developed other competencies, and we'll teach them Linux. The answer to the question "Why does a DevOps engineer need to know all this in the modern cloud world" will have to be left outside the scope of this article, but in short: all this is necessary.
Tools command
The Tools team plays a significant role in automation. Their main task is to create convenient graphical and CLI tools for developers. For example, our internal development of Confer allows you to roll out an application to Kubernetes with just a few mouse clicks, configure its resources, keys from vault, etc. There used to be Jenkins + Helm 2, but I had to develop my own tool to eliminate copy-paste and bring uniformity to the software life cycle.
The Ops team does not write pipelines for developers, but can advise on any issues in writing them (some still have Helm 3).
DevOps
As for DevOps, we see it like this:
Dev teams write code, roll it out via Confer to dev -> qa/stage -> prod. It is the responsibility of the Dev and Ops teams to ensure that the code does not slow down and does not throw errors. In the daytime, the duty officer from the Ops team should respond to an incident with his application, and in the evening and night, the duty admin (Ops) should wake up the developer on duty if he knows for sure that the problem is not in the infrastructure. All metrics and alerts in monitoring appear automatically or semi-automatically.
The area of responsibility of Ops begins from the moment the application is rolled out to the production, but the responsibility of Dev does not end there - we do one thing and are in the same boat.
Developers advise admins if they need help writing an admin microservice (for example, Go backend + HTML5), and admins advise developers on any infrastructure or k8s related issues.
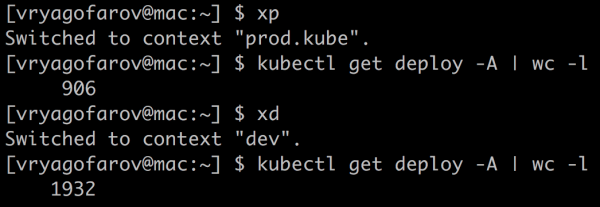
By the way, we do not have a monolith at all, only microservices. Their number so far fluctuates between 900 and 1000 in the prod k8s cluster, if measured by the number deployments. The number of pods fluctuates between 1700 and 2000. The pods in the prod cluster are now around 2000.
I can’t give exact numbers, since we monitor unnecessary microservices and cut them out in a semi-automatic mode. Keeping track of unnecessary entities in k8s helps us which saves resources and money.
Resource management
Monitoring
Competently built and informative monitoring becomes the cornerstone in the operation of a large cluster. We have not yet found a universal solution that would cover 100% of all monitoring needs, so we periodically rivet different custom solutions in this environment.
- Zabbix. Good old monitoring, which is designed primarily to monitor the overall state of the infrastructure. It tells us when a node dies by processor, memory, disks, network, and so on. Nothing supernatural, but we also have a separate DaemonSet of agents, with the help of which, for example, we monitor the DNS state in the cluster: we look for stupid coredns pods, we check the availability of external hosts. It would seem that why bother for the sake of it, but on large volumes of traffic this component is a serious point of failure. Previously I have how struggled with DNS performance in the cluster.
- Prometheus Operator. A set of different exporters gives a great overview of all cluster components. Next, we visualize all this on large dashboards in Grafana, and use alertmanager for notifications.
Another useful tool for us is . We wrote it after several times we encountered a situation where one team overlapped another team's Ingress with its paths, which caused 50x errors. Now, before deploying to production, developers check that they won’t hurt anyone, and for my team this is a good tool for the initial diagnosis of problems with Ingresses. It's funny that at first it was written for admins and it looked rather “clumsy”, but after the dev teams fell in love with the tool, it changed a lot and began to look not like “the admin made a web face for admins”. Soon we will abandon this tool and such situations will be validated even before the pipeline is rolled out.
Team resources in "Cube"
Before proceeding with the examples, it is worth explaining how we have resource allocation for microservices.
To understand which teams and in what quantities use their resources (processor, memory, local SSD), we allocate our own namespace in the "Cube" and limit its maximum capabilities in terms of processor, memory and disk, having previously discussed the needs of the teams. Accordingly, one command, in the general case, will not block the entire cluster for deployment, allocating thousands of cores and terabytes of memory to itself. Accesses to the namespace are issued through AD (we use RBAC). Namespaces and their limits are added via a pull request to the GIT repository, and then everything is automatically rolled out via the Ansible pipeline.
An example of resource allocation per team:
namespaces:

  chat-team:
    pods: 23
    limits:
      cpu: 11
      memory: 20Gi
    requests:
      cpu: 11
      memory: 20Gi
Requests and limits
Cubed" Request is the number of guaranteed reserved resources under pod (one or more docker containers) in a cluster. Limit is a non-guaranteed maximum. You can often see on the charts how some team has set itself too many requests for all its applications and cannot deploy the application to the "Cube", since under their namespace all requests have already been "spent".
The correct way out of this situation is to look at the actual resource consumption and compare it with the requested amount (Request).
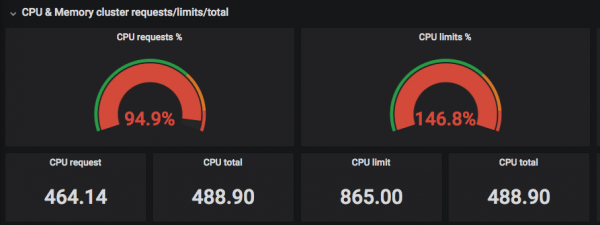
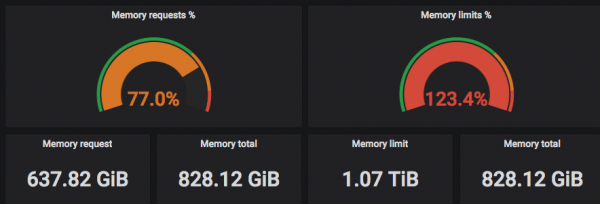
The screenshots above show that the "requested" (Requested) CPUs are selected to the real number of threads, and Limits can exceed the real number of CPU threads =)
Now let's take a closer look at some namespace (I chose the namespace kube-system - the system namespace for the components of the "Cube" itself) and see the ratio of the actually used processor time and memory to the requested one:
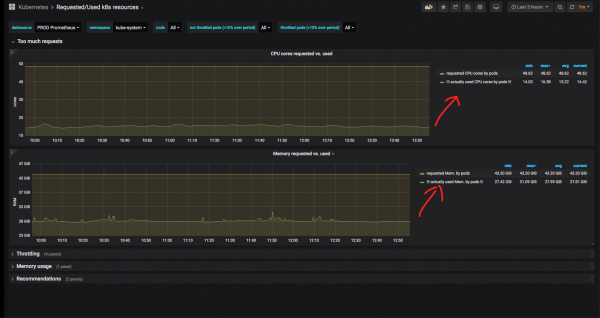
It is obvious that there is much more memory and CPU reserved for system services than is actually used. In the case of the kube-system, this is justified: it happened that the nginx ingress controller or nodelocaldns at the peak rested on the CPU and ate a lot of RAM, so here such a margin is justified. In addition, we cannot rely on charts for the last 3 hours: it is desirable to see historical metrics over a large period of time.
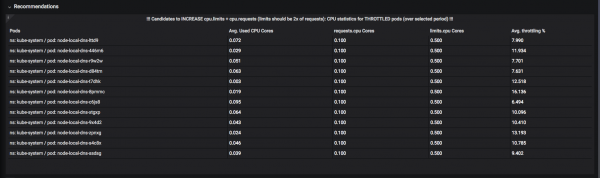
A system of "recommendations" was developed. For example, here you can see which resources would be better off raising the “limits” (the upper allowed bar) so that “throttling” does not occur: the moment when the pod has already spent the CPU or memory for the allotted time quantum and is waiting until it will be "unfrozen":
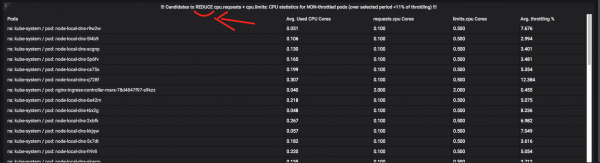
And here are the pods that should moderate their appetites:
About throttling + monitoring resources, you can write more than one article, so ask questions in the comments. In a few words, I can say that the task of automating such metrics is very difficult and requires a lot of time and balancing act with “window” functions and “CTE” Prometheus / VictoriaMetrics (these terms are in quotation marks, since there is almost nothing like this in PromQL, and you have to fencing scary queries on several screens of text and optimizing them).
As a result, developers have tools to monitor their namespaces in the "Cube", and they are able to choose where and at what time which applications can "cut" resources, and which pods can be given the entire CPU all night.
Methodologies
In company like now fashionably, we adhere to DevOps- and SRE-practitioner When a company has 1000 microservices, about 350 developers and 15 admins for the entire infrastructure, you have to “be fashionable”: behind all these “buzzwords” there is an urgent need to automate everything and everything, and admins should not be a bottleneck in processes.
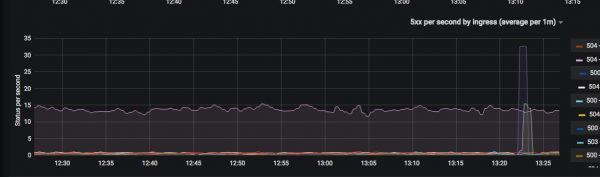
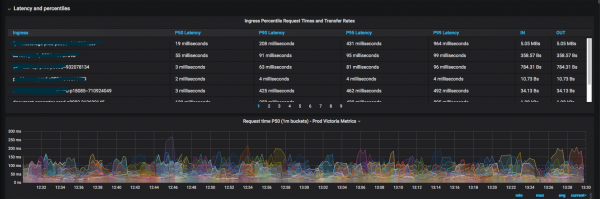
As Ops, we provide various metrics and dashboards for developers related to service response speed and service errors.
We use methodologies such as: , и by combining them together. We try to minimize the number of dashboards so that at a glance it is clear which service is currently degrading (for example, response codes per second, response time at the 99th percentile), and so on. As soon as some new metrics for general dashboards become necessary, we immediately draw and add them.
I haven't drawn graphics for a month now. This is probably a good sign: it means that most of the “wants” have already been implemented. It happened that for a week I drew some new chart at least once a day.
The resulting result is valuable in that now developers rarely go to admins with questions “where to see some kind of metrics”.
Introduction Service Mesh is just around the corner and should make life much easier for everyone, colleagues from Tools are already close to implementing the abstract “Istio of a healthy person”: the life cycle of each HTTP (s) request will be visible in the monitoring, and it will always be possible to understand “at what stage everything broke down” at interservice (and not only) interaction. Subscribe to news from the DomClick hub. =)
Kubernetes infrastructure support
Historically, we use the patched version kubespray - Ansible role for deploying, extending and updating Kubernetes. At some point, support for non-kubeadm installations was cut from the main branch, and the transition process to kubeadm was not proposed. As a result, Southbridge made its own fork (with support for kubeadm and a quick fix for critical issues).
The upgrade process for all k8s clusters looks like this:
- take kubespray from Southbridge, check with our branch, merjim.
- Rolling out the update to Stress- "Cube".
- We roll out the update one node at a time (in Ansible this is "serial: 1") in Dev- "Cube".
- Updating Prod on Saturday evening, one node at a time.
In the future there are plans to replace kubespray to something faster and go to kubeadm.
In total, we have three "Cubes": Stress, Dev and Prod. We plan to launch anotherhot standby) Prod- "Cube" in the second data center. Stress и Dev live in virtual machines (oVirt for Stress and VMWare cloud for Dev). Prod- "Cube" lives on "bare metal" (bare metal): these are the same nodes with 32 CPU threads, 64-128 GB of memory and 300 GB of SSD RAID 10 - there are 50 of them in total. Three “thin” nodes are dedicated to “masters” Prod- "Cuba": 16 GB of memory, 12 CPU threads.
For selling, we prefer to use “bare metal” and avoid unnecessary layers like OpenStack: we do not need "noisy neighbors" and CPU steal time. And the complexity of administration increases by about half in the case of in-house OpenStack.
For CI/CD Cubic and other infrastructure components we use a separate GIT server, Helm 3 atomic), Jenkins, Ansible and Docker. We love feature branches and deploy to different environments from the same repository.
Conclusion

This is how, in general terms, the DevOps process at DomClick looks like from the side of an operations engineer. The article turned out to be less technical than I expected: therefore, follow the DomClick news on Habré: there will be more “hardcore” articles about Kubernetes and more.
Source: habr.com
