
Monitoring has become a very important component of growing cloud solutions with the increasing complexity of distributed systems. It is necessary to understand their behavior. We need scalable tools that can collect data from all services - and provide specialists with a single interface with performance analysis, error demonstration, availability and logs.
These same tools must be efficient and productive. In this article, we will look at two popular technology stacks: EFK (Elasticsearch) and PLG (Loki) and analyze their architectures and differences.
EFK stack
You may have already heard of the very popular ELK or EFK. The stack consists of several separate parts: Elasticsearch (object storage), Logstash or FluentD (collection and aggregation of logs) and Kibana for visualization.
A typical workflow looks like this:

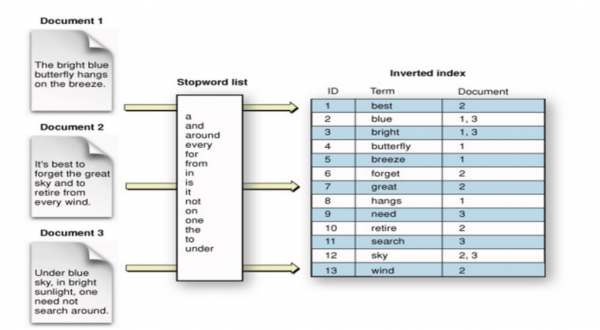
Elasticsearch — distributed object storage with real-time search and analytics. An excellent solution for semi-structured data such as logs. The information is stored as JSON documents, indexed in real time, and distributed across the cluster nodes. An inverted index containing all unique words and related documents for full-text search is used, which in turn is based on the Apache Lucene search engine.
FluentD is a data collector that unifies data as it is collected and consumed. It tries to organize the data in JSON as much as possible. Its architecture is extensible, there are more , supported by the community, for all occasions.
kibana is a data visualization tool for Elasticsearch with various additional features, such as time series analysis, graphs, machine learning, and more.
Elasticsearch Architecture
Elasticsearch cluster data is stored spread across all of its nodes. The cluster consists of multiple nodes to improve availability and resiliency. Any node can perform all cluster roles, but in large, scalable deployments, nodes are usually assigned individual tasks.
Cluster node types:
- master node - manages the cluster, you need at least three, one is always active;
- data node - stores indexed data and performs various tasks with them;
- ingest node - organizes pipelines for data transformation before indexing;
- coordinating node - request routing, reducing the search processing phase, coordinating bulk indexing;
- alerting node - launching notification tasks;
- machine learning node - processing machine learning tasks.
The diagram below shows how data is persisted and replicated across nodes to achieve higher data availability.
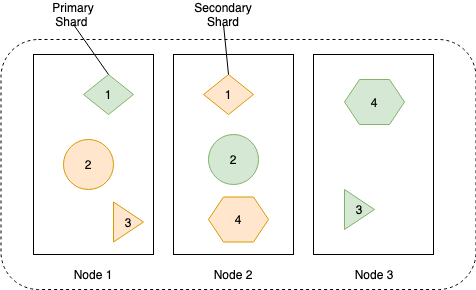
Each replica's data is stored in an inverted index, the diagram below shows how this happens:
Installation
Details can be viewed , I will use helm chart:
$ helm install efk-stack stable/elastic-stack --set logstash.enabled=false --set fluentd.enabled=true --set fluentd-elasticsPLG stack
Don't be surprised if you can't find this acronym, as it is better known as Grafana Loki. In any case, this stack is gaining popularity because it uses well-adjusted technical solutions. You may have already heard about Grafana, a popular visualization tool. Its creators, inspired by Prometheus, developed Loki, a horizontally scalable, high-performance log aggregation system. Loki only indexes the metadata, not the journals themselves, this technical solution has made it easy to use and cost effective.
Prom tail - an agent for sending logs from the operating system to the Loki cluster. grafana is a visualization tool based on data from Loki.

Loki is built on the same principles as Prometheus, so it is well suited for storing and parsing Kubernetes logs.
Loki architecture
Loki can be run as a single process or as multiple processes, allowing for horizontal scaling.
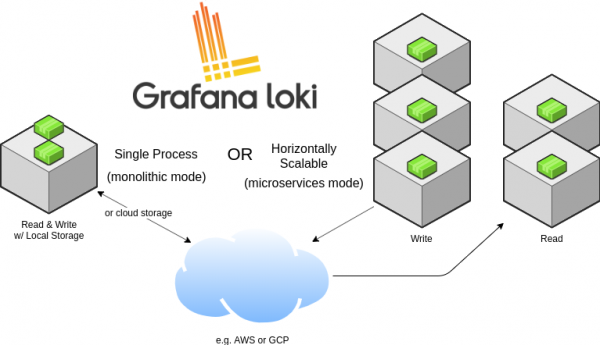
It can also work both as a monolithic application and as a microservice. Running as a single process can be useful for local development or for fine-grained monitoring. For industrial implementation and scalable workload, it is recommended to use the microservice option. The data writing and reading paths are separated, so that it can be finely tuned and scaled as needed.
Let's look at the architecture of the log collection system without detail:
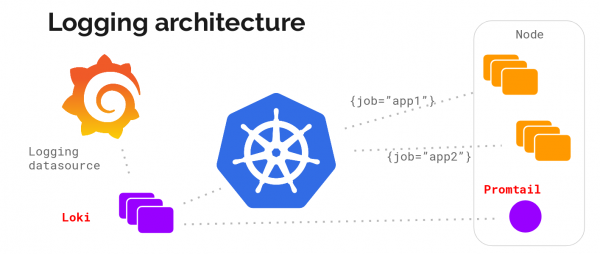
And here is the description (microservice architecture):
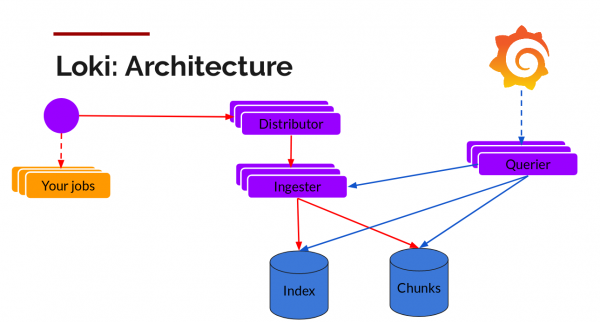
Components:
Prom tail - an agent installed on nodes (as a set of services), it removes logs from tasks and accesses the Kubernetes API to obtain metadata that will be used to mark the logs. It then sends the log to the main Loki service. For metadata matching, the same tagging rules are supported as in Prometheus.
Distributor - service-distributor, working as a buffer. To process millions of records, it packs incoming data, compressing it in blocks as it arrives. Multiple data sinks are running at the same time, but logs belonging to the same incoming data stream should end up in only one of them for all of its blocks. This is organized as a ring of receivers and sequential hashing. For fault tolerance and redundancy, it is done n times (3 if not configured).
ingester — service receiver. Data blocks come compressed with added logs. As soon as the block is of sufficient size, the block is flushed to the database. The metadata goes to the index, and the data from the log block goes to Chunks (usually object storage). After the reset, the receiver creates a new block where new records will be added.
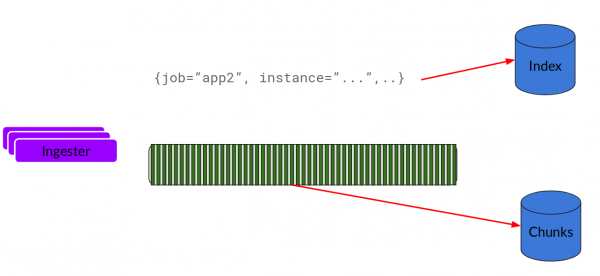
Index - database, DynamoDB, Cassandra, Google BigTable and more.
chunks - blocks of logs in a compressed form, usually stored in object storage, for example, S3.
Querier is a reading path that does all the dirty work. It looks at the time range and timestamp, and then looks at the index to look for matches. Next, it reads blocks of data and filters them to get the result.
Now let's see everything at work.
Installation
The easiest way to install on Kubernetes is to use helm. We assume that you have already installed and configured it ( approx. translator)
We add a repository and we put a stack.
$ helm repo add loki https://grafana.github.io/loki/charts
$ helm repo update
$ helm upgrade --install loki loki/loki-stack --set grafana.enabled=true,prometheus.enabled=true,prometheus.alertmanager.persistentVolume.enabled=false,prometheus.server.persistentVolume.enabled=false
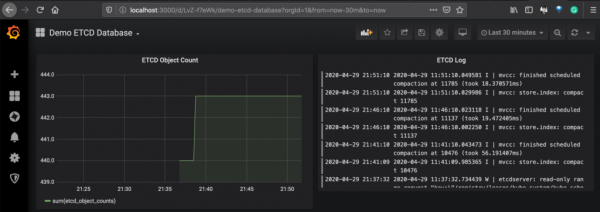
Below is an example dashboard showing data from Prometheus for Etcd and Loki metrics for Etcd pod logs.
And now let's discuss the architecture of both systems, as well as compare their capabilities with each other.
Comparison
Query Language
Elasticsearch uses the Query DSL and Lucene query language to provide full text search capability. It is an established powerful search engine with broad operator support. With it, you can search by context and sort by relevance.
On the other side of the ring is Loki's LogQL, a successor to PromQL (Prometheus query language). It uses log labels to filter and select log data. It is possible to use some operators and arithmetic as described , but in terms of capabilities, it lags behind the Elastic language.
Since requests in Loki are associated with labels, they are easy to correlate with metrics, as a result, it is easier to organize operational monitoring with them.
Scalability
Both stacks are horizontally scalable, but with Loki it is easier because it has separate read and write paths, and it has a microservice architecture. Loki can be customized to your needs and can be used for very large volumes of log data.
Multitenancy
Cluster multi-tenancy is a common theme for OPEX reduction, both stacks provide multi-tenancy. There are several for Elasticsearch customer separation: separate index per customer, customer-based routing, customer unique fields, search filters. Loki has as HTTP X-Scope-OrgID header.
Cost
Loki is very cost effective due to the fact that it doesn't index data, only metadata. Thus, and memory (cache), since object storage is cheaper than block storage, which is used in Elasticsearch clusters.
Conclusion
The EFK stack can be used for a variety of purposes, providing maximum flexibility and a rich Kibana interface for analytics, visualization, and queries. It can be further enhanced with machine learning capabilities.
The Loki stack is useful in the Kubernetes ecosystem because of the metadata discovery mechanism. You can easily correlate data for monitoring based on time series in Grafana and logs.
When it comes to cost and long-term log retention, Loki is an excellent choice for entering the cloud.
There are more alternatives on the market - some may be better for you. For example, GKE has a Stackdriver integration that provides a great monitoring solution. We did not include them in our analysis in this article.
Links:
The article was translated and prepared for Habr by employees — intensives, video courses and corporate training from practitioners (Kubernetes, DevOps, Docker, Ansible, Ceph, SRE, Agile)
Source: habr.com


